engine through the use of one-dimensional simulation. The first step in this ... Previous work within the team consisted of optimization of the intake manifold and ...
08SETC-0101
Experimental Validation of an FSAE Engine Model Jason Walkingshaw, Steven McClintock, Geoff McCullough Charlie McCartan, Geoff Cunningham Queen’s University Belfast Copyright © 2008 SAE International
The objective of the study outlined in this paper was to optimize the performance of a 600cc four-cylinder FSAE engine through the use of one-dimensional simulation. The first step in this process was to validate a baseline model of the engine in its stock, unrestricted format. This was achieved through the use of crank-angleresolved and cycle-averaged test data. The in-cylinder pressure history was also analyzed to provide combustion and friction data specific to this engine. This process significantly improved the correlation of the model with the test data and it was subsequently used to simulate and optimize the configuration of the engine planned for use in the 2008 FSAE competition. The process of validating the model, together with the specification of the subsequent optimized engine, is presented.
INTRODUCTION The Formula SAE competition involves teams designing and building a single seater race car to compete in a range of static and dynamic events. The rules [1] dictate some engine limitations, such as the use of a four-stroke engine with a maximum displacement of 610cc. The fuel used can be gasoline or bio-ethanol combined with a 20mm or 19mm diameter restrictor respectively, downstream of the throttle. Optimizing the engine design quickly and cost effectively within the short design period is a considerable challenge. 1-D engine simulation packages are often employed but the success of this approach relies on the accuracy of the model used. An accurate model can assist in optimizing the complete engine configuration from manifold pipe lengths, inlet plenum volume, valve lift profiles and restrictor geometry. With the intelligent optimization techniques utilized by modern software packages, numerous permutations of engine geometries can be simulated with the aim of maximizing engine performance across the useful speed range.
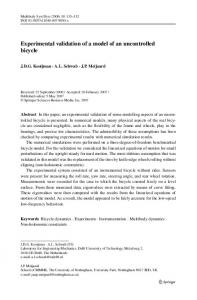
phase. This included over-prediction of torque particularly at lower engine speeds. It was suspected that this was caused by the use of default, rather than engine-specific, input data in the areas of combustion, heat loss and engine friction. Since this engine is fitted with an inlet restrictor, which reduces the airflow at wide open throttle, the input parameters for each of the processes being simulated by the model will differ from the standard un-restricted settings. Figure 1 shows a comparison of measured and predicted torque and highlights the extent of the error. A number of papers [4,5,6] have suggested that a more successful engine design can be achieved through a combination of simulation and empiricism. This can be accomplished with the insight provided by an accurate model into the various phenomenon occurring in the engine and the unsteady gas behavior in the engine ducting. Furthermore, the use of a flexible program to accommodate user inputs offers the opportunity of obtaining a more complete and accurate model. Having the ability to assess different engine concepts via simulation allows educated decisions to be made sooner while still meeting the challenges of cost reduction, time constraints and ever evolving rule and regulation changes [7,8]
65 60
Corrected BrakeTorque (Nm)
ABSTRACT
55 50
Predicted
45
Measured
40 35 30 25 4000
5000
6000
7000
8000
9000
10000
11000
12000
Engine Speed (RPM)
Previous work within the team consisted of optimization of the intake manifold and intake camshaft [2,3]. However, the model predictions showed disparity from the measured results during the experimental test
Figure 1: Extent of discrepancies in original engine model
To update the inputs used in the engine simulation software, a number of experiments were designed to measure the required input data and provide values to validate the model. The data required consisted of cycle averaged torque, air flow and emissions. Furthermore, crank angle-resolved measurements of in-cylinder and manifold pressure histories were necessary to analyze the burn characteristics and heat loss rates to validate the predicted gas dynamics. Discussed is the process of gathering engine specific data to validate the model.
1-D MODEL DEVELOPMENT The Virtual Engines(VE) 1-D engine simulation package [10] was used to provide the predicted performance figures in this study. This software can track pressure wave propagation throughout the engine’s ducting [11] which is necessary to predict the mass of air trapped in the cylinder at the beginning of the closed cycle. The engine geometry and the test setup used on the dynamometer was input into VE to begin comparison and validation. The engine used was a Yamaha 1999 YZF R6 motorcycle engine, the general specification of which is shown in Table1. Tables 2, 3 and 4 summarize the geometry of the intake system, the valve lift profiles and the exhaust system respectively. The labeling convention corresponds to that used in Figure 2 with the exception of those components in italics which are contained as sub-groups within P25 and P3 of the intake and exhaust system. Table 1: General Engine Specification
Component P2 P25 Intake Port 1 Intake Port 2
Length (mm) 70.9 106.6 40 80
Entrance Diameter (mm) 38.0 38.0 38 34.5
Exit Diameter (mm) 38.0 38.0 34.5 34.5
Table 3: Valve Timing
Open Angle Close Angle Peak Lift Angle Duration (deg Crank Shaft) Max Lift (mm)
Intake Valves
Exhaust Valves
64(deg btdc)
69(deg bbdc)
73(deg abdc)
38(deg atdc)
83 (deg bbdc)
107(deg btdc)
317
287
7.9
7.3
Table 4: Exhaust Geometry of the 4-2-1 System used
Inline 4, 4 stroke, 16 valve DOHC Displacement (cc) 599 Bore (mm) 65.5 Stroke (mm) 44.5 Compression Ratio 12.4:1 Squish Clearance(mm) 1.3 Firing Order 1-3-4-2 Engine Type:
Table 2: Intake Geometry
Component Exhaust Port P3 P5 P6 Tail Pipe
Figure 2: Flow Diagram of Yamaha R6
Length (mm) 80.0 335.0 325.0 80.0 120.0
Entrance Diameter (mm) 30.5 33.0 33.0 33.0 47.0
Exit Diameter (mm) 30.5 33.0 33.0 33.0 47.0
The validation process was performed in several stages, starting with the most simple engine configuration. The inlet manifold and restrictor required by the FSAE rules was removed from both the test engine and the model. These components were replaced by individual inlet pipes and throttles thereby removing complex 3-D flow fields that exist in the plenum. The model was submitted for simulation at wide open throttle at engine speeds of 4000 to 12000 RPM.
compact design of the engine head, entry into the combustion chamber was achieved via the water jacket plug between the spark plug channels. On removal of the standard plug the cylinder head was machined to provide access to the combustion surface. Figure 4 shows the location of the hole in the combustion chamber.
Location of hole in combustion chamber
EXPERIMENTAL SETUP Cycle Averaged Data The engine was connected to a 145kW Schenck AC dynamometer via the gearbox output shaft. Exhaust emissions and the AFR were measured using a Horiba MEXA-7170DEGR exhaust gas analyzer. The airflow was measured using a Delphi hot film air flow meter which was calibrated on a steady air flow rig. The intake for the unrestricted engine was connect to an air box of 0.45m3 to reduce the amplitude of the pulses generated by the induction strokes and to provide steady flow to the air flow meter. An adaptor/plenum was constructed using a rapid prototyping system, to convert the circular pipe section of the air box to the rectangular shape of the intake on the engine. This configuration can be seen in Figure 3.
Air Mass Flow Meter
Adaptor/Plenum
Figure 4: Modification to Head for Transducer
The in-cylinder pressure was measured using a Kistler piezo-electric transducer. To locate the pressure transducer a two piece sleeve was used. This consisted of a specially manufactured water jacket plug that would hold the sleeve which in turn would house the pressure transducer. Each of these mating surfaces were sealed with high temperature gaskets. To seal the transducer sleeve/combustion chamber interface, a machined metal to metal surface between the tip of the transducer sleeve and the inside face of the water jacket proved successful. Figure 5 shows a model of this configuration.
Air Box
Figure 3: Inlet System for Unrestricted Tests
High Speed Crank Angle Resolved Data In order to measure the heat release rates during the combustion process, in-cylinder pressure traces were required. These were analyzed and used to yield the Wiebe burn coefficients which were subsequently used to improve the accuracy of the model. Due to the
Figure 5: Head layout to Accommodate Transducer
Encoder Obtaining the crank angle-resolved data required the installation of a crankshaft encoder. With the use of an optical rotary crank shaft encoder, cylinder pressure traces relative to crank angle were obtained. From this heat release rates and combustion temperatures were calculated. Accurate pegging of TDC is essential in obtaining IMEP and burn characteristics, as an offset of 1˚ crank angle can result in an error of up to 10% in the subsequent IMEP calculation [9]. An encoder capable of dealing with engine speeds in excess of 12000RPM was required which is over twice the rated speed of standard automotive encoders [12,13]. While commercial encoders are available for high speed applications, they are expensive and still encounter problems due to the large fluctuations in crank shaft speed during the power strokes. These high angular accelerations resulted in the failure of several shafts used to connect the crank shaft to a commercial high-speed encoder. It was suspected that this problem could be mitigated by reducing the inertia of the encoder, a task that could achieved only through the use of a bespoke design. Minimizing the inertia of the disc has the additional advantage of reducing the angular strain on the shaft and thereby improving the accuracy of the crank shaft angular measurement. A three part configuration consisting of a shaft, disc support and disc was used. The disc was cut from 0.5mm sheet steel with a diameter of 100mm. It was manufactured by EDM which allowed 180 teeth to be cut at the outer diameter with a TDC trigger marker machined on a smaller diameter. Optical pickups supported by the engine block were used to detect the leading edge of these teeth. A digital phase lock loop circuit increased the frequency of the crank angle signal by a factor of two before it was fed to the external clocking input of the high-speed data acquisition system. A sample was therefore recorded from each of the high speed transducers at a resolution of 1 degree. Using an AVL TDC sensor true TDC was determined dynamically during motoring. This provided TDC location to a resolution of ±0.1 degrees crank angle. This, when coupled with the encoder provided the offset between actual TDC and the TDC trigger. The offset was removed by the high-speed data acquisition system during the subsequent tests. The encoder can be seen mounted on the engine in Figure 6.
• • • • • • •
Start of Burn (˚CA) End of Burn (˚CA) Burn Duration (˚CA) 10% Burn Angle (˚CA) 50% Burn Angle (˚CA) Wiebe A (-) Wiebe M (-)
Disc
Shaft
Disc Support
Figure 6: Crank Shaft Encoder Mounted on Engine Combustion Data PTrAc and PTrAn hardware and software [14] were used to record and analyze the combustion data. At each steady state test condition 300 cycles were recorded and averaged to remove the effects of cycle variability. The real cycle closest to the statistically averaged cycle was then used for subsequent processing. In addition to performing this statistical analysis, the PTrAn software also applies the Rassweiler and Withrow [15] theory to the in-cylinder pressure history to provide the following data:
A list of the measured data recorded from the unrestricted engine test is provided in Table 5. This data was recorded at full load at 1000RPM intervals in the speed range 4000-12000RPM.
Table 5: Data recorded during Experimental Test Phase 250
rpm kg/hr ˚C ˚C ˚C ˚C and Pa Pa % vol kW Nm bar bar (-)
MODEL CORRELATION The burn data provided by PTrAn was used as an initial starting point in updating the model. On running the simulation, comparisons were made between the airflow rates. If the predicted mass of air trapped in the cylinder at the beginning of the closed cycle is incorrect, then all of the subsequent predictions will also be inaccurate. Figure 7 shows an excellent trend between the measured and predicted airflow data. Good correlation was also achieved with modification of the burn model within the software. Using the data provided by PTrAn Figure 8 shows the correlation between the in-cylinder pressure traces provided by testing and simulation. The IMEP and BMEP that had been gathered during the validation phase were then used in providing a friction model specific to the test engine. With these modifications the initial errors in the predicted torque at lower engine speeds had now were removed and much better correlation at the higher engine speeds had been achieved. The final comparison is shown in figure 9.
AirFlowRate (kg/hr)
Pa Pa Pa kg/hr Degrees
200
Predicted
Measured
150
100
50 4000
5000
6000
7000
8000
9000
10000
11000
12000
Engine Speed (RPM)
Figure 7: Measured and Predicted Airflow of the Unrestricted 1999 Yamaha R6 In-Cylinder Pressure at 11000RPM 90 80
Predicted
Cylinder Pressure (bar)
Crank-Angle Resolved Inlet port pressure trace Exhaust port pressure trace In-Cylinder pressure trace Engine air flow Crank angle Cycle Averaged Engine Speed Fuel flow Exhaust port temperatures Water temperature inlet and outlet Oil temperature Test cell air temperature and pressure SAE air box pressure Emissions CO, CO2, HC, O2, NOX Corrected power Corrected torque IMEP PMEP AFR
Units
70
Measured
60 50 40 30 20 10 0 -250
-200
-150
-100
-50
0
50
100
150
200
250
Crank Angle (Degrees)
Figure 8: In-Cylinder Pressures Obtained with Modified Burn Data 65 60
Corrected BrakeTorque (Nm)
Measured Variables
55
Predicted
Measured
50 45 40 35 30 25 4000
5000
6000
7000
8000
9000
10000
11000
12000
Engine Speed (RPM)
Figure 9: Predicted Torque Verses Measured After Model Modification
OPTIMISATION OF RESTRICTED ENGINE
Table 6: Variables used in optimization process Parameter Exhaust Pipe Primary Length (mm) Intake Runner Lengths (mm) Plenum Length (cc) Intake Cam: Peak Lift Angle(°) Intake Cam: Lift Table Multiplier Intake Cam: Lift Duration multiplier Exhaust Cam: Peak Lift Angle (°) Exhaust Cam: Lift Table Multiplier Exhaust Cam: Lift Duration multiplier Restrictor Diffuser Length(mm)
Range
Step
Optimum
260-400
20
400
100-300
20
260
240-590
50
400
458-518
5
460
0.8-1.0
0.01
1
0.8-1.0
0.01
0.81
241-331
5
250
0.8-1.0
0.01
1
0.8-1.0
0.01
0.86
120-220
20
140
80 75
Corrected BrakeTorque (Nm)
Using the updated combustion and friction models, the 1-D engine simulation software was then used to develop the engine for the 2008 FSAE competition. The engine used is Yamaha 2003 YZF R6 600 which has slightly updated geometry from the engine used for the model validation phase. The restrictor and intake plenum were added to the model to accurately represent the engine in the FSAE configuration. The engine geometry in the model was also updated. The predictions of the 2005 engine showed good accuracy in comparison with the measured cycle-averaged data. The Automated Design feature of the engine simulation package was then used to find an improved engine configuration in its restricted format. Using intelligent optimization algorithms, this software analyses feedback from simulation results to guide its choice of inputs for the next simulation, and therefore converges on an optimum design within the ranges of the chosen parameters. Ten parameters relating to the camshaft profiles, manifold runner lengths and restrictor length were selected for this process as these were considered to have the most significant influence on engine performance. The specific parameters are listed in Table 6, together with the ranges within which the optimization software was permitted to operate. Some of these ranges, such as intake and exhaust primary pipe lengths, were constrained by packaging considerations. In addition, it was desirable that the modified camshaft profiles could be manufactured from the existing stock camshafts and so the peak lift and duration multipliers were limited to a value of 1.0. The parameters selected, together with their ranges and step sizes give a total of 2x10¹¹ possible combinations. The optimum values chosen by the software are also listed in Table 6, while Figure 10 shows the predicted improvement in torque output.
Optimized Engine
70 65 60 55 50
Baseline Engine
45 40 5000
6000
7000
8000
9000
10000
11000
12000
Engine Speed (RPM)
Figure 10: Predicted Optimized Engine
Performance
Gains
from
The most significant changes suggested by the optimization process were to the camshaft durations and timings. The stock camshaft profiles fitted to the standard engine allow valve overlap of 90 degrees crank angle which facilitates scavenging of exhaust gases from the clearance volume at high-speed, full load operation. However, when the inlet restrictor is fitted, the inlet manifold pressure is sub-atmospheric under all operating conditions which results in significant reverse flow of exhaust gas to the inlet pipe during the valve overlap phase. This exhaust gas then re-enters the cylinder during the subsequent induction stroke and therefore reduces the intake of fresh charge. The optimized camshaft profiles reduce this negative effect by reducing the overlap angle. The closing angle of the inlet valve is also advanced to reduce the reverse flow of fresh charge out of the cylinder during the initial phase of the compression stroke. There are two points to note about these modified profiles. Firstly, the changes to the valve timings increase torque output at the low to mid-range engine speeds. At high engine speeds, these settings would substantially reduce the performance of the stock engine in its unrestricted format. However, it is at these higher speeds that the restrictor required by the FSAE rules begins to reduce the airflow rate. The restrictor therefore becomes the limiting factor in the airflow and disguises the adverse effects of the modified camshafts at these speeds. Secondly, the simulation provides the optimum valve timings from a thermodynamic perspective, but does not consider the viability of these settings from material stress, valve train dynamics or camshaft manufacturing perspectives. The mechanical design of these camshafts is therefore considered in detail by McClintock [16].
CONCLUSION Through extensive testing of an unrestricted 1999 Yamaha YZF-R6 engine the information gathered helped establish the listed influential factors in engine simulation. 1.
The data gathered was successfully used to update and validate a 99 Yamaha R6 unrestricted model. Close correlation between the simulated and measured data was achieved.
2.
The improved combustion and friction models were successfully transferred and used to validate and optimize a restricted 2005 Yamaha R6 model.
3.
The process of optimizing engine performance can be greatly assisted through the use of 1-D simulation. However, a validated baseline model is required before the optimization process can begin.
ACKNOWLEDGMENTS The authors would like to thank the Queen’s University of Belfast School of Mechanical & Aerospace Engineering for providing access to engine test facilities. In addition, the support of Optimum Power Technology in providing the Virtual Engines licences is greatly appreciated. Further thanks are extended to Michael McCauley, Daire Corrigan and Russell McKee for their contribution and practical assistance throughout the duration of the project.
REFERENCES 1. IMechE, “Formula Student”, Internet, www.formulastudent.com, viewed on 05/01/2008 2. R .H. McKee, G. McCullough, G. Cunningham, J.O. Taylor, N. McDowell, J. T. Taylor and R. McCullough, “Experimental Optimisation of Manifold and Camshaft Geometries for a Restricted 600cc Four-cylinder Four-stroke Engine” SAE 2006-320070 3. James Taylor, Russel McKee, Geoff McCullough, Geoff Cunningham, Charlie McCartan, “Computer Simulation and Optimisation of an Intake Camshaft for a Restricted 600cc Four-Stroke Engine” SAE 06SETC-174 4. G.P. Blair, D.O. Mackey, M.C. Ashe and G.F. Chatfield, "On Improving the Accuracy of the Simulation of Reciprocating Engines", IMechE Paper No.C587/001/2000 5. Gordon P Blair, Dermot O Macky, “Racing Engine Design Options Investigated by Engine Simulation” SAE 2000-01-3546
6. G. P. Blair, “Empiricism and Simulation In the Design of the High Performance Four-Stroke Engine” SAE 983046 7. Benjamin Ferguson and Russell Wakeman, “Developing Race Engines using Advanced CAE Tools”, SAE 2004-01-3510 8. H. – M. Koegeler, G. Regner, T. Sams and K. Gschweitl, “Using Simulation and Optimization Tools to Decide Engine Design Concepts”, SAE 2000-01-1267 9. R. Douglas, R. J. Kee, B. P. Carberry, “Analysis of In-Cylinder Pressure Data in Two-Stroke Engines”, SAE 972792 10. VIRTUAL ENGINES Engine Simulation Software, VIRTUAL 4-Stroke and VIRTUAL 2-Stroke, Optimum Power Technology, Bridgeville, PA, www.optimum-power.com, viewed on 05/01/2008 11. G. P. Blair, “Design and Simulation of Four-Stroke Engines”, Society of Automotive Engineers, 0-76800440-3, 1999 12. AVL Powertrain Engineering and Testing Solutions, AVL LIST GMBHHans-List-Platz 1, A 8020 Graz, www.avl.com, viewed on 05/01/2008 13. Kistler, Kistler Instruments Ltd, 13 Murrell Green Business Park, London Road Hook, Hampshire RG27 9GR / UK, United Kingdom, www.kistler.com, viewed on 05/01/2008 14. PTrAc and PTrAn Pressure Trace Acquisition and Analysis, Hardware and Software, Optimum Power Technology, Bridgeville, PA, www.optimumpower.com, viewed on 05/01/2008 15. G. M. Rassweiler, L. Withrow, “Motion Pictures of Engine Flames Correlated with Pressure Cards”, SAE 800131 16. S. McClintock, J. Walkingshaw, C. McCartan, G. McCullough, G. Cunningham, “Camshaft Design for an Inlet-Restricted FSAE Engine”, 08SETC-0091
NOMENCLATURE RPM AFR EDM TDC ATDC BTDC ABDC BBDC BMEP FMEP IMEP PMEP PTrAc PTrAn VE QFR
Engine speed in rotations per minute Air Fuel Ratio Electro Discharge Machining Top Dead Centre After Top Dead Centre Before Top Dead Centre After Bottom Dead Centre Before Bottom Dead Centre Brake Mean Effective Pressure Friction Mean Effective Pressure Indicated Mean Effective Pressure Pumping Mean Effective Pressure Pressure Trace Acquisition Pressure Trace Analysis Virtual Engines Queen’s Formula Racing