Aug 7, 2000 - 4University of Illinois at Urbana-Champaign, Urbana, Illinois 61801. 5Thomas ... Bloom and Gilman's quark-hadron duality qualitatively.
VOLUME 85, NUMBER 6
PHYSICAL REVIEW LETTERS
7 AUGUST 2000
Experimental Verification of Quark-Hadron Duality I. Niculescu,1 C. S. Armstrong,2 J. Arrington,3 K. A. Assamagan,1 O. K. Baker,1,5 D. H. Beck,4 C. W. Bochna,4 R. D. Carlini,5 J. Cha,1 C. Cothran,6 D. B. Day,6 J. A. Dunne,5 D. Dutta,7 R. Ent,5 B. W. Filippone,3 V. V. Frolov,8 H. Gao,4 D. F. Geesaman,9 P. L. J. Gueye,1 W. Hinton,1 R. J. Holt,4 H. E. Jackson,9 C. E. Keppel,1,5 D. M. Koltenuk,12 D. J. Mack,5 D. G. Meekins,2,5 M. A. Miller,4 J. H. Mitchell,5 R. M. Mohring,10 G. Niculescu,1 D. Potterveld,9 J. W. Price,8 J. Reinhold,9 R. E. Segel,7 P. Stoler,8 L. Tang,1,5 B. P. Terburg,4 D. Van Westrum,11 W. F. Vulcan,5 S. A. Wood,5 C. Yan,5 and B. Zeidman 9 1 Hampton University, Hampton, Virginia 23668 College of William and Mary, Williamsburg, Virginia 23187 3 California Institute of Technology, Pasadena, California 91125 4 University of Illinois at Urbana-Champaign, Urbana, Illinois 61801 5 Thomas Jefferson National Accelerator Facility, Newport News, Virginia 23606 6 University of Virginia, Charlottesville, Virginia 22904 7 Northwestern University, Evanston, Illinois 60208 8 Rensselaer Polytechnic Institute, Troy, New York 12180 9 Argonne National Laboratory, Argonne, Illinois 60439 10 University of Maryland, College Park, Maryland 20742 11 University of Colorado at Boulder, Boulder, Colorado 80309 12 University of Pennsylvania, Philadelphia, Pennsylvania 19104 (Received 14 May 1999) 2
A newly obtained sample of inclusive electron-nucleon scattering data has been analyzed for precision tests of quark-hadron duality. The data are in the nucleon resonance region, and span the range 0.3 , Q 2 , 5.0 共GeV兾c兲2 . Duality is observed both in limited and extended regions around the prominent resonance enhancements. Higher twist contributions to the F2 structure function are found to be small on average, even in the low Q 2 regime of 艐0.5 共GeV兾c兲2 . Using duality, an average scaling curve is obtained. In all cases, duality appears to be a nontrivial property of the nucleon structure function. PACS numbers: 13.60.Hb, 12.38.Qk
The interpretation of the resonance region in inclusive electron-proton scattering and its possible connection with deep inelastic scattering has been a subject of interest for nearly three decades since quark-hadron duality ideas, which successfully described hadron-hadron scattering [1], were first extended to electroproduction. Bloom and Gilman [2] showed that it was possible to equate the nucleon resonance region structure function nW2 共n, Q 2 兲 (at some typically low Q 2 value) to the structure function F2 in the deep inelastic regime of electron-quark scattering (at some higher value of Q 2 ). These structure functions are obtained from inclusive electron-nucleon scattering where the substructure of the nucleon is probed with virtual photons of mass-squared 2Q 2 and energy n. The resonance structure function was demonstrated to be equivalent in average to the deep inelastic one, with these averages obtained over the same range in a scaling variable v 0 苷 1 1 W 2 兾Q 2 , where W is the invariant mass. Bloom and Gilman’s quark-hadron duality qualitatively explained the data in the range 1 # Q 2 # 10 共GeV兾c兲2 . This relationship between resonance electroproduction and the scaling behavior observed in deep inelastic scattering suggests a common origin for both phenomena. Inclusive deep inelastic scattering on nucleons is a firmly established tool for the investigation of the quark-parton model. At large enough values of W and Q 2 , quantum 1186
0031-9007兾00兾85(6)兾1186(4)$15.00
chromodynamics (QCD) provides a rigorous description of the physics that generates the Q 2 behavior of the nucleon structure function F2 苷 nW2 . The well-known logarithmic scaling violations in the F2 structure function of the nucleon, predicted by asymptotic freedom, played a crucial role in establishing QCD as the accepted theory of strong interactions [3,4]. However, as Q 2 decreases, the description of the nucleon’s structure cannot be expressed in terms of single parton densities with simple logarithmic behavior in Q 2 . Inverse power violations in Q 2 , physically representing initial and final state interactions between the struck quark and the remnants of the target (termed higher twist effects), must be taken into account as well. An analysis of the resonance region in terms of QCD was first presented in [5,6], where Bloom and Gilman’s approach was reinterpreted, and the integrals of the average scaling curves were equated to the n 苷 2 QCD moments of the F2 structure function. An example is the CornwallNorton moments of the structure function, expressed as R 1 n22 F2 共x兲 dx [7], where x 苷 Q 2 兾2Mn is the Bjorken 0x scaling variable, M is the nucleon mass, and n is an integer index. These moments can be expanded, according to the operator product expansion, in powers of 1兾Q 2 , and the fall of the resonances along a smooth scaling curve with increasing Q 2 was explained in terms of this QCD twist expansion of the structure function. The conclusion © 2000 The American Physical Society
PHYSICAL REVIEW LETTERS
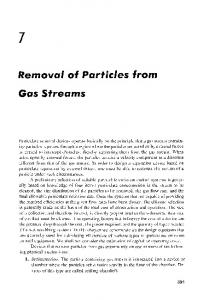
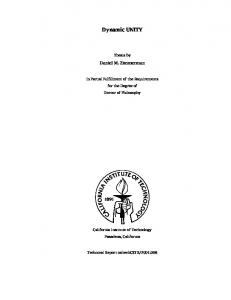
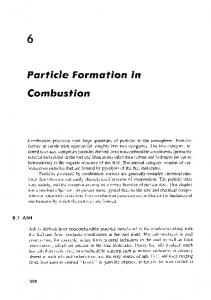
Here, a is the fine structure constant, u is the electron scattering angle, and E 0 is the scattered electron energy. R 苷 sL 兾sT is the ratio of longitudinal to transverse cross sections. R will be measured at JLab [16], but is currently unknown at the 6100% level in the resonance region for Q 2 $ 1 共GeV兾c兲2 [17]. The possible variation of R effects a 2% systematic uncertainty in the extracted F2 data. Sample nW2 spectra extracted from the measured differential cross sections from hydrogen are plotted in Fig. 1 as a function of the Nachtmann scaling variable j 苷 2x兾 p 共1 1 1 1 4M 2 x 2 兾Q 2 兲. It has been shown that j is the correct variable to use in studying QCD scaling violations in the nucleon [5,18]. The arrows indicate x 苷 1 (elastic scattering) kinematics for the four values of Q 2 shown. The solid and dashed curves are from a parametrization [19] of deep inelastic proton structure function data at Q 2 苷 10 and 5 共GeV兾c兲2 , respectively. Notice that the resonance spectra at higher (lower) Q 2 appear at higher (lower) j on the deep inelastic scaling curve, but that the curve generally represents an average of the data at the disparate kinematics. This is a qualitative manifestation of the original Bloom and Gilman observation. Because the data were obtained at fixed spectrometer angles, while varying the central momenta, the raw spectra in missing mass (W 2 ) cover a range in Q 2 . The spectra in Fig. 1 have been adjusted using a global inclusive
7 AUGUST 2000
0.45 0.4 0.35 0.3
νW2
of [5] was that changes in the lower moments of the F2 structure function due to higher twist effects are small, so that averages of this function over a sufficient range in x at moderate and high Q 2 are approximately the same. Duality is expected to hold so long as O共1兾Q 2 兲 or higher inverse power scaling violations are small. Substantial progress has been made both theoretically in understanding QCD in the past 20 years and experimentally in determining the scaling behavior of the F2 structure function. Combining the latter with the new precision resonance data presented here [8], it is now possible to revisit quark-hadron duality with a more quantitative approach, addressing the recent theoretical interest in the topic (see, for example, [9–15]). The data were obtained in Hall C, using the CEBAF accelerator at Jefferson Lab (JLab). Electron beam energies between 2.4 and 4 GeV, with currents between 20 and 100 mAmps were incident on 4 and 15 cm long liquid hydrogen and deuterium targets. Scattered electrons were detected in both the high momentum spectrometer (HMS) and the short orbit spectrometer (SOS), each utilized in a single arm mode to measure the inclusive cross sections. Nine spectra were obtained for hydrogen, covering the invariant mass range 1.0 , W 2 , 4.0 GeV2 , with central four-momenta in the range 0.3 # Q 2 # 5.0 共GeV兾c兲2 . The structure function F2 共苷 nW2 兲 was extracted from the measured differential cross section s, using ∏ ∑ µ ∂ µ ∂ snQ 4 1 1 n 2 兾Q 2 2 u 2 u 1 2 sin . 苷 F cos 2 4a 2 E 02 2 2 R11 (1)
0.25 0.2 0.15 0.1 0.05 0.450 0.4 0.35 0.3
νW2
VOLUME 85, NUMBER 6
0.25 0.2 0.15 0.1 0.05 0
0.2
0.4
0.6
ξ
0.8
1
0.2
0.4
0.6
0.8
1
ξ
FIG. 1. Sample hydrogen nW2 structure function spectra obtained at Q 2 苷 0.45, 0.85, 1.70, and 3.30 共GeV兾c兲2 and plotted as a function of the Nachtmann scaling variable j. Arrows indicate elastic kinematics. The solid [dashed] line represents the NMC fit [23] of deep inelastic structure function data at Q 2 苷 10 共GeV兾c兲2 [Q 2 苷 5 共GeV兾c兲2 ].
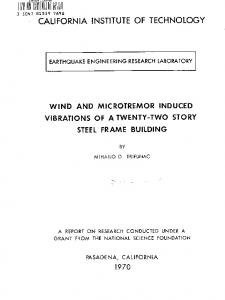
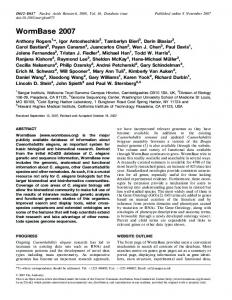
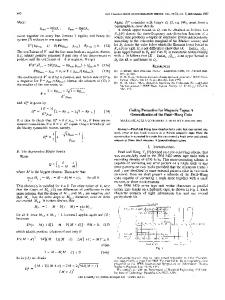
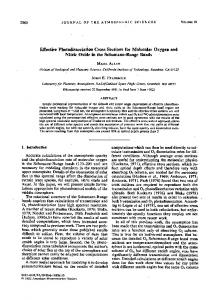
resonance region data fit [17] to Qo2 , the Q 2 value at W 2 苷 2.5 GeV2 for each. The difference between the raw and adjusted spectra is 艐3% when integrated. The statistical uncertainty in the data is 艐1%, smaller than the symbols plotted. The overall systematic uncertainty in the cross sections due to experimental considerations such as target density, beam charge, beam energy, spectrometer acceptance, radiative corrections, detection efficiency, and the value of R, is 3.5% and is not depicted. To quantify the observed duality, we show in Fig. 2 the Q 2 dependence of the integral ratio quantity I(res兾DIS), the ratio of the structure function F2 obtained from the hydrogen resonance data, integrated over the region from pion threshold to the onset of the deep inelastic regime (W 2 苷 4 GeV2 ), compared to the indicated deep inelastic structure functions integrated over the same region of j: Rj共W 2 苷1.1兲 data 共j, Qo2 兲 dj j共W 2 苷4.0兲 F2 . (2) I共res兾DIS兲 苷 Rj共b兲 scaling 2 苷 10兲 dj F 共j, Q 2 j共a兲 Here, j共a, b兲 correspond to the same value of j used in the numerator integral, which at the higher Q 2 of the deep inelastic data no longer correspond to W 2 苷 共4.0, 1.1兲, but to some higher W 2 苷 共a, b兲. The range 1.1 # W 2 # 4.0 GeV2 is the resonance region of the data. In all cases but the resonance fit (discussed below), the scaling region structure functions are integrated as a function of j at fixed Q 2 苷 10 共GeV兾c兲2 . The higher W 2 deep inelastic data are, for the same region in j, at higher Q 2 . The integral ratio data are plotted as a function of the fixed Q 2 苷 Qo2 values associated with the measured resonance spectra. 1187
Res/DIS
VOLUME 85, NUMBER 6
PHYSICAL REVIEW LETTERS
2.2 2 1.8 1.6 1.4 1.2 1 Resonance fit 2
0.8
2
MRS(G) LQ (Q = 10 (GeV/c) ) CTEQ4 LQ (Q2 = 10 (GeV/c)2) NMC param (Q2 = 10 (GeV/c)2)
0.6 0
1
2
3
4
5
6
2
7
Q (GeV/c)
8
2
FIG. 2. The ratios of integrals I共res兾DIS兲, as defined by Eq. (2). The DIS denominators are from the NMC (circles), CTEQ4 low Q 2 (squares), and MRS(G) low Q 2 (stars), parametrizations of deep inelastic data at Q 2 苷 10 共GeV兾c兲2 . The triangles use the resonance fit as the DIS denominator. The dashed line indicates what this ratio would be if the NMC curve were obtained at Q 2 苷 5 共GeV兾c兲2 .
The uncertainties shown represent the experimental uncertainty in the numerator integral only, obtained from the correlated systematic uncertainties in the resonance data. The high Q 2 [above 4 共GeV兾c兲2 ] numerator values are generated from a global fit to inclusive SLAC resonance region data [17] and are assigned an uncertainty representing a combination of experimental uncertainty and normalization considerations involved in utilizing the older data sets [20]. Also shown are very low Q 2 [,0.5 共GeV兾c兲2 ] resonance data from SLAC [21]. When used to obtain the deep inelastic denominator of the ratios in Fig. 2, the CTEQ4 LQ [22] and MRS(G) LQ [19] scaling curves display a marked deviation from unity which increases with Q 2 . This is not necessarily due to higher twist effects, but rather to the difficulty in accurately modeling the large j behavior of the structure function. With increasing Q 2 , the moments are determined by a smaller and smaller region near j 苷 1. Unfortunately, there is a limited amount of deep inelastic F2 data currently available at large j and x, and these curves fall below both the average resonance data and the NMC parametrization above j * 0.7. This discrepancy between the available parametrizations and the data at high j and x is not new to this work. Because we are attempting to describe a new experimental result, and a study of the available deep inelastic parametrizations is beyond the scope of this paper, we present the data in comparison to parametrizations which are well known, commonly utilized, and readily available. 1188
7 AUGUST 2000
The points on Fig. 2 labeled NMC represent ratios obtained using a parametrization of lower x deep inelastic F2 data from CERN [23], which links smoothly to a global fit [20] to higher x deep inelastic data from SLAC, in the denominator integral. Because this is a fit to the data, it may implicitly contain higher twist effects. Using the NMC parametrization, the ratio (res兾DIS) is above unity, but constant at about 1.2. The ratio decreases to about 1.1 when the appropriate logarthmic Q 2 dependence is included to obtain the parametrization at Q 2 苷 5 共GeV兾c兲2 . This effect is indicated by the dashed line in the figure. To obtain the points labeled resonance fit in Fig. 2, a fit to the average strength of all the hydrogen resonance spectra was obtained and utilized as a scaling curve. This approach assumes duality, and therefore that the average of the resonance data is equivalent to a proper scaling curve. For small bins in j, resonance nW2 data were averaged, regardless of Q 2 , W 2 . These average points were then fit as a function of j only, and the resultant scaling curve was obtained using a form similar to the x-dependent part of the NMC parametrization [23]. The scaling curve denoted resonance fit is, then, F2 苷 j 0.870 共1 2 j兲0.006 3 关0.005 2 0.058共1 2 j兲 2 0.017共1 2 j兲2 1 2.469共1 2 j兲3 2 0.240共1 2 j兲4 兴 .
(3)
To constrain the fit in the kinematic regions beyond the scope of the data, data obtained from [21] were also used below Q 2 苷 0.5 共GeV兾c兲2 and j 苷 0.2. Resonance data in the range 5 , Q 2 , 8 共GeV兾c兲2 were generated from [17] and used to constrain the fit at large j. Note that the ratio I(res兾DIS) in Fig. 2 comparing the resonance strength to the resonance fit scaling curve need not be unity here even though the curve was extracted from the resonance data. The average scaling curve strength at any given value of j was obtained from a kinematic range of data at variant values of W 2 and Q 2 oscillating around this curve. The individual spectra used to obtain the plotted ratios are, however, at the indicated fixed Q 2 values only. Even at Q 2 values as low as 艐0.5, the integrated strengths of the spectra at fixed Q 2 are within 10% of the resonance average curve, obtained from data at numerous W 2 and Q 2 values, integrated over the same region in j. Similarly, the ratio I(res兾DIS) is a constant 艐1.2, within 10%, when the NMC deep inelastic parametrization is utilized. Additionally, it is indicated that this latter ratio would tend toward unity if it were possible to compare the resonance region data with lower Q 2 values of the deep inelastic. In the QCD-based explanation of duality (e.g., [5]), these results indicate that higher twist effects are surprisingly reduced if the data are integrated over the resonance region. A more stringent test of this reduction of higher twist effects may be found in an analysis of higher order moments due to the greater contribution, at higher n, of larger x, j data. In a duality representation, this motivates the need for precision resonance region
VOLUME 85, NUMBER 6
PHYSICAL REVIEW LETTERS
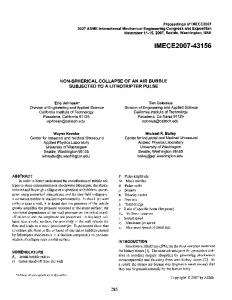
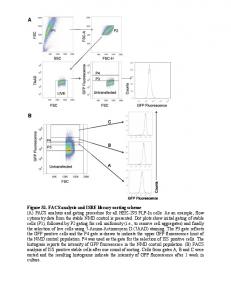
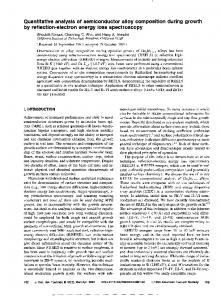
measurements at higher Q 2 —data which are planned but not yet available [24]. Figure 3 shows the same duality integral ratio as in Fig. 2, but here obtained more locally, in restricted j ranges around the three prominent resonance enhancement regions observed in inclusive nucleon resonance electroproduction, i.e., around the masses of the D P33 (1232) (1.3 # W 2 , 1.9 GeV2 ), the S11 (1535) (1.9 # W 2 , 2.5 GeV2 ), and the F15 (1680) (2.5 # W 2 , 3.1 GeV2 ) resonances, and in the higher W 2 region above these (3.1 # W 2 # 3.9 GeV2 ). The uncertainties shown were computed as in Fig. 2. The latter higher mass ratios, which compare near deep inelastic data to deep inelastic data are essentially one and similar to the results in Fig. 2. It has been pointed out [25] that the D resonance form factor decreases faster in Q 2 than the leading order perturbative QCD Q 24 behavior which the scaling curve should reflect. A similar observation may possibly be made from Fig. 3 where the ratio (res兾DIS) drops below unity in the region 1 , Q 2 , 3.5 共GeV兾c兲2 . The S11 region, on the other hand, appears systematically higher than the others. Generally, however, the lower mass resonances appear to average to the deep inelastic strength, manifesting duality 1.4
∆
1.2 1 0.8
I(Res/DIS)
0.6 0 1.4
1
2
3
4
5
6
7
8
2
3
4
5
6
7
8
2
3
4
5
6
7
8
2
3
5
6
7
8
S11
1.2 1 0.8 0.6 0 1.4
1
F15
1.2 1 0.8 0.6 0 1.4
1 2
W > 3.1
1.2 1 0.8 0.6 0
1
4 2
Q (GeV/c)
2
FIG. 3. The ratios of integrated data strength in limited ranges of j around the prominent resonance enhancement mass regions, to the strength from the resonance fit (stars) and NMC (squares) scaling curves integrated over the same j regions.
7 AUGUST 2000
behavior even in these limited ranges of j at low Q 2 where higher twist effects might be expected to be large. By utilizing new inclusive data in the resonance region at large x, it has been possible to revisit quark-hadron duality experimentally for the first time in nearly three decades. These new data, combined with the extensive global measurements of the F2 structure function from deep inelastic scattering, allow for precision tests of duality in electronnucleon scattering. The original duality observations are verified, and the QCD moment explanation indicates that higher twist contributions to the n 苷 2 moment of the F2 structure function are small or canceling, even in the low Q 2 regime of Q 2 艐 0.5 共GeV兾c兲2 . Duality is observed to hold for local resonance enhancements individually, as well as for the entire 1 # W 2 # 4 GeV2 resonance region. In all cases, duality appears to be a nontrivial dynamic property of the nucleon structure function. This work is supported in part by research grants from the National Science Foundation. C. E. K. and R. E. wish to thank A. Radyushkin for many useful discussions.
[1] P. D. B. Collins, An Introduction to Regge Theory and High Energy Physics (Cambridge University Press, Cambridge, 1977). [2] E. D. Bloom and F. J. Gilman, Phys. Rev. Lett. 25, 1140 (1970); Phys. Rev. D 4, 2901 (1971). [3] G. Altarelli, Phys. Rep. 81, 1 (1982). [4] A. J. Buras, Rev. Mod. Phys. 52, 199 (1980). [5] A. De Rujula, H. Georgi, and H. D. Politzer, Ann. Phys. 103, 315 (1977). [6] H. Georgi and H. D. Politzer, Phys. Rev. D 14, 1829 (1976). [7] R. Roberts, The Structure of the Proton (Cambridge University Press, Cambridge, 1990). [8] I. Niculescu, Ph.D. thesis, Hampton University, 1999. [9] X. Ji and P. Unrau, Phys. Rev. D 52, 72 (1995). [10] V. M. Belyaev and A. Radyushkin, Phys. Lett. B 359, 194 (1995). [11] G. West, hep-ph/9612403, 1996. [12] G. Ricco et al., Phys. Rev. C 57, 356 (1998). [13] C. Coriano, H-N. Li, and C. Savkli, J. High Energy Phys. 9807, 008 (1998). [14] C. E. Carlson and N. C. Mukhopadhyay, Phys. Rev. Lett. 74, 1288 (1995). [15] M. Anghinolfi et al., Nucl. Phys. A602, 405 (1996). [16] Jefferson Lab Experiment E94-110. [17] C. Keppel, in Proceedings of the Workshop on CEBAF at Higher Energies, 1994, edited by N. Isgur and P. Stoler, p. 237. [18] O. Nachtmann, Nucl. Phys. B63, 237 (1975). [19] A. D. Martin, R. G. Roberts, and W. J. Stirling, Phys. Rev. D 50, 6734 (1994). [20] L. W. Whitlow et al., Phys. Lett. B 282, 475 (1992). [21] S. Stein et al., Phys. Rev. D 12, 1884 (1975). [22] H. L. Lai et al., Phys. Rev. D 55, 1280 (1997). [23] M. Arneodo et al., Phys. Lett. B 364, 107 (1995); 364, 295 (1984). [24] Jefferson Lab Experiment E97-010. [25] P. Stoler, Phys. Rev. Lett. 66, 1003 (1991).
1189