1526
IEEE TRANSACTIONS ON APPLIED SUPERCONDUCTIVITY, VOL. I I , NO. I, MARCH 2001
Experimental Verification of the Temperature and Strain Dependence of the Critical Properties in Nb3Sn Wires A. Godeke, H.J.G. Krooshoop, H.G. Knoopers, B. ten Haken and H.H.J. ten Kate
Abstract- The critical current density in NbJSn conductors is described with an improved scaling formula for the temperature, magnetic field and strain dependence. In an earlier study it is concluded that the largest uncertainties in this description arise from the temperature dependence that is described with various slightly different empirical relations. For the optimization of the numerical codes, used to predict the stability of large magnet systems, a more accurate description is required. Therefore, two different bronze processed conductors for the ITER CS model coil are analyzed in detail. The critical current is measured at temperatures from 4.2 K up to the critical temperature, in magnetic fields from 1 T to 13 T and with an applied axial strain from -0.6 % to +0.4 %. The axial strain is applied by a U-shaped bending spring and a comparison is made between brass and Ti-6A1-4V, as substrate material. Index Terms-Critical current, field, Nb3Sn, scaling relation, strain, superconductor, temperature.
I.
INTRODUCTION
A
broad range of critical current measurements has been performed in order to analyze the validity range of the scaling descriptions for the critical current density of Nb3Sn conductors and to extend the available data for the ITER stability codes. The measurements are performed on the ITER Benchmark 3 (B3) Furukawa (FUR) and Vacuum-schmeltze (VAC) strands. The retrieved Z,(B,T,&)values are analyzed with a scaling relation that is applied earlier to the B3 data [1],[2] and the parameters to be used for magnet design are derived from the analysis.
11. MEASUREMENT EQUIPMENT A . The Z,(B,T) setup The I,(B,T) values are measured on the standard Ti-6A1-4V ITER barrel sample holder. Voltage contacts are placed at 0.5 m apart and the barrel is mounted in a variable temperature insert as described in [2]. The temperature measurement is accurately re-calibrated in the range from 4.2 to 20 K for the new measurements. The setup is slightly modified in comparison to the B3 insert to minimize the temperature gradients across the setup for the extended temperature range. The unreacted samples are wound on the barrels and are all reacted at once (together with the strain samples) under vacuum according to the manufacturers schedule. The reacted strands are Manuscript received September 18,2000. All authors are with the University of Twente, Faculty of Applied Physics, Low Temperature Division, P.O. Box 217, 7500 AE Enschede, The Netherlands. E-mail:
[email protected].
fixed to the barrels with STYCAST 2850FT, combined with harder 24LV. The two-component epoxy is cured at approximately 325 K.
B. The Zc(B,T,E) setup The setup to characterize the Z,(B,T,&) dependency of superconducting wires is also described in [2]. The insert is exactly the same as was used for the B3 measurements, apart from the substrate material. The U-shaped substrate used for the new measurements is made from Ti-6A1-4V, while in the B3 series brass was used. Brass has the advantage of easy soldering, but it has the disadvantage of the limited elasticity i.e. it starts to yield at approximately 0.4 % strain at 20 K. Ti-6A1-4V has a higher elastic limit of 1.3 % at 20 K. Another important advantage of the Ti-6A1-4V substrate in comparison to brass (and e.g. CuBe) is the small amount of prestrain that is applied to the sample during cooling down, because the thermal contraction of Ti-6A1-4V is comparable to the contraction of Nb3Sn. When applying strain to the brass substrate, the center (strained) part of the wire will show a rise in critical current, whereas the wire outside the strained region keeps the prestrained lower critical current value. This gives rise to a redistribution of the critical current and this can influence the shape of the &(E) curve around its maximum. This effect is not present in the case of the Ti-6A1-4V substrate. Recent results show reversible I,(&) behavior in very finefilamentary Nb3Sn up to 0.4 % over the peak on a Walters spring [3] made from a CuBe alloy, that has an elastic limit of approximately 0.8 % at 20 K [4]. This reversibility is in contrast to what is known from literature [1,13]. It is possible that the larger elastic range of the substrate, combined with the fine filaments enables this reversibility. The original Walters spring was made from 318 Ti-alloy, but had the disadvantage that it used an unfixated sample, because it is so difficult to solder a sample to Titanium. This problem can be avoided by using CuBe as the substrate material. The disadvantages are the smaller elastic range, the large pre-strain and the toxicity of Beryllium. Since Titanium is still the best choice with an elastic range of 1.3 % combined with a thermal contraction that is comparable to that of Nb3Sn, time is invested to develop a soldering procedure for a Ti-6A1-4V substrate. A layer of 0.2 mm copper is soldered to the substrate under vacuum with 72 % Ad28 % Cu solder (T,,lt = 1050 K) at 1140 K, which is well below the phase transition temperature of Ti-6A1-4V (from (a+p)=> p/(a+p) at 1260K). The thin copper layer serves as a buffer for the low temperature soldering process. The samples for the strain dependence measurements are reacted on stainless steel holders and after reaction transferred to the substrate and fixed by soldering with SnAg at approximately 450 K.
1051-8223/01$l0.00 0 2001 IEEE
1527
111. MEASUREMENTS On the ITER barrel insert, the critical currents of the samples are measured as a function of applied fields (B,) from 1 to 13 T and temperatures from 4.2 K up to T,. On the Ti-6A1-4V U-shaped sample holder a selected field range of B, = 2, 5 , 10 and 13 T is investigated at temperatures from 4.2 K up to T,. The axial applied strain (E,) is stepwise varied from -0.6 % up to +0.35 %. A relatively high voltage criterion of 5-10‘4V/m is chosen for the overall analysis. This is due to the short distance between the voltage taps of only several mm on the variable strain device. This is the main disadvantage of the variable strain insert. A resistance, parallel to the superconductor is present during measurements of the V-I transition (e.g. Cu, Nb, Ti, brass, SnAg, etc.). The current through this resistance is measured at the selected voltage criterion at a temperature just above T,. This current is subtracted from the measured critical current in the analysis.
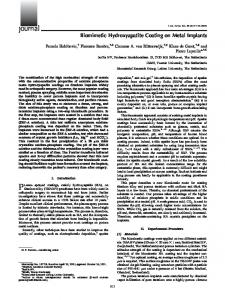
Iv. DERIVED DATA A. Self-field corrections In order to accurately analyze the measured I@) data, the self-field correction should be taken into account. It has been shown [SI, that the peak field at the surface of the wire should be calculated in order to compensate for the self-field effect. This is true if the twist pitch of the wire is sufficiently low i.e. all the filaments pass the high field region. The formula in [5] gives a self-field constant of lo4T/A for a sample of 0.8 mm diameter. Analysis of the field-profile of the barrel indicates a maximum self-field in between the voltage taps on the surface of the wire of 2.85.104T/A. This value is used to calculate the peak field on the conductors, mounted on the barrel. The small low-field non-linearity in the “Kramer” plots (Fig. 1) suggests that this value might be too low. In the case of the U-shaped strain device, the analysis is not so straightforward. The twist-pitch of the VAC conductors is 9 mm and for the FUR conductors 18.4 mm. The distance between the voltage-taps is 6 mm for the VAC conductor and 7.5 mm for the FCTR conductor, while the length of the current path that is perpendicular to the field is only approximately 35 mm. The exact influence of the relatively short sample length and distance between the voltage taps as compared to the twist pitch cannot be estimated due to redistribution of the filament currents. A correction term, proportional to the field is however necessary, mainly in the case of the low field data for the VAC conductor. The self-field effect was taken into account as a constant factor during the solving process of the scaling relations. The values found in order to get the most accurate description are 1.7.10-’T/A for the FUR conductor and 2.56.10-4T/A for the VAC conductor. The maximum value that can be calculated for the self-field effect at the wire surface is 5.10-4T/A, for a wire of 35 mm length.
B. Extrapolations to the upper critical fields The B,z values for fields above 13 T could not be directly measured and are therefore found by extrapolation. Since the pinning relation constants p = 0.5 and q = 2 seem to be constant for all the measured samples [l], a Kramer extrapolation can be made. This extrapolation is commonly accepted. Although it is
x
6.00 8.00
x 9.00
10.00 10.99 0 12.00 A 12.99 0 13.98 A 14.96 o
0
5
10
15
20
25
30
35 30
25 20
15 10
5
0 0 5 10 15 20 25 30 Fig. 1 . Kramer extrapolationsto the upper critical field for the FUR (upper) and the VAC conductors.
often mentioned to be valid up to 0.9.B,z [6,7], it is also experimentally shown to work rather well in the vicinity of Bc2 [8,9] for Nb3Sn conductors at 4.2 K. The Kramer plots for the samples are shown in Fig. 1. For the barrel measurements it is not clear whether deviations at low fields should be attributed to measurement and self-field errors or that the pinning relation is not valid in that region. Errors can arise through a slightly deviating temperature at which some points are taken. The temperatures that are given in the legends are averaged across the “constant” temperature lines. However, I,(r) measurements are performed at constant field and I@) curves at “constant” temperature are derived from them. Deviations can occur in small differences in temperature regulation set-values, due to the field dependent thermal resistances and heater resistances.
v.
SCALING RELATIONS
Combining the pinning relations [6,7], with the temperature dependency relations [10,11,12], the Summers refinement [8] and the strain dependency relations [13,14], an overall, general equation for the critical current density is obtained in the form
WI:
with:
IS28
f(BIB,, ( T ,E ) ) = (BIB,, (T,E)? T,(E)= T,,
*
(1 - (B/B,, ( T ,E))?
.S ( E ) ~ ' ~ ,
9
(2) (3)
K ( T , E )=1-0.31-(7'/T,(&))2 .(1-1.77-ln(T/TC(&))),
(4)
P(T,E) = ( 1 - ( T / T ( E ) ) 2 ) . K ( T , E ) ,
(5)
B,,(T,E) = BC2,(O).S(E).P(T,&)'
(4)
The choice has been made to use the axial approximation (hence E& of the deviatoric strain dependency description
4
for S(E) [1,2] instead of the power law [I31 because of the more physical background of the deviatoric strain relation and the higher accuracy of the description [ 11. The description of the used variables is given elsewhere [ 1,2]. All the parameters and constants in (1) were optimized in the B3 analysis [l]. The most accurate description was achieved using the constants in Table I. This one array of constants also delivers the most accurate description for the entire range of B4 measurements. Using y= 2 and v = 2.5 [12] in (1) and moving BcZm(O)into a new constant COand S(E) in a constant C(E)= C0.S(&)will lead to the well-known Summers [SI relation, which was applied on the results of I,(B,T) measurements on comparable samples by CEA Caderache [ 151 VI. DETERMINATION OF THE SCALING PARAMETERS All the I, data are corrected for resistive current and self-field and a least square fit is made over the whole range between the calculated- and measured I, data. The resulting parameters for the entire range (1T 5 B, I 13T, 4.2K I T I T, and -0.7%< &,tnl 5 +0.5%,where = E,+@ are listed in Table II. The larger amount of data in comparison with the B3 data gives rise to a small adjustment of the scaling parameters [l]. A different current scaling constant C is allowed for the B3 strain measurement of the VAC conductor. This is justified by the fact that different VAC samples on the barrel in the B3 measurements already showed a spread in critical current. The only way to retrieve an accurate overall description for the FUR conductors is through introduction of a slightly deviating current scaling constant C for the Ti-U sample. This sample is assumed TABLE I THE OPTIMAL DESCRIBING CONSTANTS FOR 1
Parameter Value
i
1
FUR Ti-U
n 1
1
1
FUR Barrel
'
1
P 0.5
4 2
FUR B3-U
VAC Ti-U
V
y
2
1
'
VAC Barrel
w 3
1
VAC B3-U
6
\
8
10
12
14
1200]. ' I c (A) 1000
800 600 400
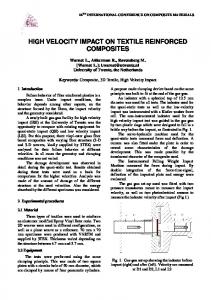
200 0 4 6 8 10 12 14 16 18 Fig. 2. The high- (upper) and low field temperature dependence of the critical current for the FUR conductor. The points are measured and the lines are calculated by (l), with constants and parameters from Tables I and 11.
to be damaged either during soldering to the substrate or during the storage period, since it was reacted three years ago. The difference in prestrain due to soldering on a brass or a Ti-6Al-4V substrate can be estimated by taking the differences in thermal contraction of brass and Ti-6Al-4V from the soldering temperature (450 K) down to the measuring temperature (4.2 K). This predicts a -0.416 % larger prestrain on the brass substrate in comparison to Ti-6A1-4V. The difference in the description is -0.490 % for the FUR as well as for the VAC data. The deviatoric strain dependency pre-factor (C,) is close to values found before [l]. This supports the assumption that the slope of the &,(E) dependency could be a material constant for Nb3Sn [1,2]. With the resulting scaling parameters the whole critical surface can be described with high accuracy, as can be seen in Fig. 2 and Fig. 3. The FUR sample is taken as an example. The description for the VAC samples has the same accuracy. The B3 brass measurements are included in Fig. 3 to make a comparison between the different substrate materials. All the points in these plots are measured and the lines are all calculated, with a single set of constants as given in Table I and parameters as in Table II.
VII. DISCUSSION ABOUT THE VALIDITY AND ACCURACY The overall accuracy of the description can easily be seen from Fig. 4. Here all the measured and calculated critical current
I529
e4K, 2 T
D ~ K2T ,
+15K, 2T
olOK, 5T r12K, 5T x14K, 5T
1000
o4K, 5T o8K, 5T
1000
x6K, 5T
900
800 700
4
em
100
’
500 400 300 200
10
100
0 -0.8
-0.6 4K, 10T o 4K, 13T l
250
-0.4 -0.2 0.0 6% 10T A 8K, 10T 6% 13T A 8K, 13T
0.2 0.4 9K, 1OT o 9K, 13T
U calc.
x + B3 10T, 4K
B3 Gdc.
200
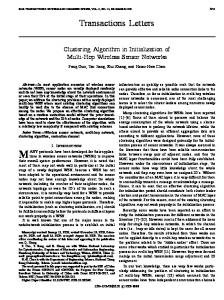
1 10 100 1000 Fig. 4. Overall accuracy of a description using (1). All the measured data for the FUR and VAC conductor are included in the points for eotal 5 +0.1%,the assumed validity range of the deviatoric strain description. The lines represent a window of 15 A.
*
150
100
50
0 -0 8
1
-0 6
-04
-02 Elold
00
02
04
(%I
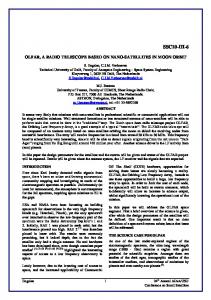
Fig. 3. The low- (upper) and high field strain dependence of the critical current for the FUR conductor. The points are measured and the lines are calculated by (l), with constants and parameters from Tables I and II.
values are compared for hotd 5 +0.1 %. The calculated values depend linearly on the measured values with a slope of 1. Most points fall within a & 15 A window, even for currents up to 1OOOA. The few deviating points can mostly be accredited to measuring errors, especially in low field, high current regions. The accuracy for low &values is higher than the k 15 A window. The highly stressed regions over the maximum in the strain dependency curve cannot be accurately described with the elastic based deviatoric strain description. In the hotd > +0.1 % region, the deformations of the Nb3Sn are almost certainly plastic. A recent attempt to include plasticity in Z,(defomation) descriptions is given in [161. VIII. CONCLUSIONS 0 The proposed general scaling relation (I), together with the constants in Table I and the parameters in Table I1 describes all the measured data very well and was proven to be valid in the range 4 . 2 K I T I T c , l T I B , I 13T and -0.7% I&od5 +0.1%. The validity range of the Kramer relation in the low field range is amazingly high. Apart from a few deviating points at
very high currents (which might be due to a incorrect value of the self-field constant) and noise due to small “constant” temperature variations, it appears that the Kramer relation still holds down to 1 T. This is in contrast to results published by others [6,7], where a validity range of 0.3 c B/BC2< 0.9 is mentioned. 0 More research on the scaling relations, in particular the Bc2(T) relations is necessary to retrieve a better or hopefully even fundamental temperature dependency description. This is mainly to be done in the high field, low temperature region.
REFERENCES [I] A. Godeke, B. ten Haken and H.H.J. ten Kate, IEEE Trans. On Applied Supercond., Vol. 9, No. 2, pp. 161-164, 1999. [2] B. ten Haken, A. Godeke and H.H.J. ten Kate, J. of Appl. Phys., Vol. 85, NO. 6, pp. 3247-3253, 1999. [3] C.R. Walters, LM. Davidson and G.E. Tuck, Cryogenics, Vol. 26, pp. 406-412, 1986. [4] N. Cheggour and D.P. Hampshire, IEEE Trans. on Appl. Superc., Vol. 9, Nr. 2 Part 1, (pp. 2517-2520). ISSN 1051-8223. 1999. [5] M. Garber, A.K. Ghosh and W.B. Sampson. IEEE Trans. On Magn., Vol. 25, NO. 2, pp. 1940-1944, 1989. [6] E.J. Kramer, J. Appl. Phys., Vol. 44, p. 1360, 1973. [7] D. Dew-Hughes, Phil. Mag., Vol. 30, p. 293, 1974. [8] L.T. Summers, M.W. Guinan, J.R. Miller and P.A. Hahn, IEEE Trans. Magn., Vol27-2, p. 2041, 1991. [9] J.L.H. Lindehovius, E.M. Hornsveld, A. den Ouden, W.A.J. Wessel and H.H.J. ten Kate. IEEE Trans. On Applied Superc., Vol. 10, No. 1, pp..975-978, 2000. [lo] W.A. Fietz and W.W. Webb, Phys. Rev., Vol. 178-2, p. 657, 1969. [ I l l W.A. Fietzand W.W. Webb, Phys. Rev., Voll61-2, p. 423, 1967. [I21 D.P. Hampshire, H. Jones and E.W.J. Mitchell. IEEE Trans. Mag., Vol. MAG-21, pp. 289, 1985. [13] J.W. Ekin, Cryogenics, Vol. 20, p. 611, 1980. [14] D.O. Welch, Adv. in Cryo. Eng., Vol. 26, p. 48, 1980. [I51 A. Martinez and J.L. Duchateau, Cryog., Vol. 37, pp. 865-875, 1997. [16] J.M. van Oort, PhD thesis, Univ. of Twente, ISBN90-36514029, 2000.