Late-Breaking Work
CHI 2017, May 6–11, 2017, Denver, CO, USA
Experimentation for Developing Evidence-Based UI Standards of Mobile Survey Questionnaires Lin Wang
Abstract
Christopher Antoun
With the growing use of smartphones, many surveys can now be administered using those phones. Such questionnaires are called mobile survey questionnaires. The designer of a mobile survey questionnaire is challenged with presenting text and controls on a small display, while allowing respondents to correctly understand and answer questions with ease. To address this challenge, we are developing an evidencebased framework of user interface design for mobile survey questionnaires. The framework includes two parts: standards for the basic elements of surveyrelevant mobile device operation and guidelines for the building blocks of mobile survey questionnaires. In this presentation, we will describe five behavioral experiments designed to collect evidence for developing the standards. These experiments cover visual perception and motor actions relevant to survey completion. Some preliminary results from ongoing data collection are presented.
Russell Sanders Elizabeth Nichols Erica L. Olmsted Hawala Brian Falcone Ivonne Figueroa Jonathan Katz U.S. Census Bureau Washington, DC 20233, USA
[email protected] [email protected] [email protected] [email protected] [email protected] [email protected] [email protected] [email protected] Disclaimer: This paper is released to inform interested parties of research and to encourage discussion. Any views expressed on the methodological issues are those of the authors and not necessarily those of the U.S. Census Bureau. This report is not subject to copyright in the United States under 17 U.S.C. § 105. No permission is required for the use, reproduction or distribution of this report within the United States. Reproduction and dissemination outside of the United States is subject to a royalty-free, nonexclusive license. Attribution to the authority and the U.S. Department of Commerce is required. CHI'17 Extended Abstracts, May 06-11, 2017, Denver, CO, USA. ACM 978-1-4503-4656-6/17/05. http://dx.doi.org/10.1145/3027063.3053181
Author Keywords Mobile survey; Standards; Framework; Usability
2998
Late-Breaking Work
Standard to be established Minimum width of a square touch target Minimum space surrounding a square touch target with a given width Minimum diameter of a round touch target Minimum space surrounding a round touch target with a given diameter Minimum height of a text field Minimum vertical space above and below a text field Minimum x height of text display The perceived lightness or brightness difference between foreground and background Color combination that are discernable by persons with color vision impairment Table 1: Basic mobile user interface parameters for standards.
CHI 2017, May 6–11, 2017, Denver, CO, USA
ACM Classification Keywords H.5.2. User Interfaces: Human Factors; Evaluation/methodology; Standardization
Introduction A survey questionnaire is a tool for obtaining selfreported information from respondents (who complete the questionnaire) through standardized questions. To accommodate the growing number of respondents that use smartphones [1], many surveys can now be administered using those phones. Many smartphones have a display size of 5.5’ or less. A designer is challenged with presenting text (e.g., questions) and controls (e.g., a navigation button) on a small display, while allowing respondents to correctly answer questions. Errors made in responses are called measurement errors in survey methodology [2]. Measurement errors compromise survey results and can be particularly harmful in an important survey such as the U.S. Decennial Census of Population and Housing (aka. U.S. Census) [3], because results from such surveys have significant impact on society. To minimize measurement errors in mobile surveys, it is critical to design optimized user interfaces for mobile survey questionnaires. Although research has been done on user interface for Web-based survey questionnaires designed for large displays such as 13’ laptop computers [4], information on the optimal user interface of mobile survey questionnaires is limited. In particular, there are no standard user interface design specifications based on empirical evidence for mobile survey questionnaires. Evidence refers to human performance measurement that is generated through controlled behavioral experiments. To address this important issue, we
initiated a R&D project to develop an evidence-based framework of user interface design for mobile survey questionnaires (Framework). Based on our experiences in mobile survey research [5] and a literature review [6], we identified a list of user interface components that are pertinent to mobile survey questionnaires. Those components were classified into two groups: the basic operations of a mobile device, e.g., touching a target icon; and survey questionnaire design layout, e.g., the orientation of response options. We consider the basic operations group includes basic mobile user interface elements, while the design layout group includes larger building blocks made up of the basic elements. Based on this classification, we constructed the Framework with two parts: standards for the basic elements of mobile survey operation and guidelines for the building blocks of mobile survey questionnaires. The standards will be mandatory for software developers to adhere to, whereas the guidelines recommendatory. In this presentation, we will describe the standards and behavioral experiments that generate supporting evidence for the standards. The work on the guidelines will be reported in the future. This research was designed using human factors methodology [7]. We first developed a mobile respondent information processing model that describes visual information flow from a smartphone to respondent’s visual system and a finger motor action on the smartphone in response to the visual information perceived from the phone. We then conducted a pilot anthropometric study to determine average index fingertip size for the U.S. population [8]. In an attempt to make the standards and guidelines inclusive to the majority of U.S. population, we sketched a mobile respondent persona with a set of
2999
Late-Breaking Work
CHI 2017, May 6–11, 2017, Denver, CO, USA
minimum physical and mental capacities. The capacities included three dimensions: Vision, cognition, and action. We used senior persons as our study population because a senior individual usually has lower physical and mental abilities and is consequently better resemble the persona. If an individual with such physical and mental capacities can complete a mobile survey designed in accordance with the standards and guidelines, anyone who has the same or better capacity shall be able to do the same or better. Therefore, evidence collected from this study population can be generalized to the younger population.
Standards Overview
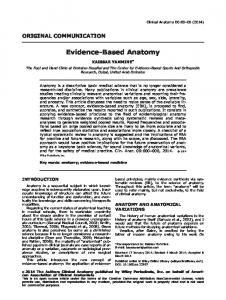
Figure 1: A sketch of the array design for Experiment 1. The solid square in the array represents a touch target. The circle is the starting place where the index finger was first placed.
Based on empirical observations, we conceptualized the process that a typical respondent would go through to complete a mobile survey as a series of steps that include reading the text on a smartphone and entering data into the smartphone with a finger (often an index finger). Following this rationale, we developed nine standards (Table 1) in three categories: (1) touch target size and spacing, (2) text entry and display, and (3) luminance and color. The standards dictate the minimum requirement for each basic mobile user interface element. There is established evidence for the luminance and color standards, but less evidence for other seven standards. We decided to conduct experimental research to establish evidence for the seven standards. We designed five experiments to determine the parameters for the seven standards: the optimal combination of square touch target and spacing, the optimal combination of circle touch target and spacing, text field height for text entry, text field height for text editing, and character height for text display. In the following, we will describe all five experimental designs and report preliminary results for
Experiment 1. For Experiment 2 to 5, the section of Data analysis and preliminary results is not included because data analyses are still in progress.
Experiment 1 Purpose and rationale. The purpose of this experiment was to establish optimal combinations of square touch target width and spacing between targets. Tapping a target (e.g., a check box) on a smartphone is a common action in completing a mobile survey. Due to the small size of the display, it is important to minimize the target size without sacrificing response quality. Though some research on this topic has been done and has recommended a minimum square target of 10-mm width [9], the evidence is not conclusive and targets smaller than 10 mm are widely used in practice (e.g., alphanumerical keys on a keypad). In this experiment, we would first determine the smallest square target size at which the participant could successfully touch the target, and then explore the influence of spacing between targets on participants’ performance. Performance measures. Participants’ performance was assessed with three measures: Success (in touching the target), Task Completion Time (how fast the participant can complete the touch action), and Perceived Task Difficulty (a 5-point scale ranging from very easy to very difficult). These three measures reflect the three aspects of usability for a software product: Effectiveness, efficiency, and satisfaction [10]. Experimental factors. Two experimental factors were manipulated: Target width (Width) and space surrounding the target (Space). There were 10 levels of width, ranging from 2 mm to 11 mm, with a 1-mm increment. For each target width, there were certain
3000
Late-Breaking Work
Square Target Hit Rate (2-mm side) 100
Percent
80 60 40
20 0
Spacing (mm)
Square Target Hit Rate (4-mm side) 100
CHI 2017, May 6–11, 2017, Denver, CO, USA
levels of spacing, starting from 0 mm (no space) and, with a 1-mm increment, ending with a value M that satisfied the equation: Width + (M x 2) = 17 or 18. This equation was imposed to ensure that the experimental stimuli would fit on the display for all condition combinations. For each target size, there was also a condition where the target was surrounded by no other targets (denoted as “singleton” in Figure 2). There were total of 65 combinations of target width and space.
Experiment 2
Percent
80 60 40
20 0
Spacing (mm)
Square Target Hit Rate (6-mm side) 100
Percent
80 60 40
20 0
Spacing (mm)
Square Target Hit Rate (8-mm side) 100 80
Percent
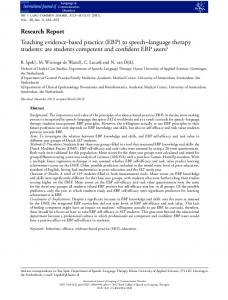
Data analysis and preliminary results. For each combination of target width and space, we calculated hit rate (percent participants who successfully touched the target). Our preliminary results suggest that the hit rate increases with the increase in target size, but does not have a consistent relationship with spacing between surrounding targets. The hit rate reached 80% for a target width of 6 mm and 90% for 8 mm. Figure 2 shows hit rates for 4 target widths.
60 40
20 0
Spacing (mm)
Figure 2: Preliminary data of hit rate as a function of target size and spacing (29 participants), from Experiment 1.
Experimental paradigm. The participant performed a touching task in this experiment. The task started with the participant holding a smartphone with one hand and placing the index finger of the other hand at a starting point on the smartphone screen (the circle in Figure 1). After the index finger was placed at the starting point, a 3x3 array of squares of the same size appeared on the screen, with one square target being solid (Figure 1). The participant was instructed to move his or her index finger to touch the solid target as soon as it appeared. Once the finger landed on the screen, the array disappeared and the task was completed. The participant repeated the task through all the targetspacing combinations. Figure 1 shows a sketch of the screen design. Experimental design and data collection. This experiment was a within-subject design with two factors, Width and Space. Each participant performed the touching task in all 65 condition combinations of target width and space. Thirty individuals between 60 and 75 years old participated in the experiment. Twenty-nine participants’ data were analyzed.
Experiment 2 was identical to Experiment 1 except that the touch target shape was circular instead of square as in Experiment 1. Since circular target objects are another popular target type (e.g., radio buttons), the purpose of Experiment 2 was to assess the usability of a circular target, as compared to Experiment 1. Refer to Experiment 1 for detailed experimental design.
Experiment 3 Purpose and rationale. The purpose of this experiment was to establish the minimum height of a text field such that the respondent can activate with ease. Entering natural language text is a common action in answering survey questions. (e.g., answering the question what is your name). A minimum but sufficient text field size would save the limited display space while allowing the respondent to answer questions effectively and efficiently. Performance measures. Participants’ performance was assessed with three measures: Cursor placement (number of attempts made to place the cursor), Task Completion Time (how fast the participant can successfully place the cursor), and Perceived Task Difficulty (same as Experiment 1).
3001
Late-Breaking Work
Enter
Figure 3: A sketch of Experiment 3 user interface design.
CHI 2017, May 6–11, 2017, Denver, CO, USA
Experimental factors. Two experimental factors were manipulated: Text field height (Height) and space above and below the text field (Space). There were 5 levels of Height, ranging from 3 mm to 7 mm, with 1 mm increment. To simulate a more real-world like setting, the text field is flanked, above and below, by other icons, with a space between the flanking icons and the text field. For each text field height, there were certain levels of space, starting from 1 mm and, with 1 mm increment, ending with a value, M, that satisfies the following equation: Height + (M x 2) = 13 or 14. This equation was imposed to ensure that the experimental stimuli would fit on the display for all condition combinations. For each text field height, there was also a “control” condition where the text field was surrounded by no other targets. Experimental paradigm. The participant performed a data entry task in this experiment. The task started with the participant holding a smartphone with one hand and placing the index figure of the other hand at a starting point on the smartphone screen. After the index finger is placed at the starting point, a blank text field with a given height-space combination appeared on the display. Upon seeing the text field, the participant moved his/her index finger away from the starting point to touch the text field. After the cursor was successfully placed in the text field, the participant typed a word into the text field. As soon as the last character was typed in, the task was completed. Figure 3 shows a sketch of the experimental screen design. Experimental design and data collection. This experiment was a within-subject design with two factors, height and space. Each participant performed the data entry task under all 26 condition combinations
of text field height and space. Thirty individuals between 60 and 75 years old participated in the experiment.
Experiment 4 Purpose and rationale. The purpose of this experiment was to establish the minimum height of a text field such that respondents can edit data with ease. The experiment shares the same rationale as Experiment 3. Performance measures. Participants’ performance was assessed with three measures: Cursor placement (number of attempts made to place a cursor at a particular word in the text field), Task Completion Time (Same as Experiment 3), and Perceived Task Difficulty (Same as Experiment 3). Experimental factors. Same as Experiment 3. Experimental paradigm. The participant performed a data editing task in this experiment. The task started with the participant holding a smartphone with one hand and placing the index figure of the other hand at a starting point on the smartphone screen. After the index finger was placed at the starting point, a text field with a given height-space combination appeared on the screen. A sentence was displayed in the text field. Upon seeing the sentence, the participant moved his/her index finger away from the starting point to touch the particular word that was to be replaced (the target word). After the cursor was successfully placed in the text field, the participant replaced the target word with another word. Once the last character is typed in, the task was over. The experimental screen design was the same as Experiment 3 (Figure 3),
3002
Late-Breaking Work
In London, it was a hulking electric power station (now the Tate Modern). In North Adams, Mass., it was an electronics plant (whose buildings now house the Massachusetts Museum of Contemporary Art). In Beacon, N.Y., it was a Nabisco cracker-box factory (now home to Dia:Beacon, the mecca of Minimalist and Conceptual art). And next in the march of postindustrial artification, the Crystal Bridges Museum of American Art in Bentonville, Ark. — home to Walmart — has announced plans to transform a defunct Kraft cheese plant into a raw space for contemporary-art exhibitions, artists’ projects, music, theater and film
Next
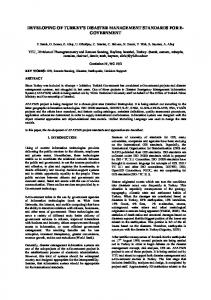
Figure 4: A sketch of Experiment 5 user interface design.
CHI 2017, May 6–11, 2017, Denver, CO, USA
except that the text field was populated with a sentence. Experimental design and data collection. Same as Experiment 3.
Experiment 5 Purpose and rationale. Reading is an essential part in completing a survey. Given the constraint of a small screen display, a specification on the minimum letter size is needed for presenting maximum text information while allowing the respondent to read it easily. The purpose of this experiment was to establish the minimum x-height of text displayed on a smartphone so that the reader can read the text with ease. x-height is a measure of letter size and is the actual height of the low-case x. Performance measures. Participants’ performance was to be assessed with three measures: Reading Errors (number of errors made during reading), Reading Time (Duration between pronouncing the first word and pronouncing the last word in the reading text), and Perceived Task Difficulty (Same as Experiment 1). Experimental factors. There was one experimental factor: x-height, with five levels of x-height, ranging from 1 mm to 3 mm, with 0.5 mm increment. Experimental paradigm. The participant was instructed to read aloud 10 passages, at the pace of reading a newspaper, in different letter size as designed in the Experimental factors section, with each letter size having two passages. Figure 4 shows a sketch of the experimental screen design.
Experimental design and data collection. This experiment was a within-subject design with one factor, x-height with 5 levels of letter size. Each participant performed the reading task for 10 trials, with 2 trials under the same x-height condition. The ten passages were different in content but had similar word count (about 150 words per passage) and difficulty level (6th grade). The passages were adopted from a standard clinical reading test, IReST [11]. Thirty individuals between 60 and 75 years old participated in the experiment. Their reading voice was recorded for offline analysis.
Summary In this paper, we described a systematic approach to developing evidence-based UI standards for mobile survey instruments through empirical behavioral experiments. The methodological significance of this research is found in the generation of empirical evidence as the foundation for UI standards. The experimental designs are rooted in the discipline of psychophysics that emphasizes the causal relationship of stimulus and response. We used the human factors techniques of human operator modeling and human performance measurement to characterize the mobile respondent population and to define performance metrics. The development of the standards has an explicit objective: Reduce measurement error in survey data collection. This objective has both theoretical and practical implications: A contribution to the survey methodology and a contribution to the data quality improvement in the field operation. Outcomes from this research can be generalized to other mobile software UI design as well.
3003
Late-Breaking Work
CHI 2017, May 6–11, 2017, Denver, CO, USA
6.
1.
A. Smith. U.S. Smartphone Use in 2015. Pew Research Center, Washington DC, April 1, 2015, pp. 1-1. Retrieved Jan 3, 2017 from http://www.pewinternet.org/2015/04/01/ussmartphone-use-in-2015/.
Christopher Antoun, Jonathan Katz, Josef Argueta, Lin Wang. 2016. Design Heuristics for Effective Mobile Web Questionnaires. Social Science Computer Review. (Accepted, in revision7). http://dx.doi.org/10.1007/s00779-014-0773-4
7.
2.
R. M. Groves, F.J. Fowler, M.P. Couper, J. M. Lepkowscki, E. Singer, and R. Tourangeau. Survey Methodology. Wiley, New Jersey, 2009.
C. D. Wickens, J.G. Hollands, S. Banbury, R. Parasuraman. Engineering Psychology and Human Performance. Taylor & Francis, New York, 2013.
8.
Personal correspondence with Dr. J. Choi, Aug 25, 2015.
9.
Roxanne Leitão and Paula Alexandra Silva. 2012. Design patterns for target sizes and spacings for smartphone user interfaces for older adults: a set of patterns based on an evaluation with users. In Proceedings of the 19th Conference on Pattern Languages of Programs, Article No 5. Retrieved Jan 3, 2017 from http://dl.acm.org/citation.cfm?id=2831275
References
3.
Decennial Census of Population and Housing. U.S. Census Bureau, Washington DC. Retrieved Jan 3, 2017 from http://www.census.gov/programssurveys/decennial-census.html
4.
M. P. Couper. 2008. Designing Effective Web Surveys. Cambridge University Press, Cambridge.
5.
Erica L. Olmsted-Hawala, Elizabeth M. Nichols, Temika Holland, Marylisa Gareau. 2016. Results of Usability Testing of the 2014 American Community Survey on Smartphones and Tablets Phase I: Before Optimization for Mobile Devices. Retrieved Jan 3, 2017 from http://www.census.gov/srd/papers/pdf/rsm201603.pdf
10. International Organization for Standardization. 2015. Ergonom-ics of human-system interaction — Part 11: Usability: Def-initions and concepts. ISO 9241-11, ISO/IEC, Geneva. 11. IReST – International Reading Speed Texts. Precision Vision, Woodstock, IL, USA.
3004