Experiments with Wireless Sensor Networks for Real-Time Athlete Monitoring Ashay Dhamdhere† , Hao Chen† , Alex Kurusingal† , Vijay Sivaraman† and Alison Burdett⋆ †
School of EE&T, University of New South Wales, Sydney, NSW 2052, Australia Emails: {
[email protected],
[email protected],
[email protected],
[email protected]} ⋆ Toumaz Technology Limited, Abingdon, Oxfordshire, UK. Email: {
[email protected]} Abstract—Real-time physiological monitoring of athletes during sporting events has tremendous potential for maximizing player performance while preventing burn-out and injury, and also enabling exciting new applications such as referee-assist services and enhanced television broadcast. Emerging advanced monitoring devices have the right combination of light weight and unobtrusive size to allow truly non-intrusive monitoring during competition. However their small battery capacities, limited wireless ranges and susceptibility to body effects make real-time data extraction a challenge, particularly in sports with a large playing area. In this work we present the novel application of body area sensor networks to monitoring soccer players in a soccer field. We begin by outlining the challenges in experimental data collection and elaborate on the design choices we have made. Secondly, we show that the inherent characteristics of the operating environment lead to unacceptably high delays for direct transmissions from the players to the base stations. This leads to our third contribution, namely a multi-hop routing protocol that balances between the competing objectives of resource consumption and delay.
I. I NTRODUCTION Sports today is becoming increasingly scientific, and elite athletes rely as much on technology as on training. With the consequent raising raising of the bar and narrower winning margins, maximizing performance while avoiding injury requires continuous physiological monitoring of athletes during both training and competition. Real-time information on athlete heart-rate, temperature, speed, distance, position and impact during a live game can help identify potentially dangerous situations such as when a player’s heart rate or temperature become excessive, or when high fatigue levels affect body physiological and bio-mechanical processes to cause injury. Strategically, real-time information in field sports can assist the coach in optimising team performance by making more informed player substitution decisions. Finally, there is a growing interest in using real-time position and impact information for referee-assist services, as also for enhancing live television broadcast. The wide spectrum of applications is a strong motivator for this work. Athlete monitoring systems must balance between size, weight and communication range. While commercially availTM able devices such as the SPI Pro from GPSports [1], VX Log TM from VX Sport [2] and CSIRO’s horse tracking device have sufficient radio range to directly reach a base station, they have sizes resembling a mobile phone, making them unsuitable for monitoring athletes in intensively physical field sports such as soccer. Conversely, emerging body-area devices such as the
TM
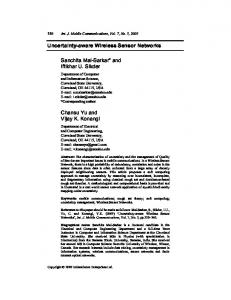
Toumaz Sensium [3] digital plasters have the form factor of a band-aid, making them ideally suited for such applications. However the small form factor necessitates small batteries, which correspondingly reduces the communication range and makes real time data extraction challenging. Further, the body-worn nature of the device means that the athlete’s body acts as an attenuator, severely impeding the signal in certain directions. Correspondingly, the propagation of the signal shows strong dependence on the player’s orientation. As a player’s orientation in a soccer match is constantly changing, the radio connectivity between players, and from players to base stations, exhibits an on-again, off-again pattern. As we shall show, the body worn nature and low transmit powers have significant consequences for the delay. In this work we begin by outlining the experimental challenges in monitoring soccer players, and detail the design choices we have made. Next, we show that the operating environment inherently limits the minimum achievable delay using direct transmissions from the players to the base, and further establish that this delay is too high for real-time applications, leading naturally to an examination of multihop alternatives. Finally, we propose multi-hop routing algorithms tailored to this unique environment, which balance the conflicting requirements of low delay and minimal resource consumption. II. E XPERIMENTAL S ETUP As typifies an emerging application, very little is known about the wireless connectivity between players and from players to base stations in a soccer field. We experimentally characterised and quantified the connectivity in conjunction with a University football club. We outfitted each player in the squad with a MicaZ mote mounted using an armband on the player’s right arm, which was programmed to send out a hello packet every second. This was done in a timeslotted manner, such that only one node was transmitting at any given time. All other nodes listened, and kept track of all nodes they heard during the experiment. Further, we located 8 base stations around the field, which also listened to player transmissions. During the course of the experiment, two of the player motes were lost (due to physical contact between players), and a base station was lost (as it was hit by the soccer ball), leaving 9 functional player motes and 7 base stations. We shall refer to the aggregate base station to encapsulate all bases; thus a player can reach the aggregate base if it can
reach any of the bases. The experimental setup is illustrated in fig. 1. B1
Player Number Playing Position 1 9 attackers
B2
B8
5 93m
midfielders
6
7
B3
B7 8
4
3
defenders
B4
2 B6
10
1
Center Attack
2
Back
3
Centre Midfield A
4
Left Back
5
Center Forward
6
Left Wing
7
Right Wing
8
Centre Midfield B
9
Striker
10
Center Back
11
Goalkeeper
11 70m
Fig. 1.
B5
Experimental setup for characterizing wireless connectivity
Effectively, this data allowed us to construct, in an offline manner, the connectivity patterns between players (and from players to base stations) on a per-second basis. We found the following, 1) The encounter durations are typically very short, with 90% of the encounter durations being 4 seconds or less. 2) At each instant of time the topology is sparsely connected. Of the 81 possible unidirectional links (including 72 links between players and 9 links from each player to the aggregated base station), only a small fraction are on at a given time. 3) The inter-encounter durations exhibit a power-law distribution (as opposed to exponential) in the interval 10−100 seconds, leading to heavy-tailed inter-encounter durations in this range. The long inter-meeting times between players are a fundamental limitation that routing protocols must contend with. Our experiments, profiling and modelling of the connectivity are described in detail in [4]. Further, as we show in [5], the attenuation caused by the human body results in significant asymmetry in wireless range on the two sides of the body (with the Mote mounted on the right arm we see a range of up to 16m on the right, as opposed to only 3m on the left). The experimental data sets the stage for the routing protocols to be presented herein. III. C HALLENGES IN R EAL T IME DATA E XTRACTION Based on our connectivity profiling, we first ask whether we can directly deliver packets from the players to the base stations with acceptable delay, in order to determine whether more sophisticated strategies are required. As we shall show, however, the delays incurred by direct delivery are unacceptably high for real-time applications. Next, we ask what would be the lowest achievable delay using any protocol. With this end, we implement off-line, an impractical (in terms of resource consumption), yet optimal (in terms of delay performance) flooding-based protocol. This approach allows us to bound the delays achievable by any practical scheme and determine whether real time data extraction is possible.
A. Unsuitability of Single-Hop Routing The simplest possible forwarding scheme transmits a sample at every time instant until the sample reaches the base; since the player has no way of knowing whether a base is within listening range of its transmission, it continually transmits hoping to reach a base. We assume here and in all subsequent schemes that the base is able to inform a player when its transmission is received, and further, that transmissions take place every second. We refer to this strategy as Direct Delivery. Performance would depend heavily on player position; players which are normally located close to a base (such as the goalkeeper) will see good performance, as opposed to players located in the centre of the field (such as a midfielder). We evaluate the delay experienced by individual samples. Data samples which cannot be immediately delivered to the base are assumed to be buffered for later delivery. Thus the only packets which would remain undelivered are those generated towards the end of the game period. We assume that these samples are delivered to the base at the end of the game, and their delays are calculated accordingly. Fig. 2 presents the delay performance (in the form of a boxplot, with the mean delay superimposed as a blue star) as well as the resource consumption for Direct Delivery. The scheme is relatively frugal in terms of resource consumption, with each sample being transmitted less than 100 times on average for a majority of the players. However the mean delays lie above 50 seconds for a majority of the players, and can reach as high as 200 seconds; only the goalkeeper, who is well connected with the base, has a small delay. Clearly, such high delays are unsuitable for real-time applications, thus establishing the necessity for multi-hop routing. B. Off-line Optimal Routing The offline optimal provides a measure of the best achievable delay. We assume that once a data sample is generated, it is continually transmitted in every slot. Similarly, when a neighbour picks up the sample, it is re-transmitted by the neighbour. The only provision we make to reduce the number of transmissions in the network is to assume that, once a player transmits to the base, the base is able to inform the player that the transmission was successfully received. The player’s device then erases its entire window of samples, and the process re-starts. This results in a complete flooding based approach to data dissemination, which is intensive in terms of memory usage as well as bandwidth. However, this approach is useful in benchmarking the lowest achievable delay and the highest achievable delivery ratio. Since every available node participates in the forwarding process, this mechanism is guaranteed to provide the lowest delay. Similarly, since all samples are transmitted until they reach a base station, it provides every data sample with the highest possible chance of being delivered. We plot the delay performance from time 900 to 1400 (in the form of a boxplot with the mean superimposed as a blue star), as well as the resource consumption (the mean number of transmissions per sample) in figure 3. Note that the mean
400 500 350
400
300
Transmissions per Sample
450
Delay (seconds)
350 300 250 200 150
250 200 150 100
100 50
50
0 1
3
5
6
7 Player No.
8
9
10
11
0
0
2
4
6 Player No.
8
10
12
(a) Boxplot of Delay (b) Mean Number of Transmissions per Sample Fig. 2. Delay Performance and Resource Consumption of Direct Delivery
delays are between 7 and 18 seconds, well within the range of what is acceptable for real-time applications. However, good delay performance comes at the cost of increased resource consumption; the mean number of transmissions per sample is above 2000 for all players except the goalkeeper, between 10 and 60 times higher than what is required for direct delivery. Though impractical, this scheme allows us to explore certain characteristics of the playing environment. 1) Effect of Player Position: The player positions have an important role in determining the nature of delay. For the goalkeeper (player 11), 48% of the packets are received immediately; during these times the goalkeeper is connected to the base station directly behind the goal. In comparison, only 8% of the midfielder’s packets are delivered immediately, since the midfielder spends most of his time away from the boundaries of the field. The result is a larger median value for the delay (10 seconds as compared to 1 second for the goalkeeper). This is a fundamental limitation brought upon by the nature of player mobility as well as the radio characteristics of the devices, which any routing algorithm must contend with. 2) Effect of Intermittent Connectivity: We note that even for the goalkeeper (the best connected player in the network), the sample delays have a long tail that extends to more than 40 seconds. This is because even the goalkeeper is out of touch with the base station (located directly behind the goal) for significant periods of time, leading to periods where none of the players are able to connecte to a base. During this period, data gets flooded thru the network, awaiting a path to the base thru any player. This is a fundamental limitation on the delays brought upon by the nature of connectivity in field sports. IV. ROUTING S CHEMES FOR THE S OCCER F IELD The routing scheme proposed in the previous section is too resource-intensive for practical implementation. We first consider schemes that are extremely frugal in terms of their resource consumption, of course, at the cost of increased delay. The uniting feature of these schemes is that they only allow a small number of copies of each data sample to be in circulation at any given time. By doing so we inherently limit the number of transmissions necessary to convey the data to the base.
A. Random Forwarding One way of making use of player mobility is to probabilistically forward a data sample to other randomly encountered players. For players who see the base relatively infrequently this has the desirable effect of disseminating data to players who may have more frequent interactions with the base. If a player cannot deliver data to the base in a given time slot, it explores whether other players are able to hear its transmissions. If it is able to hear n other players, it tosses a fair (n + 1)-faced die. With probability 1/(n + 1) it keeps the packet to itself, while the probability of forwarding to any of its neighbours is 1/(n + 1) each. If the player has no neighbours in a given slot, it keeps the data sample to itself. In this way, the custodian of the data sample is chosen at every time step. The above procedure is now repeated by each custodian of the sample, until the sample hits the base station. This simple forwarding scheme results in a decrease in the mean delay for sparsely connected players, as it affords them a chance to make use of better connected players. In [6] the authors show that, for mobility models where the expected meeting time is a concave function of distance, randomized forwarding results in a reduction of the expected delivery time of the message. The assumptions for this result call for every node to move independently according to a mobility model which has this property; this does not happen in a soccer game, which exhibits correlation between player movements [4]. However, for players who hold more central positions in the field, random forwarding results in the sample reaching more peripherally located players, who have smaller expected times to hit the base. The delay performance and resource consumption of Random Forwarding is illustrated in fig. 4. The players who suffer in this scheme are those that have a very good connection with the base station, e.g. players 7, 10 and 11 (right wing, center back and goalkeeper), which are located peripherally and close to a base. Random forwarding for these players results in samples traveling inwards into the center of the field; e.g. the sample sent at time 1168 by the goalkeeper traverses the path 11 → 7 → 8 → 6 → 8 → 6 → 11, returning to
4000 3500
60
3000 Transmissions per Sample
Delay (seconds)
50
40
30
20
2500 2000 1500 1000 500 0
10
−500 0 1
3
5
6
7 Player No.
8
9
10
11
−1000
0
2
4
6 Player No.
8
10
12
(a) Boxplot of Delay (b) Mean Number of Transmissions per Sample Fig. 3. Delay Performance and Resource Consumption of Full Flooding
the goalkeeper to be finally forwarded to the base, incurring a delay of 81 seconds. The direct delivery delay on the other hand is only 20 seconds. B. Two-copy Routing Scheme In order to make the Random Forwarding scheme amenable for players who have frequent contact with the base, we introduce a second copy of each sample that is always kept with the source. The first copy is randomly forwarded exactly as in the single copy case. The delay for each sample through this scheme is effectively the minimum of the delays incurred by direct delivery and random forwarding. Clearly, this scheme will result in more transmissions per sample, while improving performance for well-connected players. We plot the delay performance as well as the resource consumption in fig. 5. As we would expect, the right wing, center back and goalkeeper all see their performance improve, while other players continue to experience the benefits of random forwarding. C. Comparison of Forwarding Based Schemes In fig. 6 we compare direct delivery, random forwarding and two-copy using the offline optimal as a reference. Note that there is still a significant gap in delay performance between the best-performing scheme (two-copy) and the offline optimal. While the frugal resource consumption is desirable, we require better delay performance for real-time applications. In the following section we consider flooding-based approaches to bridge this gap. V. A T UNABLE F LOODING S CHEME FOR S OCCER The schemes we have considered so far have fixed tradeoffs points between delay performance and resource consumption. The offline optimal is biased completely towards delay performance, resulting in very high resource consumption. On the other hand, random forwarding and direct delivery are biased towards low resource consumption, resulting in delays that are up to 16 times higher than the offline optimal. From an application viewpoint, we would like to be able to tune the performance of the scheme, either towards better delay
performance or lower resource consumption. To allow for good delay performance, we consider a flooding-based approach. A practical flooding-based strategy must be able to limit both the memory requirements as well as the transmission bandwidth. The tunable scheme we propose allows us to control these parameters, and incorporates the following features. A. Features of Proposed Scheme 1) Replication at the Source: In the proposed scheme, a player maintains a window of samples of length W for itself in a FIFO manner; thus, a newly generated sample pushes out the oldest sample in the window. During its slot, a player transmits its entire window of samples. Thus, every sample is replicated W times by the source. As in the offline optimal algorithm, this guards against the case where a sample may be lost because no other player (or base station) is able to hear the transmitter at that time. 2) Replication at Intermediate Nodes: Further, every player also maintains a window of W samples for every other player. In effect, this allows replication of the samples at every intermediate hop. When player i is not transmitting, it listens to other players’ transmissions. Packets heard from other players are then analysed for data. If a received packet contains a more recent window of samples for player j, this data replaces the contents of the window for player j held by player i. 3) Data Freshness: The above two steps limit the amount of data transmitted in any packet to a N ∗W matrix of samples (where N is the number of players). However, we still have the issue of old data being forwarded within the network. This may arise, for instance, when player i forwards its data to player j, and then becomes disconnected from other players for an ensuing interval. In this case, the data from player i may become obsolete (from an application point of view), yet continue to be forwarded by player j and its neighbours. To ensure data freshness, player j forwards data for player i only if the most recent sample in its window for player i is less than A samples old. Thus, each intermediate node filters the data it receives from surrounding players before forwarding it on. The quantity A can be selected based on the
140 350 120
Transmissions per Sample
Delay (seconds)
300 250 200 150 100 50
100
80
60
40
20
0 1
3
5
6
7 Player No.
8
9
10
0
11
0
2
4
6 Player No.
8
10
12
(a) Boxplot of Delay (b) Mean Number of Transmissions per Sample Fig. 4. Delay Performance and Resource Consumption of Random Forwarding 500
300
450 400 Transmissions per Sample
Delay (seconds)
250
200
150
100
350 300 250 200 150 100
50
50 0 1
3
5
6
7 Player No.
8
9
10
11
0
0
2
4
6 Player No.
8
10
12
(a) Boxplot of Delay (b) Mean Number of Transmissions per Sample Fig. 5. Delay Performance and Resource Consumption of Two Copy
requirements of the application. For instance, for television broadcast enhancement where players’ heart rate is streamed in real time, samples which are more than 10 seconds old may become irrelevant, and A can be set to 10. B. Behaviour of Proposed Scheme As opposed to the forwarding-based schemes, our floodingbased scheme will actively drop a window of samples as they age beyond A. As a result, certain samples may never get delivered to the base. Therefore, as compared to schemes so far, we need to evaluate an additional parameter, the delivery ratio of this scheme. Further, note that W controls the amount of replication at the source, while A controls the amount of replication in the network. A smaller value of A means that a given window of samples is likely forwarded through a smaller number of hops, as it would hit the age threshold faster. Hence small values of A result in lower delivery ratios (for players who are not well connected with the base station) as the samples are dropped within the network before they hit the base. Finally, note that the maximum time a sample can spend in the network is W +A. Note that we have chosen to implement our algorithm in this form (rather than take a more traditional
approach in terms of hop counts) for two reasons: 1) Using a window of samples for each player allows us to naturally control another important parameter, the memory requirements of this scheme, to a buffer of at most N × W samples per player. 2) Given that every player maintains a buffer of W samples for every other player, it is artificial to impose a hop count on every sample in that buffer. Rather, it is simpler and more intuitive to impose a maximum age A on the buffer, and to discard the entire buffer if the data is too old. Finally, as with other schemes we assume that the base is able to inform a player when its transmission is received, upon which the player erases its entire window of samples. C. Characterising Dependence on Parameters We evaluate the delivery ratio, delay performance and energy consumption of our tunable scheme. The results are best understood by categorising players into three classes: a) those that are well-connected with the base (e.g. the Goalkeeper), b) those that see the base infrequently but are well-connected with other players (e.g. the Centre Attack), c) those that see
4
300
10
Mean Delay (seconds)
250
Mean Transmissions per Sample
Direct Delivery Random Forwarding Two Copy Offline Optimal
200
150
100
3
10
2
10
1
Direct Delivery Random Forwarding Two Copy Offline Optimal
10
50
0
0
1
2
3
4
5
6 7 Player No.
8
9
10
10
11
1
2
3
4
5
6 7 Player No.
8
9
10
11
100
100
90
90
80
80 Delivery Ratio (%)
Delivery Ratio (%)
(a) Mean Delays of Forwarding-based Schemes (b) Resource Consumption of Forwarding-based Schemes Fig. 6. Comparing Delay Performance and Resource Consumption of Forwarding-based Schemes
70 Player1 A =5 Player1 A =10 Player1 A =15 Player1 A =20 Player11 A =5 Player11 A =10 Player11 A =15 Player11 A =20
60
50
40
30 10
15
20
25 30 35 Window Length W
40
45
70
60 Player9 A =5 Player9 A =10 Player9 A =15 Player9 A =20
50
40
50
30 10
15
20
25 30 35 Window Length W
40
45
50
(a) Player 1 (Center Attack) and Player 11 (Goalkeeper) (b) Player 9 (Striker) Fig. 7. Delivery Ratios for Center Attack, Goalkeeper and Striker as a function of W and A for Tunable Scheme
both the base as well as other players infrequently, (e.g. the Striker). We plot the delivery ratios for representatives of each of the above three categories (the Goalkeeper, Centre Attack and Striker) in fig. 7, and the mean delays and resource consumption for the Centre Attack and Goalkeeper in fig. 8 (a) and (b) respectively (the delay performance of the Striker is found to be qualitatively similar to that of the Centre Attack for the latter two parameters), and analyse each class of players. Well-Connected to the Base: These players (e.g. Goalkeeper) need very little support from the network. Thus their delivery ratio is insensitive to A, and depends only on W . Similarly, their delay performance is insensitive to A since they delivers most of their packets directly to the base. Further, their resource consumption saturates with increasing W (as opposed to other classes where the resource consumption increases roughly linearly); since this class of players deliver most samples directly to the base, (and players flush their buffers on reaching the base), samples are typically not transmitted for the entire duration of the window. Well-Connected with Other Players: These players need a certain minimum level of network support to deliver their packets. Thus, delivery ratio is poor for A = 5, but becomes
insensitive to A for A ≥ 10. Similarly, at small A values the burden of deliver falls on the source. Thus, we see higher mean delays for small A (occurring at higher values of W ), while the mean delay decreases for higher A values (even as the delivery ratio increases). This shows that, as the forwarding load is balanced between the source and the network, both delivery ratio and mean delay can be improved. The resource consumption for this class of players increases roughly linearly with W , with a slope determined by A (A determines the degree to which a sample sent by the source is forwarded in the network, which defines the slope). Infrequently Connected with Base and Players: Players in this category (e.g. Striker) show similar characteristics as the previous class, except in their delivery ratio. Due to their isolation, they require substantial support from the network, and their delivery ratio rises steadily with A. D. Tuning the Parameters In the previous section we varied W and A independently. We now ask how we should divide our resources between W (the source) and A (the network). We plot the delivery ratio, mean delay and resource consumption for our tunable scheme for different W and A values, with W + A = 45, in figs. 9,
Player1 A =5 Player1 A =10 Player1 A =15 Player1 A =20 Player11 A =5 Player11 A =10 Player11 A =15 Player11 A =20
16
Mean Delay
14
350 Player1 A =5 Player1 A =10 Player1 A =15 Player1 A =20 Player11 A =5 Player11 A =10 Player11 A =15 Player11 A =20
300 Mean Transmissions per Sample
18
12 10 8 6
250
200
150
100
50
4 2 10
15
20
25 30 35 Window Length W
40
45
0 10
50
15
20
25 30 35 Window Length W
40
45
50
(a) Mean Delay (b) Resource Consumption) Fig. 8. Mean Delay and Resource Consumption of Tunable Scheme as a function of W and A 250
10 and 11. 100
200
Mean Transmissions per sample
95
90
Delivery Ratio (%)
85
80
75
65
60
1
Fig. 9.
2
3
W =35; A =10 W =30; A =15 W =25; A =20 W =20; A =25 W =15; A =30 W =10; A =35 4 5
0
6 Player No.
7
8
9
10
Delivery performance of Tunable scheme with W + A = 45
14
12
10
8
W =35; A =10 W =30; A =15 W =25; A =20 W =20; A =25 W =15; A =30 W =10; A =35
6
4
1
Fig. 10.
2
3
4
1
2
3
4
5
6 Player No.
7
8
9
10
11
Fig. 11.
Resource consumption of Tunable scheme with W + A = 45
limits the source transmissions which inherently limits resource consumption. Of course, this comes at the cost of a lower delivery ratio. 2) When higher resource consumption is acceptable, our scheme can be tuned towards higher W (W = 25, 30); the resulting increase in source transmissions (coupled with sufficient network support) increases the delivery ratio at the expense of higher resource consumption. 3) As before, choosing a very high value of W (W = 35) puts the burden of delivery on the source and is counterproductive
16
Mean Delay (seconds)
W =35; A =10 W =30; A =15 W =25; A =20 W =20; A =25 W =15; A =30 W =10; A =35
11
18
2
100
50
70
55
150
VI. D ISCUSSION
5
6 Player No.
7
8
9
10
11
Delay performance of Tunable scheme with W + A = 45
We note the following, 1) When low resource consumption is required, our scheme can be tuned to small W values (e.g. W = 10, 15); this
The performance of all schemes is compared in figs. 12 and 13. The proposed tunable flooding-based scheme allows us to control the level of resource consumption to achieve desired delivery ratios. We see that at high delivery ratios (> 90%) achieved with [W = 30, A = 15], the scheme is able to achieve delay performance that is very close to that of the offline optimal, while keeping resource consumption within a factor of 4 from that of forwarding-based schemes; we
note that the resource consumption is only a tenth of what is required by the offline optimal. The reader may be wondering why the delay performance of our scheme is better than the optimal; it must be noted that the optimal delivers all packets, while our scheme does not. On the other hand, when a high delivery ratio is not required, our scheme is tunable to reduce resource consumption even further. Direct Delivery Random Forwarding Two Copy Tunable (W=30, A=15) Offline Optimal
Mean Delay
200
150
100
50
0
1
2
Fig. 12.
3
4
5
6 7 Player No.
8
9
10
11
Comparing Delay Performance of Different Schemes
4
Mean Transmissions per Sample
10
3
10
2
10
Direct Delivery Random Forwarding Two Copy Tunable (W=30, A=15) Offline Optimal
1
10
0
10
1
Fig. 13.
2
3
4
5
6 7 Player No.
8
9
10
VIII. C ONCLUSION AND F UTURE W ORK In this work we present the novel application of sensor networks to monitoring soccer players. We elaborate the experimental challenges involved in data collection in this setting and elucidate our design choices. Next we show that the delays achievable by direct transmission from players to base are unacceptably high, motivating the need for a multi-hop solution. Finally, we devise a tunable flooding-based multi-hop solution and illustrate its desirable characteristics on trace data collected from a real game. In future we plan to relax some of our assumptions (e.g. perfect feedback from the base stations back to player nodes) to explore their effect on performance. This is in keeping with our final aim of devising an end-to-end protocol for real-time athlete monitoring.
300
250
application, include Direct Transmission [13], Randomized Routing [14] and Spray and Wait [15]. Our evaluation of these protocols have shown their delay performance to be inadequate for this specific application, and motivated the development of our multi-hop scheme which includes parameters that can be tuned to the deployment scenario.
11
Comparing Resource Consumption of Different Schemes
VII. R ELATED W ORK Routing for dynamic networks has been studied in the literature, mostly in the context of mobile ad-hoc networks and delay tolerant networks [7]. Several protocols, including AODV [8], DSDV [9] and DSR [10], assume the existence of a stable route from the source to the destination, rendering them unusable in the soccer monitoring application. Other protocols such as Seek and Focus protocol [6], PROPHET [11] and MAXPROP [12] assume that the interaction between nodes is sufficiently long to allow the exchange of utility metrics which determine forwarding decisions. However, our analysis of the interconnectivity between soccer players in [4] shows connectivity periods to be too short to allow exchange of such metrics. The only routing schemes proposed for highly dynamic networks, as arise in the soccer monitoring
R EFERENCES [1] GPSports Systems, “SPI Pro.” [Online]. Available: http://gpsports.com [2] Visuallex Sport International Ltd, “VXSport: Performance You Can See.” [Online]. Available: http://www.vxsport.com/ [3] Toumaz Technology Ltd, “Toumaz: Connected Freedom.” [Online]. Available: http://www.toumaz.com/ [4] V. Sivaraman, S. Grover, A. Kurusingal, A. Dhamdhere, and A. Burdett, “Experimental study of mobility in the soccer field with application to real-time athlete monitoring,” in Proceedings of IEEE WiMob, Niagara Falls, Canada, Oct. 2010. [5] A. Kurusingal, A. Dhamdhere, and V. Sivaraman, “Modeling signal strength of body-worn devices,” in Proceedings of IEEE Int’l. Conf. on Local Computer Networks (LCN), Denver, Colorado, Oct. 2010. [6] T. Spyropoulos, K. Psounis, and C. S. Raghavendra, “Efficient routing in intermittently connected mobile networks: the single-copy case,” IEEE/ACM Transactions on Networking, vol. 16, no. 1, pp. 63–76, 2008. [7] S. Jain, K. Fall, and R. Patra, “Routing in a delay tolerant network,” in SIGCOMM ’04. New York, NY, USA: ACM, 2004, pp. 145–158. [8] I. D. Chakeres and E. M. Belding-Royer, “AODV routing protocol implementation design,” in IEEE ICDCSW, Washington, DC, USA, Mar 2004, pp. 698–703. [9] C. E. Perkins and P. Bhagwat, “Highly dynamic destination-sequenced distance-vector routing (dsdv) for mobile computers,” SIGCOMM Comput. Commun. Rev., vol. 24, no. 4, pp. 234–244, 1994. [10] D. B. Johnson, D. A. Maltz, and J. Broch, DSR: The Dynamic Source Routing Protocol for Multihop Wireless Ad Hoc Networks. Boston, MA, USA: Addison-Wesley Longman Publishing Co., Inc., 2001, pp. 139–172. [11] A. Lindgren, A. Doria, and O. Schel´en, “Probabilistic routing in intermittently connected networks,” SIGMOBILE Mob. Comput. Commun. Rev., vol. 7, no. 3, pp. 19–20, 2003. [12] J. Burgess, B. Gallagher, D. Jensen, and B. N. Levine, “Maxprop: Routing for vehicle-based disruption-tolerant networks,” in IEEE INFOCOM, 2006, pp. 1–11. [13] M. Grossglauser and D. Tse, “Mobility increases the capacity of ad hoc wireless networks,” IEEE/ACM Transactions on Networking, vol. 10, no. 4, pp. 477–486, Aug 2002. [14] R. C. Shah, S. Roy, S. Jain, and W. Brunette, “Data mules: Modeling and analysis of a three-tier architecture for sparse sensor networks,” Ad Hoc Networks, vol. 1, no. 2-3, pp. 215 – 233, 2003. [15] T. Spyropoulos, K. Psounis, and C. Raghavendra, “Efficient routing in intermittently connected mobile networks: The multiple-copy case,” IEEE/ACM Transactions on Networking, vol. 16, no. 1, pp. 77–90, Feb 2008.