likely to have fewer defects than a small entity responsible for complicated compiler ... concepts and business logic embedded with the entities [4]. Recent studies ..... sible for dispatching events according to network protocol responses.
Explaining Software Defects Using Topic Models Tse-Hsun Chen, Stephen W. Thomas, Meiyappan Nagappan, Ahmed E. Hassan Software Analysis and Intelligence Lab (SAIL) School of Computing, Queen’s University, Canada {tsehsun, sthomas, mei, ahmed}@cs.queensu.ca
Abstract—Researchers have proposed various metrics based on measurable aspects of the source code entities (e.g., methods, classes, files, or modules) and the social structure of a software project in an effort to explain the relationships between software development and software defects. However, these metrics largely ignore the actual functionality, i.e., the conceptual concerns, of a software system, which are the main technical concepts that reflect the business logic or domain of the system. For instance, while lines of code may be a good general measure for defects, a large entity responsible for simple I/O tasks is likely to have fewer defects than a small entity responsible for complicated compiler implementation details. In this paper, we study the effect of conceptual concerns on code quality. We use a statistical topic modeling technique to approximate software concerns as topics; we then propose various metrics on these topics to help explain the defect-proneness (i.e., quality) of the entities. Paramount to our proposed metrics is that they take into account the defect history of each topic. Case studies on multiple versions of Mozilla Firefox, Eclipse, and Mylyn show that (i) some topics are much more defect-prone than others, (ii) defect-prone topics tend to remain so over time, and (iii) defect-prone topics provide additional explanatory power for code quality over existing structural and historical metrics. Keywords-software concerns; code quality; topic modeling
I. I NTRODUCTION AND M OTIVATION Code quality is an important issue in software engineering because the cost of fixing software defects can be prohibitively high [1]. As a result, researchers have tried to uncover the possible reasons for software defects using different classes of software metrics, such as product metrics, process metrics, and project metrics [2, Chapter 4] [3]. Indeed, such metrics have shown a certain success in explaining the defect-proneness of certain software entities (e.g., methods, classes, files, or modules) [3]. However, these classes of metrics do not take into account the actual conceptual concerns of the software system—the main technical concepts and business logic embedded with the entities [4]. Recent studies propose a new class of metrics based on conceptual concerns [4]–[7]. These studies approximate concerns using statistical topic models, such as latent Dirichlet allocation [8]. Statistical topic models discover topics (i.e., sets of related words) within the source code entities, which researchers use as surrogates for conceptual concerns. These studies provide initial evidence that topics in software systems are related to the defect-proneness of source code
entities, opening a new perspective for explaining why some entities are more defect-prone than others. In this paper, we build on this line of research by considering the defect history of topics, and propose a new set of metrics based on this history. We study the effects of our new topic metrics on code quality. We perform a detailed case study on three large, real-world software systems, with a focus on the following research questions. RQ1: Are some topics more defect-prone than others? We find that some topics, such as those related to new features and the core functionality of a system, have a much higher defect density than others. RQ2: Do defect-prone topics remain defect-prone over time? We find that defect-prone topics remain so over time, indicating that prior defect-proneness of a topic can be used to explain the future behavior of topics and their associated entities. RQ3: Can our proposed topic metrics help explain why some entities are more defect-prone than others? We find that including our proposed topic metrics provides additional explanatory power about the defect-proneness of entities over existing product and process metrics. The rest of this paper is organized as follows. In Section II, we describe our approach to discover topics in source code entities, and we define the topic metrics that we use to answer our research questions. In Section III, we introduce the subject systems that we study, and outline the design of our case studies. We present our results in Section IV. We discuss the potential threats to the validity of our case studies in Section V, and describe related work in Section VI. Finally, we conclude in Section VII. II. P ROPOSED A PPROACH In this section, we outline our approach to use topics to explain defects. First, we briefly introduce topic modeling and describe how it can be applied to source code entities to approximate conceptual concerns. Next, we motivate and describe our new topic metrics.
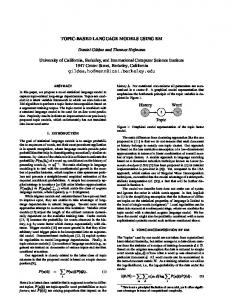
z1
Top words z1 z2 z3
os, cpu, memory, kernel network, speed, bandwidth button click mouse right (a) Topics (Z).
f1 f2 f3
z2
z3
0.3 0.7 0.0 0.0 0.9 0.1 0.5 0.0 0.5
(b) Topic memberships (θ).
Figure 1. Example topic model in which three topics are discovered from three entities. (a) The three discovered topics (z1 , ..., z3 ) are defined by their top (i.e., highest probable) words. (b) The three original source code entities (f1 , ..., f3 ) are represented by a topic membership vector.
A. Topic Modeling Our goal is to determine which concerns are in each source code entity. This information is often not easily available, since developers do not often manually categorize each entity [6]. In this paper, we approximate concerns using statistical topics, following the work of previous research [6], [9], [10]. In particular, we extract the linguistic data from each source code entity, i.e., the identifier names and comments, which helps to determine the functionality of the entity [11]. We then treat the linguistic data as a corpus of textual documents, which we use as a basis for topic modeling. In topic modeling, a topic is a collection of frequently co-occurring words in the corpus. Given a corpus of n documents f1 , ..., fn , topic modeling techniques automatically discover a set Z of topics, Z = {z1 , ..., zK }, as well as the mapping θ between topics and documents (see Figure 1). The number of topics, K, is an input that controls the granularity of the topics. We use the notation θij to describe the topic membership value of topic zi in document fj . Intuitively, the top words of a topic are semantically related and represent some real-world concept. For example, in Figure 1a, the three topics represent the concepts of “operating systems,” “computer networks,” and “user input.” The topic membership of a document then describes which concepts are present in that document: document f1 is 30% about operating systems and 70% about computer networks. More formally, each topic is defined by a probability distribution over all of the unique words in the corpus. Given two Dirichlet priors, α and β, a topic model will generate a topic distribution θj for fj based on α, and generate a word distribution φi for zi based on β. Choosing the right parameter values for K, α, and β is more of an art than a science, and depends on the size of the corpus and the desired granularity of the topics [12]. B. Proposed Topic Metrics To help explain the defect-proneness of source code entities, we propose two categories of topic metrics: static and historical. Static topic metrics use only a single snapshot of the software system, while historical metrics use the
defect history of topics. In the formulation of our topic metrics, we also consider traditional software metrics: • LOC(fj ) The lines of code of entity fj . • PRE(fj ) The number of pre-release defects of entity fj , which are those defects related to fj up to six months before a given version. • POST(fj ) The number of post-release defects of entity fj , which are those defects found up to six months after a given version. Using these software metrics and the results of topic modeling, we propose the following topic metrics. 1) Topic Defect Density: The defect density of a source code entity is a well-known software metric, defined as the ratio of the number of defects in the entity to its size. Using this ratio as motivation, we define the pre-release defect density (DPRE ) of a topic zi as � � n X PRE(fj ) , (1) θij ∗ DPRE (zi ) = LOC(fj ) j=1 where n is the total number of source code entities and θij is the topic membership of topic zi in source code entity fj . Similarly, we define post-release defect density (DPOST ) of a topic zi as � � n X POST(fj ) θij ∗ . (2) DPOST (zi ) = LOC(fj ) j=1 Since the topic membership value represents the probability that a source code entity belongs to a certain topic, the topic defect density represents the possible number of defects in the topic per line of code across all entities that contain the topic. 2) Static Metrics: We propose static metrics to capture the number of topics an entity contains, and the topic membership of each entity. We define the Number of Topics (NT) of an entity fj as NT(fj ) =
K X
I(θij ≥ δ)
(3)
i=1
where I is the indicator function that returns 1 if its argument is true, and 0 otherwise. δ is a cut-off threshold that determines if a topic plays an important role in a given entity. The NT metric measures the level of cohesion in an entity: entities with a large number of topics may be poorly designed or implemented, and thus may have higher chances to have defects [4]. We define the Topic Membership (TM) of an entity fj as the topic membership values returned by the topic modeling technique: TM(fj ) = θj . (4) The intuition behind this metric is that we assume different topics have different effects on the defect-proneness of an entity. Some topics (e.g., a compiler-related topic) may
Figure 2. Process of calculating topic metrics. After preprocessing the source code, we run LDA on all versions of the source code entities together. Using the topics and topic memberships that LDA returns, we calculate the topic metrics.
increase the defect-proneness of an entity, but other topics (e.g., an I/O-related topic) may actually decrease the defectproneness. By using all the topic membership values, the TM metric captures the full behavior of an entity. 3) Historical Metrics: We extend the static metrics by considering the defect history of each topic. In order to calculate the number of defect-prone topics in an entity, we define a defect-prone topic as a topic that has more defects than the average of all topics. The set of defect-prone topics, B, is defined by B = {zi ∈ Z s.t. DPRE (zi ) > µ(DPRE (Z))},
(5)
where µ(DPRE (Z)) is the mean of the topic defect densities of all topics. We define the Number of Defect-prone Topics (NDT) in entity fj by NDT(fj ) =
K X
I((zi ∈ B) ∧ ((θij ) ≥ δ)).
(6)
i=1
We define the Defect-prone Topic Membership (DTM) metric of entity fj as the topic memberships of defect-prone topics: DTM(fj ) = θij where zi ∈ B. (7) DTM is the same as TM, except it only contains the topic memberships of defect-prone topics. III. C ASE S TUDY D ESIGN In this section, we introduce the subject systems that we use for our case study and we describe our analysis process, depicted in Figure 2. A. Subject Systems We focus on three large, real-world subject systems: Mylyn, Eclipse, and Firefox (Table I). For each system, we look at three different versions (versions 1.0, 2.0, and 3.0 of Mylyn, versions 2.0, 2.1, and 3.0 of Eclipse, and versions 1.0, 1.5, and 2.0 of Firefox). Eclipse is a popular IDE, which has an extensive plugin architecture. Mylyn is a popular plugin for Eclipse that implements a task management system. Firefox is a well-known open source web browser that is used by millions of users.
Table I S TATISTICS OF THE SUBJECT SYSTEMS . Total lines No. of Pre-release Post-release Programming of code (K) files defects defects language Mylyn 1.0 Mylyn 2.0 Mylyn 3.0
161 1,917 198 3,710 245 1,521
1,142 2,504 2,616
775 1,206 624
Java Java Java
Firefox 1.0 Firefox 1.5 Firefox 2.0
3,008 5,862 3,329 6,322 3,447 6,468
642 721 1,151
457 960 456
C C C
Eclipse 2.0 Eclipse 2.1 Eclipse 3.0
800 6,729 988 7,888 1,306 10,593
7,635 4,975 7,422
1,692 1,182 2,679
Java Java Java
B. Data Preprocessing The source code entities that we use in this paper are at the granularity level of source code files. We first collect the source code entities from each version of each subject system, and then preprocess the entities using the preprocessing steps proposed by Kuhn et al. [11]. Namely, we first extract comments and identifier names from each entity. Next, we split the identifier names according to common naming conventions, such as camel case and underscores. Finally, we stem the words and remove common Englishlanguage stop words. C. Topic Modeling We use a popular topic modeling technique called latent Dirichlet allocation (LDA) [8]. (We note that other topic models can be used.) We choose LDA because LDA is a generative statistical model, which helps to alleviate model overfitting, compared to other topic models such as Probabilistic LSI [13]. In addition, LDA has been shown to be effective for a variety of software engineering purposes, including analyzing source code evolution [14], calculating source code metrics [15], and recovering traceability links between source code and requirements documents [16]. Finally, LDA is fast and can easily scale to millions of documents. We apply LDA to all versions of the preprocessed entities of a system at the same time, an approach proposed by
0.03 0.03 0.06
1.66 1.16 1.25
13.28 7.92 4.90
Firefox 1.0 Firefox 1.5 Firefox 2.0
0.00 0.00 0.00
0.00 0.00 0.00
0.00 0.00 0.00
0.00 0.00 0.00
0.07 0.09 0.07
6.44 5.88 7.96
Linstead et al. [7]. For this study, we use K=500 topics for all subject systems. Lukins et al. found that 500 topics is a good number for Eclipse and Mozilla [17], and we also feel this is a reasonable choice for Mylyn. Section V discusses this choice further. We use MALLET [18] as our LDA implementation, which uses Gibbs sampling to approximate the joint distribution of topics and words. We run MALLET with 10,000 sampling iterations, and use the parameter optimization in the tool to optimize α and β. In addition, we build the topics using both unigrams (single words) and bigrams (pairs of adjacent words), since bigrams help to improve the performance for word assignments in topic modeling [19]. We set the membership threshold δ in Equations 3 and 6 to 1%. This value prevents topics with small, insignificant memberships in an entity from being counted in that entity’s metrics. IV. C ASE S TUDY R ESULTS In this section, we present the results of our case study. We present each research question with three sections: the approach we used to address the question; our experimental results; and a discussion of the results. RQ1: Are some topics more defect-prone than other topics? Approach: We use Equation 2 to calculate the topic defect density (DPOST ) for each topic in the software system. We visualize the distribution of defect densities using box plots, and we provide a table of the five number summary and skewness of the densities. We then perform KolmogorovSmirnov non-uniformity tests to statistically determine if there is a significant difference between the defect densities of the various topics. Results: The box plots of the density values of each software system are shown in Figure 3. Box plots show outliers and the five-number summary of the data (minimum, first quartile, median, third quartile, maximum). The
0.4 0.2
0.01 0.01 0.02
0.0
0.00 0.00 0.01
Mylyn 1.0
Mylyn 2.0
Mylyn 3.0
Firefox 1.0
Firefox 1.5
Firefox 2.0
Eclipse 2.0
Eclipse 2.1
Eclipse 3.0
0.08
0.00 0.00 0.00
0.04
Eclipse 2.0 Eclipse 2.1 Eclipse 3.0
0.00
7.18 7.41 6.00
1.5
Skewness
0.33 0.50 0.18
1.0
Max.
0.01 0.02 0.01
0.5
3rd Qu.
0.00 0.01 0.00
0.0
Median
0.00 0.00 0.00
Defect Density (DPOST)
1st Qu.
0.00 0.00 0.00
Defect Density (DPOST)
Min. Mylyn 1.0 Mylyn 2.0 Mylyn 3.0
Defect Density (DPOST)
Table II F IVE - NUMBER SUMMARY AND SKEWNESS OF DEFECT DENSITIES OF ALL SUBJECT SYSTEMS . T HE DEFECT DENSITIES ARE HIGHLY SKEWED , AND MOST OF THE TOPICS HAVE A DENSITY VALUE CLOSE TO ZERO .
Figure 3. Box plots of the topic defect density of three versions of Mylyn, Firefox, and Eclipse. The y-axis represent the topic defect density.
actual values of the five-number summary and skewness of the defect densities is shown in Table IV. The outliers in Figure 3 are the defect-prone topics, which indicate that some topics have much higher defect densities than others. Table IV further indicates that most topics have a low (almost zero) defect density value, and the values are significantly postively skewed. The number of topics and defect-prone topics for each system is consistent across versions (Table III). We find that Mylyn has more defect-prone topics than the other two systems, while Firefox has the least number of defectprone topics. In addition, Eclipse has the highest mean defect density among three systems. Finally, we apply the Kolmogorov-Smirnov test on the topic defect density values of each version of each subject system to verify the non-uniformity illustrated by our visualizations. If the p-value computed using KolmogorovSmirnov test is high, then the data is more likely to be uniformly distributed. However, we find that the p-values for all systems are significantly small (< 0.001), indicating
Table III F OR EACH SYSTEM , WE SHOW THE MEAN DEFECT DENSITY VALUE ACROSS ALL TOPICS (µ(DPOST )), THE NUMBER AND PERCENTAGE OF DEFECT- PRONE TOPICS (NDT), THE MEDIAN NUMBER OF TOPICS IN EACH ENTITY (M ED . NT), AND THE MEDIAN NUMBER OF DEFECT- PRONE TOPICS IN EACH ENTITY (M ED NDT). K µ(DPOST ) Mylyn 1.0 Mylyn 2.0 Mylyn 3.0
NDT Med. (NT) Med. (NDT)
500 500 500
0.01 139 (27.8%) 0.02 137 (27.4%) 0.01 128 (25.6%)
9 9 9
7 7 7
Eclipse 2.0 500 Eclipse 2.1 500 Eclipse 3.0 500
0.03 122 (24.4%) 0.03 124 (24.8%) 0.06 136 (27.2%)
9 9 10
5 5 6
Firefox 1.0 500 Firefox 1.5 500 Firefox 2.0 500
0.00 106 (21.2%) 0.00 111 (22.2%) 0.00 82 (16.4%)
5 5 5
3 3 2
that the distribution of defect density values is indeed not uniform [20]. Discussion: To better understand why some topics are more defect-prone than others, we investigated the relevant words of the top three most and least defect-prone topics (Table IV). Mylyn (previously known as Mylar) is an Eclipse plugin for task management. We find that the topics with the highest defect densities are (i) those dealing with the Eclipse integration (topic 421), likely because the Eclipse plugin API changes so often; (ii) those that are related to the core functionality of the system, i.e., tasks and the task UI (topics 164 and 168); and (iii) those dealing with the test suite of Mylyn (topic 400), likely because of adding test cases for new defect fixes. On the other hand, the least defect-prone topics deal with images and color (topics 405 and 178) and data compression (topic 175). We postulate that the logic behind these functions may be simpler and better defined than that of the core functionality topics. Regarding Eclipse, two of the most defect-prone topics (topics 496 and 492) in Eclipse 2.0 are about CVS plug-ins. The build notes for this release indicate that the plug-ins supporting CVS-related functionalities were first introduced in this version, making it an active area of development. (In fact, according to Eclipse’s defect repository, 17 defects relating to CVS remained unfixed after the 2.0 release.) A similar story holds for Eclipse 2.1, when integration for the Apache Ant build system was actively developed, leading to many defects in topic 131. Another set of defect-prone topics in Eclipse deals with low-level details such as memory operations and message passing (topics 462, 169, and 233). We hypothesize that the logic needed to implement these topics are more complex, leading to more defects.
The least defect-prone topics in Eclipse include those about bit-wise operations (topic 116), arrays (topic 182), and parameter parsing (topic 192). One reason that these might contain fewer defects is that errors in these topics may be observed during run time (e.g., ”array out-of-bounds”) and are thus more easily detected by developers during the testing phase of the project. One of the most defect-prone topics in Firefox 1.0 and 1.5 deals with event handing (topic 101), which is responsible for dispatching events according to network protocol responses. The topic is likely more defect-prone because the network stack has been modified several times to enable the dynamic re-rendering of complex webpages as they are being loaded. Another defect-prone topic in Firefox 2.0 deals with accessing saved states (topic 80). The release notes for this version indicate that new features were introduced that allow the browser to restore previous sessions, and that the tabbed browsing functionality is updated. Scanner Access Now Easy (SANE), an API that enables a scanner/digital camera application to be created with JavaScript, is one of the least defect-prone topics in all versions of Firefox (topic 280). Another topic that is not defect-prone deals with Base64 encoding (topic 359—the characters are segments of encoded characters), a known character standard. RQ2: Do defect-prone topics remain defect-prone over time? Approach: In RQ1, we found that some topics are more defect-prone than other topics. In order to verify that these topics are consistently defect-prone over time, we compute the Spearman correlation of the topic defect density values among different versions. By ranking the density values and computing correlation on the ranks, Spearman rank correlation is able to account for skewed distributions. Results and Discussion: Table V shows the correlation among different versions of a system. The correlation values are consistently medium to high between different versions, which indicates that a defect-prone topic is still likely to be defect-prone in the later versions. We also see evidence of this in Table IV, as several of the top defect-prone topics are listed for each of the versions of a software system. Therefore, it would be better to allocate more testing resources to previously-identified defect-prone topics, as they are likely to remain defect-prone in later releases. RQ 3: Can our proposed topic metrics help explain why some entities are more defect-prone than others? In this research question, we examine how much more deviance in post-release defects our topic metrics can explain, with respect to traditional baseline metrics. This type of analysis allows us verify our empirical theory that topic metrics provide additional explanatory power.
Table IV T OP WORDS AND DEFECT DENSITIES OF THE MOST / LEAST DEFECT- PRONE TOPICS IN OUR SUT S . Most Defect Prone Top words
Density
Least Defect Prone Top words
Density
Table V S PEARMAN CORRELATION COEFFICIENTS OF EACH TOPIC ’ S DEFECT DENSITY ACROSS SOFTWARE VERSIONS .
Mylyn 1.0 421 mylar, eclips, eclips mylar, mylar intern, mylar task 164 task, list, task list, task ui, ui, plugin 400 test, suit, test suit, add test, add, suit add
0.334 405 src, dest, base, imag, fragment, imag pattern 0.182 178 lower color, part, put light green lower, jface, medium 0.180 175 monitor, gzip, configur, key, bugzilla attribut, iter