functionality of a software component is one of the major drivers behind log- ...... On the other hand, testing code is mainly used for in-house diagnosis, and the impact .... Brown, P. F., deSouza, P. V., Mercer, R. L., Pietra, V. J. D., and Lai, J. C..
Noname manuscript No. (will be inserted by the editor)
Studying Software Logging Using Topic Models Heng Li · Tse-Hsun (Peter) Chen · Weiyi Shang · Ahmed E. Hassan
Received: date / Accepted: date
Abstract Software developers insert logging statements in their source code to record important runtime information; such logged information is valuable for understanding system usage in production and debugging system failures. However, providing proper logging statements remains a manual and challenging task. Missing an important logging statement may increase the difficulty of debugging a system failure, while too much logging can increase system overhead and mask the truly important information. Intuitively, the actual functionality of a software component is one of the major drivers behind logging decisions. For instance, a method maintaining network communications is more likely to be logged than getters and setters. In this paper, we used automatically-computed topics of a code snippet to approximate the functionality of a code snippet. We studied the relationship between the topics of a code snippet and the likelihood of a code snippet being logged (i.e., to contain a logging statement). Our driving intuition is that certain topics in the source code are more likely to be logged than others. To validate our intuition, we conducted a case study on six open source systems, and we found that i) there exists a small number of “log-intensive” topics that are more likely to be logged than other topics; ii) each pair of the studied systems share 12% to 62% common topics, and the likelihood of logging such common topics has a statistically significant correlation of 0.35 to 0.62 among all the studied systems; and iii) our topic-based metrics help explain the likelihood of a code Heng Li, Ahmed E. Hassan Software Analysis and Intelligence Lab (SAIL) Queen’s University Kingston, Ontario, Canada E-mail: {hengli, ahmed}@cs.queensu.ca Tse-Hsun (Peter) Chen, Weiyi Shang Department of Computer Science and Software Engineering Concordia University Montreal, Quebec, Canada E-mail: {peterc, shang}@encs.concordia.ca
2
Heng Li et al.
snippet being logged, providing an improvement of 3% to 13% on AUC and 6% to 16% on balanced accuracy over a set of baseline metrics that capture the structural information of a code snippet. Our findings highlight that topics contain valuable information that can help guide and drive developers’ logging decisions.
1 Introduction Developers depend heavily on logging statements for collecting valuable runtime information of software systems. Such information can be used for a variety of software quality assurance tasks, such as debugging and understanding system usage in production (Chen et al., 2016a, 2017a; Mariani and Pastore, 2008; Oliner et al., 2012; Syer et al., 2013; Xu et al., 2009; Yuan et al., 2010). Logging statements are inserted by developers manually in the code to trace the system execution. As there exists no standard guidelines nor unified policies for software logging, developers usually miss including important logging statements in a system, resulting in blind code spots (i.e., cannot recover system execution paths) when debugging (Yuan et al., 2011, 2014). However, adding logging statements excessively is not an optimal solution, since adding unnecessary logging statements can significantly increase system overhead (Zeng et al., 2015) and mask the truly important information (Fu et al., 2014). Prior studies proposed approaches to enhance the information that is contained in logging statements through static analysis (Yuan et al., 2011, 2014) and statistical models (Lal and Sureka, 2016; Li et al., 2017a,b; Zhu et al., 2015). These approaches help developers identify code locations that are in need of additional logging statements, or in need of log enhancement (e.g., requiring the logging of additional variables). However, the aforementioned approaches do not take into account the functionality of a code snippet when making logging suggestions. We believe that code snippets that implement certain functionalities are more likely to require logging statements than others. For example, Listing 1 and Listing 2 show two code snippets from the Qpid-Java 1 system.These two methods are of similar size and complexity, yet the method shown in Listing 1 has a logging statement to track a connection creation event, while the method shown in Listing 2 has no logging statements. The different logging decisions in these two code snippets might be explained by the fact that these two code snippets are related to different functionalities: the first code snippet is concerned with “connection”, while the second code snippet is concerned with “string builder”. In addition, in Section 2, we show real-life requirements for adding logging statements in the context of “connection”. Prior research (Linstead et al., 2008; Liu et al., 2009a; Maskeri et al., 2008; Nguyen et al., 2011) leverage statistical topic models such as latent Dirichlet allocation (Blei et al., 2003) to approximate the functionality of a code snippet. 1
https://qpid.apache.org/components/java-broker
Studying Software Logging Using Topic Models
3
public QueueConnection createQueueConnection() throws JMSException { QpidRASessionFactoryImpl s = new QpidRASessionFactoryImpl(_mcf, _cm, QpidRAConnectionFactory.QUEUE_CONNECTION); if (_log.isTraceEnabled()) _log.trace("Created queue connection: "+s); return s; } Listing 1 A logged method that is related to the “connection” topic.
public String toString( String tabs ) { StringBuilder sb = new StringBuilder(); sb.append( tabs ).append( "LessEqEvaluator : " ).append( super.toString() ).append( "\n" ); return sb.toString(); } Listing 2 A method that is related to the “string builder” topic.
Such topic models create automated topics (using co-occurrences of words in code snippets), and these topics provide high-level representations of the functionality of code snippets (Baldi et al., 2008a; Chen et al., 2016b; Thomas et al., 2010). We conjecture that source code that is related to certain topics is more likely to contain logging statements. We also want to determine if there exist common topics that are similarly logged across software systems. In particular, we performed an empirical study on the relationship between code topics and logging decisions in six open source systems: Hadoop, Directory-Server, QpidJava, CloudStack, Camel and Airavata. We focus on the following research questions: RQ1: Which topics are more likely to be logged? A small number of topics are more likely to be logged than other topics. Most of these log-intensive topics capture communication between machines or interaction between threads. Furthermore, we observe that the logging information that is captured by topics is not statistically correlated to code complexity. RQ2: Are common topics logged similarly across different systems? Each studied system shares a portion (12% to 62%) of its topics with other systems, and the likelihood of logging the common topics has a statistically significant correlation of 0.35 to 0.62 among these studied systems. Therefore, developers of a particular system can consult other systems when making their logging decisions or when developing logging guidelines.
4
Heng Li et al.
RQ3: Can topics provide additional explanatory power for the likelihood of a code snippet being logged? Our topic-based metrics provide additional explanatory power (i.e., an improvement of 3% to 13% on AUC and an improvement of 6% to 16% on balanced accuracy) to a baseline model that is built using a set of metrics that capture the structural information of a code snippet, for explaining the likelihood of a code snippet being logged. Five to seven out of the top ten important metrics for determining the likelihood of a method being logged are our topic-based metrics. Our paper is the first work that studies the relationship between topics and logging decisions. Our findings show that source code related to certain topics is more likely to contain logging statements. Future log recommendation tools should consider topic information in order to help researchers and practitioners in deciding where to add logging statements. Paper Organization. Section 2 uses examples to motivate the study of software logging using topic models. Section 3 provides a brief background about topic models. Section 4 describes our case study setup. Section 5 presents the answers to our research questions. Section 6 discusses potential threats to the validity of our study. Section 7 surveys related work. Finally, Section 8 concludes the paper.
2 Motivation Examples In this section, we use several real-life examples to motivate our study of the relationship between code topics and logging. Table 1 lists ten JIRA issue reports of the Qpid-Java system that we fetched from the Apache JIRA issue repository2 . A closer examination of these ten issue reports shows that all these issue reports are concerned with logging in the context of “connections”. For example, issue report QPID-40383 proposes to log certain connection details (e.g., local and remote addresses) after each successful connection, as “it will provide useful information when trying to match client application behaviour with broker behaviour during incident analysis”. The developer fixed this issue by adding the required logging information. Listing 3 gives a code snippet that is part of the code fix4 for this issue. The code snippet shows that it is concerned with the topics that are related to “connections” (i.e., connection setting, connecting, get user ID, etc.). In fact, in RQ1 we found that “connection management” is one of the most log-intensive topics for the Qpid-Java system. From these examples, we observed that software practitioners tend to use logs to record certain functionalities (or topics), for example, “connections”. 2 3 4
https://issues.apache.org/jira https://issues.apache.org/jira/browse/QPID-4038 Qpid-Java git commit: d606368b92f3952f57dbabd8553b3b6f426305e1
Studying Software Logging Using Topic Models
5
Table 1 Examples of JIRA issues of the Qpid-Java system that are concerned with the logging of “connections”. Issue ID1
Issue report summary
QPID-4038
Log the connection number and associated local and remote address after each successful [re]connection Log the current connection state when connection establishment times out Add connection state logging on idle timeout to 0-10 connections Add the client version string to the connection establishment logging Support connection and user level logging Implement connections (CON) operational logging on 0-10 Add the client version to the connection open log messages Add connection and user info to log messages The client product is not logged in the connection open message The client version is only logged for 0-8/9/9-1 connections if a clientid is also set
QPID-7058 QPID-7079 QPID-3740 QPID-7539 QPID-2835 QPID-3816 QPID-7542 QPID-5266 QPID-5265 1
For more details about each issue, the readers can refer to its web link which is “https://issues.apache.org/jira/browse/” followed by the issue ID. For example, the link for the first issue is “https://issues.apache.org/jira/browse/QPID-4038”.
ConnectionSettings conSettings = retriveConnectionSettings(brokerDetail); _qpidConnection.setConnectionDelegate(new ClientConnectionDelegate(conSettings, _conn.getConnectionURL())); _qpidConnection.connect(conSettings); _conn.setConnected(true); _conn.setUsername(_qpidConnection.getUserID()); _conn.setMaximumChannelCount(_qpidConnection.getChannelMax()); _conn.getFailoverPolicy().attainedConnection(); + _conn.logConnected(_qpidConnection.getLocalAddress(), _qpidConnection.getRemoteAddress()); Listing 3 A code snippet that is part of the fix for issue QPID-4038, showing that a logging statement was added to a code snippet within the context of “connections”.
However, we cannot manually investigate all the topics that need logging. Therefore, in this paper, we propose to use topic modeling to understand the relationship between software logging and code topics in an automated fashion. Specifically, we want to study whether certain topics are more likely to be logged (RQ1). We also want to study whether there exist common topics that are similarly logged across systems (RQ2). Finally, we want to study whether topics can help explain the likelihood of a code snippet being logged (RQ3).
3 Topic Modeling In this section, we briefly discuss the background of latent Dirichlet allocation (LDA), which is the topic modeling approach that we used in our study. Our goal is to extract the functionality of a code snippet; however, such information is not readily available. Thus, we used the linguistic data in the
6
Heng Li et al.
Top words z1 thread, sleep, notify, interrupt z2 network, bandwidth, timeout z3 view, html, javascript, css (a) Topics (Z).
f1 f2 f3 f4
z1
z2
z3
0.2 0.0 0.6 1.0
0.8 0.8 0.0 0.0
0.0 0.2 0.4 0.0
(b) Topic memberships (θ).
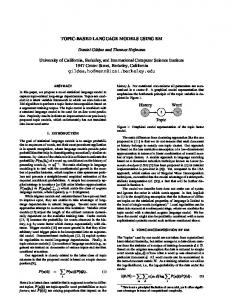
Fig. 1 An example result of topic models, where three topics are discovered from four files. (a) The three discovered topics (z1 , z2 , z3 ) are defined by their top (i.e., highest probable) words. (b) The four original source code files (f1 , f2 , f3 , f4 ) are represented by the topic membership vectors (e.g., {z1 = 0.2, z2 = 0.8, z3 = 0.0} for file f1 ).
source code files (i.e., the identifier names and comments) to extract topics of the code snippet in order to approximate the functionality in an automated and scalable fashion. We leveraged topic modeling approaches to derive topics (i.e., co-occurring words). Topic modeling approaches can automatically discover the underlying relationships among words in a corpus of documents (e.g., classes or methods in source code files), and group similar words together as topics. Unlike using words directly, topic models provide a higherlevel overview and interpretable labels of the documents in a corpus (Blei et al., 2003; Steyvers and Griffiths, 2007). In this paper, we used latent Dirichlet allocation (LDA) (Blei et al., 2003) to derive topics. LDA is a probabilistic topic model that is widely used in Software Engineering research for modeling topics in software repositories (Chen et al., 2016b). Moreover, LDA generated topics are less likely to overfit and are easier to interpret, in comparison to other topic models such as probabilistic latent semantic analysis (PLSA), and latent semantic analysis (LSA) (Blei et al., 2003). In LDA, a topic is a collection of frequently co-occurring words in the corpus. Given a corpus of n documents f1 , ..., fn , LDA automatically discovers a set Z of topics, Z = {z1 , ..., zK }, as well as the mapping θ between topics and documents (see Figure 1). The number of topics, K, is an input that controls the granularity of the topics. We use the notation θij to describe the topic membership value of topic zi in document fj . In a nutshell, LDA will generate two matrices – a topic-word matrix and a document-topic matrix. The topic-word matrix shows the most probable words in each topic, and the document-topic matrix shows the most probable topics in each document. Formally, each topic is defined by a probability distribution over all of the unique words in the corpus (e.g., all source code files). Given two Dirichlet priors (used for computing Dirichlet distributions), α and β, LDA will generate a topic distribution, called θj , for each file fj based on α, and generate a word distribution, called φi , for each topic zi based on β. We exclude the mathematical details of LDA since they are out of the scope of this paper. Interested readers may refer to the original paper on LDA (Blei et al., 2003) for the details.
Studying Software Logging Using Topic Models
7
Table 2 Overview of the studied systems. System Hadoop Directory-S. Qpid-Java CloudStack Camel Airavata
Release
LOC
Number of methods
Number of logged methods
Number of filtered methods
2.5.0 2.0.0-M20 6.0.0 4.8.0 2.17.0 0.15
1,194K 399K 476K 820K 1,342K 446K
42.7K 7.9K 20.0K 40.1K 41.1K 29.4K
2.9K (6.7%) 883 (11.2%) 1.3K (6.6%) 4.4K (10.9%) 2.9K (7.0%) 1.8K (6.1%)
25.6K 3.3K 13.1K 28.4K 21.4K 11.1K
Filtered logged methods 156 46 62 251 126 26
(0.6%) (1.4%) (0.5%) (0.9%) (0.6%) (0.2%)
Number of remaining methods
Remaining logged methods
17.1K 4.5K 6.9K 11.7K 19.8K 18.4K
2.7K (15.9%) 837 (18.4%) 1.2K (18.2%) 4.1K (35.1%) 2.7K (13.8%) 1.8K (9.6%)
4 Case Study Setup This section describes the studied systems and the process that we followed to prepare the data for our case study5 . 4.1 Studied Systems We performed a case study on six open source Java systems: Hadoop, DirectoryServer, Qpid-Java, CloudStack, Camel and Airavata (Table 2). The studied systems are large and successful systems across different domains with years of development. Hadoop is a distributed computing platform; Directory-Server is an embeddable directory server; Qpid-Java is a message broker; CloudStack is a cloud computing platform; Camel is a rule-based routing and mediation framework; and Airavata is a framework for executing and managing computational jobs and workflows on distributed computing resources. The Java source code of these systems uses standard logging libraries such as Log4j 6 , SLF4J 7 , and Commons Logging 8 . We excluded test files from our analysis, since we are interested in the logging practices in the main source code files of these systems, and we expect that logging practices will vary between main and test code. 4.2 Data Extraction Our goal is to study the relationship between logging decisions and the topics of the source code. We use topics to approximate the functionality of a code snippet. Therefore, we applied LDA at the granularity level of a source code method, since a method usually implements a relatively independent functionality. We did not apply LDA at the class level granularity because a class typically implements a mixture of functionalities. For example, a calculator class may implement input, internal calculation, and output functionalities. Figure 2 presents an overview of our data extraction approach. We fetched the source code files of the studied systems from their Git repositories. We used 5 6 7 8
We share our replication package online: http://sailhome.cs.queensu.ca/replication/LoggingTopicModel http://logging.apache.org/log4j http://www.slf4j.org https://commons.apache.org/logging
8
Heng Li et al.
Source code files
Extract methods
Methods
Remove small methods
Filtered methods
Remove logging statements Topics
LDA
Preprocessed methods
Preprocess
Logremoved methods
Fig. 2 An overview of our data extraction approach.
the Eclipse Java development tools (JDT9 ) to analyze the source code and extract all the methods. Small methods usually implement simple functionalities (e.g., getters and setters, or initialize fields of a class object). Intuitively, such methods are less likely to have logging statements. For example, 95% of the logged methods are among the top 40% (17.1K out of 42.7K) largest methods, while only 5% of the logged methods in the Hadoop system are among the rest 60% (25.6K out of 42.7K) of the methods. Moreover, topic models are known to perform poorly on short documents. Therefore, for each system, we filtered out the methods that are smaller, in terms of LOC, than a predefined threshold. We defined the threshold for each system as the LOC of the 5% smallest methods that contain a logging statement. The thresholds are 8, 8, 8, 5, 8 and 4 for Hadoop, Directory-Server, Qpid-Java, Camel, CloudStack and Airavata, respectively. Table 2 also shows the effect of our filtering process, i.e., the number of methods that are filtered and kept, as well as the portions of them being logged, respectively. Section 5 discusses the effect of such filtering on our modeling results. In order to study the relationship between logging decisions and the topics of methods, we removed all the logging statements from the logged methods before we performed the topic modeling. The use of standard logging libraries in these systems brings uniform formats (e.g., logger.error(message)) to the logging statements, thus we used a set of regular expressions to identify the logging statements. Finally, we preprocessed the log-removed methods and applied topic modeling on the preprocessed corpus of methods (see Section 4.3 “Source Code Preprocessing and LDA”).
4.3 Source Code Preprocessing and LDA In this subsection, we discuss our source code preprocessing approach, and how we apply LDA on the preprocessed source code. We extracted the linguistic data (i.e., identifier names, string literals, and comments) from the source code of each method, and tokenized the linguistic data into a set of words, similar to an approach that was proposed by Kuhn 9
http://www.eclipse.org/jdt
Studying Software Logging Using Topic Models
9
et al. (2007) and used in many prior studies (Chen et al., 2016b). With the set of words for each method, we applied common text preprocessing approaches such as removing English stop words (e.g., “a” and “the”) and stemming (e.g., from “interruption” to “interrupt”). We also removed programming language keywords (e.g., “catch” and “return”) from the set of words for each method. An open source implementation by Thomas (2012) eased our preprocessing of the source code. Finally, we applied LDA on both unigram (i.e., single word) and bigram (i.e., pairs of adjacent words) in each method, since including bigrams helps improve the assignments of words to topics and the creation of more meaningful topics (Brown et al., 1992). Running LDA requires specifying a number of parameters such as K, α, and β (as explained in Section 3), as well as the number of Gibbs sampling iterations (II) for computing the Dirichlet distributions (i.e., per-document topic distributions and per-topic word distributions). These LDA parameters directly affect the quality of the LDA generated topics. However, choosing the optimal parameters values can be a computational expensive task (Panichella et al., 2013), and such optimal values may vary across systems and tasks (Chang et al., 2009; Panichella et al., 2013; Wallach et al., 2009). As a result, we applied hyper-parameter optimization to automatically find the optimal α and β when applying LDA using the MALLET tool (McCallum, 2002). A prior study by Wallach et al. (2009) found that using optimized hyper-parameters can improve the quality of the derived topics. We also set the number of Gibbs sampling iterations II to a relatively large number (10,000) such that LDA can produce more stable topics (Binkley et al., 2014). We chose our K to be 500 when applying LDA on each studied system. As suggested by prior studies (Chen et al., 2016b; Wallach et al., 2009) using a larger K does not significantly affect the quality of LDA generated topics. The additional topics would have low topic membership values (i.e., noise topics), and can be filtered out. On the other hand, choosing a smaller K can be more problematic, since the topics cannot be separated precisely. We also tried other values of K in our study. However, we did not notice any significant differences in our findings (Section 6).
5 Case Study Results In this section, we present the results of our research questions. For each research question, we present the motivation behind the research question, the approach that we used to answer the research question, and our experimental results.
10
Heng Li et al.
RQ1: Which topics are more likely to be logged? Motivation In this research question, we study the relationship between topics in the source code and logging decisions. By studying this relationship, we can verify our intuition that the source code related to certain topics is more likely to contain logging statements. We are also interested in understanding which topics are more likely to contain logging statements. Since topics provide a high-level overview of a system, studying which topics are more likely to contain logging statements may provide insights about the logging practices in general. Approach We applied LDA on each of our studied systems separately to derive the topics for individual systems. In order to quantitatively measure how likely a topic is to be logged, we define the log density (LD) for a topic (zi ) as Pn j=1 θij ∗ LgN(mj ) . (1) LD(zi ) = Pn j=1 θij ∗ LOC(mj ) where LgN(mj ) is the number of logging statements of method mj , LOC(mj ) is the number of lines of code of method mj , n is the total number of source code methods, and θij is the topic membership of topic zi in method mj . A topic with a higher LD value is more likely to be logged. As the LD metric does not consider the popularity of a topic, i.e., how many times a topic is logged, we also follow the approach of prior studies (Chen et al., 2012, 2017b) and define a cumulative log density (CumLD) for a topic (zi ) as n X LgN(mj ) CumLD(zi ) = θij ∗ , (2) LOC(m j) j=1 A topic with a higher CumLD value is logged more often than a topic with a lower CumLD value. While the LD metric indicates the likelihood of a method of a particular topic being logged, the CumLD metric captures the overall relationship between a topic and logging. A topic might have a very high LD value, but there might only be a small number of methods that have a membership of such a topic; in contrast, such a topic would have a low CumLD value. Therefore, we consider both LD and CumLD metrics when we determine the top-log-density topics for detailed analysis. We define a topic as a log-intensive topic if the topic has both a high LD value and a high CumLD value. We analyzed the statistical distribution of the log density values for all 500 topics in each system, to verify the assumption that some topics are more likely to be logged than other topics. We also manually studied the topics that have the highest log density values, i.e., the log-intensive topics, to find out
Studying Software Logging Using Topic Models
11
Table 3 The five number summary and the skewness of the LD values of the 500 topics in each of the six studied systems. System
Min
1st Qu.
Median
3rd Qu.
Max.
Skewness
Hadoop Directory-S Qpid-Java Camel Cloudstack Airavata
0.00 0.00 0.00 0.00 0.00 0.00
0.01 0.00 0.00 0.01 0.02 0.00
0.01 0.01 0.01 0.01 0.03 0.01
0.02 0.02 0.01 0.02 0.04 0.02
0.07 0.10 0.06 0.10 0.14 0.16
0.98 2.10 1.72 1.61 0.88 2.32
Table 4 The five number summary and the skewness of the CumLD values of the 500 topics in each of the six studied systems. System
Min
1st Qu.
Median
3rd Qu.
Max.
Skewness
Hadoop Directory-S Qpid-Java Camel CloudStack Airavata
0.00 0.00 0.00 0.00 0.00 0.00
0.11 0.01 0.01 0.11 0.16 0.01
0.24 0.04 0.05 0.25 0.42 0.06
0.44 0.10 0.16 0.57 0.82 0.20
3.55 3.68 7.58 5.95 5.14 15.69
2.90 9.76 13.49 3.65 2.64 10.53
which topics are more likely to be logged. For each log-intensive topic, we not only analyzed the top words in this topic, but also investigated the methods that have the largest composition (i.e., large θ value) of the topic, as well as the context of the methods, to understand the meaning and context of that particular topic. Results A small number of topics are much more likely to be logged. Table 3 shows the five number summary and the skewness of the log density (LD) values of the 500 topics for each studied system. The LD distribution is always positively skewed in every studied system. Taking the Hadoop system as an example, the minimal LD value for a topic is 0.00, the inter-quantile-range (the range from the first quantile to the third quantile) ranges from 0.01 to 0.02, while the maximum LD value for a topic is 0.07. The LD distribution for the Hadoop system has a skewness of 0.98 (a skewness of 1 is considered highly skewed (Groeneveld and Meeden, 1984)). Other studied systems have similar or more skewed distributions of the LD values, i.e., skewness ranges from 0.88 to 2.32. The high positive skewness indicates that a small number of topics are much more likely to be logged than other topics. Table 4 shows the five number summary and the skewness of the cumulative log density (CumLD) values of the 500 topics for each studied system. The CumLD values also present a highly skewed distribution, i.e., with a skewness of 2.64 to 13.49. The high skewness of the CumLD values implies that a small number of topics are logged more often than other topics.
12
Heng Li et al.
Table 5 Top six log-intensive topics in each system. The listed topics have the highest LD values and highest CumLD values. A topic label is manually derived from the top words in each topic and its corresponding source code methods. We use underscores to concatenate words into bigrams. A topic label marked with a “∗” symbol or a “†” symbol indicates that the topic is concerned with communication between machines or interaction between threads, respectively. System
LD
CumLD
Top words
Topic label
Hadoop
0.07 0.05 0.05 0.04 0.04 0.04
1.32 3.55 1.04 1.85 2.31 1.07
attr, file, client, nfsstatu, handl thread, interrupt, except, interrupt except, sleep write, respons, verifi, repli, channel deleg, token, deleg token, number, sequenc event, handl, handler, event handler, handler handl command, shell, exec, executor, execut
network file system ∗ thread interruption † handling write request ∗ delegation tokens ∗ event handling † OS command execution †
Directory-S
0.09 0.08 0.08 0.08 0.06 0.06
0.48 0.78 0.84 0.41 2.17 3.68
statu, disconnect, connect, replic statu, replic target, target target, mojo, instal, command session, messag, session session, session write, write ldap, permiss, princip, permiss except, ldap permiss contain, decod except, except, decod, length close, debug, inherit, except, close except
connection management ∗ installer target session management ∗ LDAP1permission ∗ decoder exception cursor operation
Qpid-Java
0.06 0.06 0.05 0.05 0.05 0.05
7.58 0.73 1.15 1.21 0.66 0.78
except, messag, error, except except, occur activ, spec, endpoint, handler, factori connect, manag, manag connect, info, qpid resourc, except, resourc except, resourc adapt, adapt interv, heartbeat, setup interv, heartbeat interv, setup locat, transact manag, manag, transact, manag locat
message exception ∗ Qpid activation connection management ∗ JCA2 ∗ heartbeat3 ∗ transaction management
Camel
0.10 0.07 0.07 0.06 0.06 0.05
2.63 2.09 2.41 2.52 4.23 2.30
level, level level, info, warn, messag header, event, transact, event header, presenc agent interrupt, sleep, thread, reconnect, except file, gener, gener file, except, fail channel, close, channel channel, futur, disconnect send, messag, send messag, websocket, messag send
customized logging event header ∗ thread interruption † remote file operation ∗ channel operation ∗ sending message ∗
CloudStack
0.10 0.09 0.08 0.08 0.07 0.07
1.75 2.68 1.84 1.92 2.64 3.02
result, router, execut, control, root agent, host, attach, disconnect, transfer wait, except, timeout, interrupt, thread command, citrix, base, resourc base, citrix resourc context, context context, overrid context, overrid, manag host, hyper, hyper host, context, vmware
router operation ∗ agent connection ∗ thread interruption † citrix connection ∗ VM context operation host command request ∗
Airavata
0.16 0.13 0.10 0.09 0.09 0.08
9.21 15.69 2.14 1.40 1.85 2.63
object, overrid, object object, format, format object type, resourc, except, resourc type, registri channel, except, queue, connect, exchang except, client, airavata, airavata client, except airavata server, derbi, start, jdbc, except server, port, transport, except, server port
customized logging resource operation channel operation ∗ client connection ∗ server operation exception ∗ server operation ∗
1
Lightweight directory access protocol. Java EE Connector Architecture (JCA) is a solution for connecting application servers and enterprise information systems. 3 A heartbeat is a periodic signal sent between machines to indicate normal operations. 2
Most of the log-intensive topics in the studied systems can be generalized to topics that are concerned with communication between machines or interaction between threads. Table 5 list the top six log-intensive topics for each system. In order to ensure that the six topics for each system have both the highest LD and CumLD values, we used an iterative approach to get these topics. Initially, we chose the intersection of the six topics with the highest LD values and the six topics with the highest CumLD values. If the number of topics in the intersection set is less than six, we chose the intersection of the seven topics with the highest LD values and the seven topics with the highest CumLD values. We continued expanding our search scope until we got the top six log-intensive topics. By manually studying the log-intensive topics in the studied systems, we labeled the mean-
Studying Software Logging Using Topic Models
13
ing of each of these log-intensive topics in Table 5. 61% (22 out of 36) of the top log-intensive topics capture communication between machines, while 14% (5 out of 36) of the top log-intensive topics capture interactions between threads. We use a ∗ symbol in Table 5 to mark topics that are concerned with communication between machines, and use a † symbol in Table 5 to mark topics that are concerned with interactions between threads. For instance, the first log-intensive topic in the Directory-Server system, as well as the third log-intensive topic in the Qpid-Java system, are concerned with “connection management”. Developers tend to log the management operations, such as connecting, refreshing, closing, and information syncing, of a connection between two machines. As the communication process between two machines cannot be controlled or determined by a single machine, logging statements provide a way for developers, testers, or users to monitor the communication processes and provide rich information for debugging such processes. Similarly, the interaction between threads cannot be controlled by a single thread, thus developers may also use logging statements more often to track such interactions between threads. As an example, the second log-intensive topic in Hadoop is about “thread interruption”. Most top log-intensive topics only appear in one individual system, but a few topics emerge across systems. As we applied LDA on each studied system separately, it is not surprising that we generate mostly different topics for different systems, likewise for top log-intensive topics. For example, the first log-intensive topic in Hadoop is related to “network file system” (NFS). Developers use logging statements to track various operations on a network file system, such as creation, reading, writing and lookup. Although we know that such a topic is concerned with communication, the topic itself is not a general topic for all systems. Systems that do not use network file systems would not consider logging such a topic. Another example is the fourth log-intensive topic “LDAP permission” in Directory-Server. If a party is accessing a directory but it does not have the permission to access that particular directory, such a behavior would be logged as an error. Only the systems that use LDAP need to consider logging such a topic. However, a few topics do emerge across systems. For example, the second log-intensive topic in Hadoop, the third log-intensive topic in Camel and the third log-intensive topic in CouldStack are all concerned with “thread interruption”. For another example, the fifth log-intensive topic in Camel and the third log-intensive topic in Airavata are both related to “channel operation”. The findings motivate us to study how common topics (i.e., topics shared by multiple systems) are logged across different systems (see RQ2). Discussion Impact of choosing a different number of topics. In this RQ, we use LDA to identify 500 topics for each system and study the distribution of log density among these topics. We now explore how the choice of the number of topics impacts our analysis in this RQ. In this sub-section, we consider the
14
Heng Li et al.
Table 6 The five number summary and the skewness of the LD values of the topics in the Hadoop system. Number of topics
Min
1st Qu.
Median
3rd Qu.
Max.
Skewness
100 500 1,000
0.00 0.00 0.00
0.01 0.01 0.01
0.01 0.01 0.01
0.02 0.02 0.02
0.04 0.07 0.07
0.71 0.98 1.29
Table 7 The five number summary and the skewness of the CumLD values of the topics in the Hadoop system. Number of topics
Min
1st Qu.
Median
3rd Qu.
Max.
Skewness
100 500 1,000
0.30 0.00 0.00
0.87 0.11 0.02
1.37 0.24 0.08
2.35 0.44 0.23
8.66 3.55 3.56
1.99 2.90 4.21
Hadoop system as an example, and vary the number of topics between 100 and 1,000. Table 6 and Table 7 summarize the distributions of the LD values and the CumLD values for the Hadoop system when varying the number of topics. As we increase the number of topics, the skewness of the LD values and the skewness of the CumLD values both increase. This phenomenon can be explained by the intuition that using a larger number of topics can better distinguish log-intensive topics from other topics. However, both the LD values and the CumLD values still present highly positive-skewed distributions when we vary the number of topics, which supports our observation that a small number of topics are much more likely to be logged. Table 8 lists the top six log-intensive topics in the Hadoop system when choosing a different number of topics (i.e., 100, 500, and 1,000). The top logintensive topics do not remain the same when we vary the number of topics, because using different number of topics generates topics at different granularity. However, some topics, such as “thread interruption”, “event handling”, “network file system”, and “OS command execution”, do appear among the top log-intensive topics when varying the number of topics. We highlight these common topics in bold font in Table 8. Moreover, even when we vary the number of topics, most of the log-intensive topics are still about communication between machines or interaction between threads. We also have similar observations in the other studied systems. Relationship between topics and structural complexity. In this RQ, we found that a few topics are more likely to be logged than other topics. However, it is possible that these differences are related to the differences of the code structures. In this sub-section, we examine the relationship between the topics and the structural complexity of a method. We use McCabe’s cyclomatic complexity (McCabe, 1976) (CCN) to measure the structural complexity of a method. We define two metrics, topic diversity (TD) and topic-weighted log density (TWLD), to measure the diversity of topics in a method (i.e., cohesion) and the log density of a method which is
Studying Software Logging Using Topic Models
15
Table 8 Top six log-intensive topics in the Hadoop system, using different number of topics. A topic label marked with a “∗” symbol or a “†” symbol indicates that the topic is concerned with communication between machines or interaction between threads, respectively. The bold font highlights the common topics that appear among the top log-intensive topics when varying the number of topics. Number of topics
Top words
Topic label
100
thread, except, interrupt, interrupt except, wait servic, server, stop, start, handler event, event event, handl, event type, handler block, replica, datanod, pool, block block resourc, request, contain, prioriti, node contain, contain contain, statu, launch, contain statu
thread interruption † server operation ∗ event handling † work node operation ∗ resource allocation ∗ container allocation ∗
500
attr, file, client, nfsstatu, handl thread, interrupt, except, interrupt except, sleep write, respons, verifi, repli, channel deleg, token, deleg token, number, sequenc event, handl, handler, event handler, handler handl command, shell, exec, executor, execut
network file system ∗ thread interruption † handling write request ∗ delegation tokens ∗ event handling † OS command execution †
1000
attr, file, client, nfsstatu, handl bean, mbean, info, object, info bean node, path, node path, data, path node thread, interrupt, except, interrupt except, wait state, deleg, master, secret manag, manag command, shell, exec, exit, exit code
network file system ∗ bean object work node operation ∗ thread interruption † delegation tokens ∗ OS command execution †
inferred from its topics, respectively. The topic diversity, which is also called topic entropy (Hall et al., 2008; Misra et al., 2008), of a method is defined as PT TD(mj ) = − i=0 θij log2 θij , where θij is the membership of topic i in method j and T is the total number of topics. A larger topic diversity means that a method is more heterogeneous, while a smaller topic diversity means that a method is more coherent. The topic-weighted log density of a method j is defined as TWLD(mj ) = PT i=0 θij LDi,−j , where LDi,−j is the log density of topic i that is calculated from Equation 1 considering all the methods except for the method j. When calculating the TWLD value of a method, we excluded that particular method from Equation 1 to calculate the log density of topics, in order to avoid bias. A large TWLD value means that a method contains a large proportion of log-intensive topics. Figure 3 shows the pairwise Spearman rank correlation between cyclomatic complexity (CCN), topic diversity (TD), and topic-weighted log density (TWLD) of all the methods in our studied systems. We use the Spearman rank correlation because it is robust to non-normally distributed data (Swinscow et al., 2002). In fact, the Shapiro-Wilk normality test shows that the distributions of these three metrics are all statistically significantly different from a normal distribution (i.e., p-value < 0.05). Topic diversity and cyclomatic complexity have a positive correlation of 0.22 to 0.39 in the studied systems. In other words, more structurally complex methods tend to have more diverse topics, which matches prior findings (Liu et al., 2009b). On the other hand,
16
Heng Li et al. hadoop
CCN
directory−server
TWLD
TD
CCN
1
TWLD
qpid−java
TD
0.8
CCN
0.08 ***
1 ***
TWLD
0.27 ***
0.24 ***
1 ***
0.6
1 ***
0.15 ***
0.37 ***
1 ***
0.4
0.2
0.2
TWLD
0 −0.2
0.22 ***
1 ***
TD
−0.8
1 ***
CCN
1
1 ***
TWLD
0.21 ***
0.34 ***
0.16 ***
1 ***
0.6
1 ***
TWLD
TD
0.15 ***
0.39 ***
1 ***
−0.6 −0.8 −1
0 −0.2 −0.4
TD
−0.8
1 ***
−0.6 −0.8 −1
1
0.6
0.2
0.19 ***
1 ***
−0.4
TD
0.29 ***
1 ***
−0.6
0.4
TWLD
0.6
0.2
TWLD
−0.2
0.2
−0.2
0.22 ***
0.4
0
0.4
0
−0.15 ***
CCN
TWLD
TD
1 ***
0.09 ***
0.31 ***
0.8
CCN
1
airavata
0.8
CCN
1 ***
camel
TD
TD
−1
cloudstack
TWLD
TWLD
0.8
CCN
−0.4
−0.6
−1
CCN
0.6
0.4
−0.4
TD
CCN
1 0.8
CCN
0 −0.2
1 ***
−0.6 −0.8
0.6 0.4 0.2
TWLD
0.5 ***
1 ***
−0.4
TD
1 0.8
CCN
0 −0.2 −0.4
TD
1 ***
−1
−0.6 −0.8 −1
Fig. 3 Pairwise Spearman correlation between cyclomatic complexity (CCN), topic diversity (TD), and topic-weighted log density (TWLD). The symbols below the correlation values indicate the statistical significance of the respective correlation: o p ≥ 0.05; * p < 0.05; ** p < 0.01; *** p < 0.001.
the topic-weighted log density of a method has a very weak (-0.15 to 0.21) correlation (Swinscow et al., 2002) with the cyclomatic complexity of a method, which means that the log intensity of the topics is unlikely to be correlated with the cyclomatic complexity of the code. Therefore, even though structurally complex methods tend to have diverse topics, the logging information that is captured by these topics is not correlated with code complexity.
�
�
A small number of topics are more likely to be logged than other topics. Most of these log-intensive topics in the studied systems correspond to communication between machines or interaction between threads. Our findings encourage future work to develop topic-based logging guidelines (i.e., which topics need developers’ further attention for logging).
�
Studying Software Logging Using Topic Models
17
RQ2: Are common topics logged similarly across different systems? Motivation In RQ1, we applied LDA on each system separately and we got mostly different top log-intensive topics for different systems. However, we did find a few top log-intensive topics that emerge across different systems. Therefore, in this research question, we quantitatively study how common topics are logged across different systems. If common topics are similarly logged across different systems, we might be able to provide general suggestions on what topics should be logged across systems; otherwise, developers should make logging decisions based on the context of their individual system. Approach Cross-system topics. In order to precisely study the logged topics across different systems, we combined the methods of the studied systems together into one corpus, and applied LDA using K=3,000. We use 3,000 topics as we hope to identify topics that have the same granularity as the topics that we identified in RQ1 (i.e., 500 topics ∗ 6 systems). We used the same preprocessing and topic modeling approach as we had applied to individual systems in RQ1. We refer to the resulting topics as “cross-system topics”. With the cross-system topics, we firstly need to determine whether a topic exists in each studied system. If a topic exists in multiple systems, then this topic is common among multiple systems. Topic assignment in a system. We use the topic assignment to measure the total presence of a topic in a system. The assignment of a topic in a system is the sum of that topic’s memberships in all the methods of that system. A higher topic assignment means that a larger portion of the methods is related to the topic (Baldi et al., 2008b; Thomas et al., 2014). The assignment of topic zi in system sk is defined as A(zi , sk ) =
Nk X
θij ,
(3)
j=0
where Nk is the number of methods in system sk , and θij is the topic membership of topic zi in method mj . As different systems have different number of methods, it is unfair to compare the assignment of a topic in different systems. Therefore, we instead use a normalized definition of assignment: AN(zi , sk ) =
Nk X
θij /Nk ,
(4)
j=0
The normalized assignment values of all the topics sum up to 1 for each individual system. We refer to normalized assignment as “assignment” hereafter.
18
Heng Li et al.
0.9
0.50
0.25
0.00
696
0
1000
2000
0.9
0.75
0.50
0.25
0.00
3000
299
0.00 0
1.00
Cummulative assignment
Cummulative assignment
0.25
0.50
0.25
0.00
3000
2000
Number of topics
664
0
1000
0.75
0.50
0.25
3000
526
1000
3000
Airavata
● ● ● ● ● ● ● ● ● ● ● ● ● ● ● ● ● ● ● ● ● ● ● ● ● ● ● ● ● ● ● ● ● ● ● ● ● ● ● ● ● ● ● ● ● ● ● ● ● ● ● ● ● ● ● ● ● ● ● ● ● ● ● ● ● ● ● ● ● ● ● ● ● ● ● ● ● ● ● ● ● ● ● ● ● ● ● ● ● ● ● ● ● ● ● ● ● ● ● ● ● ● ● ● ● ● ● ● ● ● ● ● ● ● ● ● ● ● ● ● ● ● ● ● ● ● ● ● ● ● ● ● ● ● ● ● ● ● ● ● ● ● ● ● ● ● ● ● ● ● ● ● ● ● ● ● ● ● ● ● ● ● ● ● ● ● ● ● ● ● ● ● ● ● ● ● ● ● ● ● ● ● ● ● ● ● ● ● ● ● ● ● ● ● ● ● ● ● ● ● ● ● ● ● ● ● ● ● ● ● ● ● ● ● ● ● ● ● ● ● ● ● ● ● ● ● ● ● ● ● ● ● ● ● ● ● ● ● ● ● ● ● ● ● ● ● ● ● ● ● ● ● ● ● ● ● ● ● ● ● ● ● ● ● ● ● ● ● ● ● ● ● ● ● ● ● ● ● ● ● ● ● ● ● ● ● ● ● ● ● ● ● ● ● ● ● ● ● ● ● ● ● ● ● ● ● ● ● ● ● ● ● ● ● ● ● ● ● ● ● ● ● ● ● ● ● ● ● ● ● ● ● ● ● ● ● ● ● ● ● ● ● ● ● ● ● ● ● ● ● ● ● ● ● ● ● ● ● ● ● ● ● ● ● ● ● ● ● ● ● ● ● ● ● ● ● ● ● ● ● ● ● ● ● ● ● ● ● ● ● ● ● ● ● ● ● ● ● ● ● ● ● ● ● ● ● ● ● ● ● ● ● ● ● ● ● ● ● ● ● ● ● ● ● ● ● ● ● ● ● ● ● ● ● ● ● ● ● ● ● ● ● ● ● ● ● ● ● ● ● ● ● ● ● ● ● ● ● ● ● ● ● ● ● ● ● ● ● ● ● ● ● ● ● ● ● ● ● ● ● ● ● ● ● ● ● ● ● ● ● ● ● ● ● ● ● ● ●
0
2000
Number of topics
0.9
0.00 1000
2000
0.9
0.75
Cloudstack
● ● ● ● ● ● ● ● ● ● ● ● ● ● ● ● ● ● ● ● ● ● ● ● ● ● ● ● ● ● ● ● ● ● ● ● ● ● ● ● ● ● ● ● ● ● ● ● ● ● ● ● ● ● ● ● ● ● ● ● ● ● ● ● ● ● ● ● ● ● ● ● ● ● ● ● ● ● ● ● ● ● ● ● ● ● ● ● ● ● ● ● ● ● ● ● ● ● ● ● ● ● ● ● ● ● ● ● ● ● ● ● ● ● ● ● ● ● ● ● ● ● ● ● ● ● ● ● ● ● ● ● ● ● ● ● ● ● ● ● ● ● ● ● ● ● ● ● ● ● ● ● ● ● ● ● ● ● ● ● ● ● ● ● ● ● ● ● ● ● ● ● ● ● ● ● ● ● ● ● ● ● ● ● ● ● ● ● ● ● ● ● ● ● ● ● ● ● ● ● ● ● ● ● ● ● ● ● ● ● ● ● ● ● ● ● ● ● ● ● ● ● ● ● ● ● ● ● ● ● ● ● ● ● ● ● ● ● ● ● ● ● ● ● ● ● ● ● ● ● ● ● ● ● ● ● ● ● ● ● ● ● ● ● ● ● ● ● ● ● ● ● ● ● ● ● ● ● ● ● ● ● ● ● ● ● ● ● ● ● ● ● ● ● ● ● ● ● ● ● ● ● ● ● ● ● ● ● ● ● ● ● ● ● ● ● ● ● ● ● ● ● ● ● ● ● ● ● ● ● ● ● ● ● ● ● ● ● ● ● ● ● ● ● ● ● ● ● ● ● ● ● ● ● ● ● ● ● ● ● ● ● ● ● ● ● ● ● ● ● ● ● ● ● ● ● ● ● ● ● ● ● ● ● ● ● ● ● ● ● ● ● ● ● ● ● ● ● ● ● ● ● ● ● ● ● ● ● ● ● ● ● ● ● ● ● ● ● ● ● ● ● ● ● ● ● ● ● ● ● ● ● ● ● ● ● ● ● ● ● ● ● ● ● ● ● ● ● ● ● ● ● ● ● ● ● ● ● ● ● ● ● ● ● ● ● ● ● ● ● ● ● ● ● ● ● ● ● ● ● ● ● ● ● ● ● ● ● ● ● ● ● ● ● ● ● ● ● ● ●
0.9
0.50
1000
● ● ● ● ● ● ● ● ● ● ● ● ● ● ● ● ● ● ● ● ● ● ● ● ● ● ● ● ● ● ● ● ● ● ● ● ● ● ● ● ● ● ● ● ● ● ● ● ● ● ● ● ● ● ● ● ● ● ● ● ● ● ● ● ● ● ● ● ● ● ● ● ● ● ● ● ● ● ● ● ● ● ● ● ● ● ● ● ● ● ● ● ● ● ● ● ● ● ● ● ● ● ● ● ● ● ● ● ● ● ● ● ● ● ● ● ● ● ● ● ● ● ● ● ● ● ● ● ● ● ● ● ● ● ● ● ● ● ● ● ● ● ● ● ● ● ● ● ● ● ● ● ● ● ● ● ● ● ● ● ● ● ● ● ● ● ● ● ● ● ● ● ● ● ● ● ● ● ● ● ● ● ● ● ● ● ● ● ● ● ● ● ● ● ● ● ● ● ● ● ● ● ● ● ● ● ● ● ● ● ● ● ● ● ● ● ● ● ● ● ● ● ● ● ● ● ● ● ● ● ● ● ● ● ● ● ● ● ● ● ● ● ● ● ● ● ● ● ● ● ● ● ● ● ● ● ● ● ● ● ● ● ● ● ● ● ● ● ● ● ● ● ● ● ● ● ● ● ● ● ● ● ● ● ● ● ● ● ● ● ● ● ● ● ● ● ● ● ● ● ● ● ● ● ● ● ● ● ● ● ● ● ● ● ● ● ● ● ● ● ● ● ● ● ● ● ● ● ● ● ● ● ● ● ● ● ● ● ● ● ● ● ● ● ● ● ● ● ● ● ● ● ● ● ● ● ● ● ● ● ● ● ● ● ● ● ● ● ● ● ● ● ● ● ● ● ● ● ● ● ● ● ● ● ● ● ● ● ● ● ● ● ● ● ● ● ● ● ● ● ● ● ● ● ● ● ● ● ● ● ● ● ● ● ● ● ● ● ● ● ● ● ● ● ● ● ● ● ● ● ● ● ● ● ● ● ● ● ● ● ● ● ● ● ● ● ● ● ● ● ● ● ● ● ● ● ● ● ● ● ● ● ● ● ● ● ● ● ● ● ● ● ● ● ● ● ● ● ● ● ● ● ● ● ● ● ● ● ●
Number of topics
Directory−server
0.75
1.00
427
0
Number of topics
1.00
Camel
● ● ● ● ● ● ● ● ● ● ● ● ● ● ● ● ● ● ● ● ● ● ● ● ● ● ● ● ● ● ● ● ● ● ● ● ● ● ● ● ● ● ● ● ● ● ● ● ● ● ● ● ● ● ● ● ● ● ● ● ● ● ● ● ● ● ● ● ● ● ● ● ● ● ● ● ● ● ● ● ● ● ● ● ● ● ● ● ● ● ● ● ● ● ● ● ● ● ● ● ● ● ● ● ● ● ● ● ● ● ● ● ● ● ● ● ● ● ● ● ● ● ● ● ● ● ● ● ● ● ● ● ● ● ● ● ● ● ● ● ● ● ● ● ● ● ● ● ● ● ● ● ● ● ● ● ● ● ● ● ● ● ● ● ● ● ● ● ● ● ● ● ● ● ● ● ● ● ● ● ● ● ● ● ● ● ● ● ● ● ● ● ● ● ● ● ● ● ● ● ● ● ● ● ● ● ● ● ● ● ● ● ● ● ● ● ● ● ● ● ● ● ● ● ● ● ● ● ● ● ● ● ● ● ● ● ● ● ● ● ● ● ● ● ● ● ● ● ● ● ● ● ● ● ● ● ● ● ● ● ● ● ● ● ● ● ● ● ● ● ● ● ● ● ● ● ● ● ● ● ● ● ● ● ● ● ● ● ● ● ● ● ● ● ● ● ● ● ● ● ● ● ● ● ● ● ● ● ● ● ● ● ● ● ● ● ● ● ● ● ● ● ● ● ● ● ● ● ● ● ● ● ● ● ● ● ● ● ● ● ● ● ● ● ● ● ● ● ● ● ● ● ● ● ● ● ● ● ● ● ● ● ● ● ● ● ● ● ● ● ● ● ● ● ● ● ● ● ● ● ● ● ● ● ● ● ● ● ● ● ● ● ● ● ● ● ● ● ● ● ● ● ● ● ● ● ● ● ● ● ● ● ● ● ● ● ● ● ● ● ● ● ● ● ● ● ● ● ● ● ● ● ● ● ● ● ● ● ● ● ● ● ● ● ● ● ● ● ● ● ● ● ● ● ● ● ● ● ● ● ● ● ● ● ● ● ● ● ● ● ● ● ● ● ● ● ● ● ● ● ● ● ● ● ● ● ● ● ● ● ● ● ● ● ● ● ● ● ● ● ●
2000
Number of topics
3000
1.00
Cummulative assignment
0.75
1.00
Cummulative assignment
Cummulative assignment
Qpid−java
● ● ● ● ● ● ● ● ● ● ● ● ● ● ● ● ● ● ● ● ● ● ● ● ● ● ● ● ● ● ● ● ● ● ● ● ● ● ● ● ● ● ● ● ● ● ● ● ● ● ● ● ● ● ● ● ● ● ● ● ● ● ● ● ● ● ● ● ● ● ● ● ● ● ● ● ● ● ● ● ● ● ● ● ● ● ● ● ● ● ● ● ● ● ● ● ● ● ● ● ● ● ● ● ● ● ● ● ● ● ● ● ● ● ● ● ● ● ● ● ● ● ● ● ● ● ● ● ● ● ● ● ● ● ● ● ● ● ● ● ● ● ● ● ● ● ● ● ● ● ● ● ● ● ● ● ● ● ● ● ● ● ● ● ● ● ● ● ● ● ● ● ● ● ● ● ● ● ● ● ● ● ● ● ● ● ● ● ● ● ● ● ● ● ● ● ● ● ● ● ● ● ● ● ● ● ● ● ● ● ● ● ● ● ● ● ● ● ● ● ● ● ● ● ● ● ● ● ● ● ● ● ● ● ● ● ● ● ● ● ● ● ● ● ● ● ● ● ● ● ● ● ● ● ● ● ● ● ● ● ● ● ● ● ● ● ● ● ● ● ● ● ● ● ● ● ● ● ● ● ● ● ● ● ● ● ● ● ● ● ● ● ● ● ● ● ● ● ● ● ● ● ● ● ● ● ● ● ● ● ● ● ● ● ● ● ● ● ● ● ● ● ● ● ● ● ● ● ● ● ● ● ● ● ● ● ● ● ● ● ● ● ● ● ● ● ● ● ● ● ● ● ● ● ● ● ● ● ● ● ● ● ● ● ● ● ● ● ● ● ● ● ● ● ● ● ● ● ● ● ● ● ● ● ● ● ● ● ● ● ● ● ● ● ● ● ● ● ● ● ● ● ● ● ● ● ● ● ● ● ● ● ● ● ● ● ● ● ● ● ● ● ● ● ● ● ● ● ● ● ● ● ● ● ● ● ● ● ● ● ● ● ● ● ● ● ● ● ● ● ● ● ● ● ● ● ● ● ● ● ● ● ● ● ● ● ● ● ● ● ● ● ● ● ● ● ● ● ● ● ● ● ● ● ● ● ● ● ● ● ● ● ●
Cummulative assignment
Hadoop 1.00
● ● ● ● ● ● ● ● ● ● ● ● ● ● ● ● ● ● ● ● ● ● ● ● ● ● ● ● ● ● ● ● ● ● ● ● ● ● ● ● ● ● ● ● ● ● ● ● ● ● ● ● ● ● ● ● ● ● ● ● ● ● ● ● ● ● ● ● ● ● ● ● ● ● ● ● ● ● ● ● ● ● ● ● ● ● ● ● ● ● ● ● ● ● ● ● ● ● ● ● ● ● ● ● ● ● ● ● ● ● ● ● ● ● ● ● ● ● ● ● ● ● ● ● ● ● ● ● ● ● ● ● ● ● ● ● ● ● ● ● ● ● ● ● ● ● ● ● ● ● ● ● ● ● ● ● ● ● ● ● ● ● ● ● ● ● ● ● ● ● ● ● ● ● ● ● ● ● ● ● ● ● ● ● ● ● ● ● ● ● ● ● ● ● ● ● ● ● ● ● ● ● ● ● ● ● ● ● ● ● ● ● ● ● ● ● ● ● ● ● ● ● ● ● ● ● ● ● ● ● ● ● ● ● ● ● ● ● ● ● ● ● ● ● ● ● ● ● ● ● ● ● ● ● ● ● ● ● ● ● ● ● ● ● ● ● ● ● ● ● ● ● ● ● ● ● ● ● ● ● ● ● ● ● ● ● ● ● ● ● ● ● ● ● ● ● ● ● ● ● ● ● ● ● ● ● ● ● ● ● ● ● ● ● ● ● ● ● ● ● ● ● ● ● ● ● ● ● ● ● ● ● ● ● ● ● ● ● ● ● ● ● ● ● ● ● ● ● ● ● ● ● ● ● ● ● ● ● ● ● ● ● ● ● ● ● ● ● ● ● ● ● ● ● ● ● ● ● ● ● ● ● ● ● ● ● ● ● ● ● ● ● ● ● ● ● ● ● ● ● ● ● ● ● ● ● ● ● ● ● ● ● ● ● ● ● ● ● ● ● ● ● ● ● ● ● ● ● ● ● ● ● ● ● ● ● ● ● ● ● ● ● ● ● ● ● ● ● ● ● ● ● ● ● ● ● ● ● ● ● ● ● ● ● ● ● ● ● ● ● ● ● ● ● ● ● ● ● ● ● ● ● ● ● ● ● ● ● ● ● ● ●
0.9
0.75
0.50
0.25
●
208
0.00 0
1000
2000
3000
Number of topics
Fig. 4 The cumulative assignment of all the topics in each studied system. The topics are sorted by their assignments from high to low.
Common topics shared across systems. Figure 4 shows the cumulative assignments of all the topics in each system when sorting the topics by their assignments. For each system, a small portion of topics (208 to 696 out of 3,000 topics) account for 90% of the total assignment of each system. In other words, only a small portion of topics are significantly assigned in each system. For each system, we define its important topics as its most assigned topics that account for 90% of the total assignment of that particular system. For example, 696 out of 3,000 topics are important topics in the Hadoop system. We define a topic to be a common topic if the topic is important in multiple systems. For example, if a topic is important in two systems, then this topic is commonly shared between the two systems. If a topic is important in all the studied systems, then this topic is commonly shared across all the studied systems. Log density correlation. In order to study whether common topics are logged similarly across different systems, we measured the pairwise correlation of the log density of the common topics that are shared among different systems. Specifically, for each pair of systems, we first calculated their respective log density values for their common topics, so we calculate two sets of log density values for the same set of common topics. We then calculated the Spearman rank correlation between these two sets of log density values. A large correlation value indicates that the common topics are logged similarly across these two systems. As discussed in RQ1, the log density values of the topics have a skewed distribution. In fact, the Shapiro-Wilk test shows that
Studying Software Logging Using Topic Models
19
Table 9 Number of topics that are shared by N ∈ {1, 2, ..., 6} systems. # Systems
N =0
N =1
N =2
N =3
N =4
N =5
N =6
# Shared topics
1,359 (45%)
1,130 (38%)
203 (7%)
109 (4%)
77 (3%)
83 (3%)
39 (1%)
the distributions of the log density values are statistically significantly different from a normal distribution (i.e., p-value < 0.05). Therefore, we chose the Spearman rank correlation method because it is robust to non-normally distributed data (Swinscow et al., 2002). Prior studies also applied Spearman ranking correlation to measure similarity (e.g. Goshtasby, 2012). Results All the studied systems share a portion (i.e., 12% to 62%) of their topics with other systems. Table 9 lists the number of topics that are shared by N ∈ {1, 2, ..., 6} systems. Among all the 3,000 topics, around half (1,641) of them are important in at least one system, while the rest of them (1,359) are not important in any system. Around one-sixth (511 topics) of the topics are shared by at least two systems, among which only 39 topics are shared by all the six studies systems. Figure 5 lists the numbers of common topics that are shared between each pair of systems. For each system, Figure 5 also shows the percentage of its topics that are shared with each of the other systems. As shown in the figure, each studied system shares 12% to 62% of its topics with each of the other systems. In general, Hadoop and Camel share the most topics with other systems, possibly because they are platform or framework applications that contain many modules of various functionalities. In comparison, Airavata share the least topics with other systems. Specifically, Hadoop and Camel share the most topics (296) between them, while Directoryserver and Airavata share the least topics (51). The likelihood of logging the common topics has a statistically significant correlation of 0.35 to 0.62 among all the studied systems. Figure 6 shows the Spearman correlation of the log density between each pair of systems on their common topics. For each pair of systems, their log density values of the common topics have a statistically significant (i.e., pvalue < 0.05) correlation of 0.35 to 0.62. In other words, the likelihood of logging the common topics is statistically significantly correlated between each pair of the studied systems. The Hadoop system and the Cloudstack system have the largest log density correlation (0.62) on their common topics. As a distributed computing platform and a cloud computing platform, respectively, these two systems are likely to share similar logging needs for their common topics. The Qpid-Java system and the Airavata system have the smallest log density correlation (0.35) on their common topics. As a message broker and a framework for managing and executing computational jobs, respectively, these two systems are less likely to have similar logging needs.
20
Heng Li et al.
op do ha
hadoop
directory−server
696
169
er erv −s
ry cto ire
d
cloudstack
camel
airavata
ck sta
ud
clo
l me
ca
ata av air
169
239
233
296
83
(24%)
(34%)
(33%)
(43%)
(12%)
299
(57%)
qpid−java
a jav
id−
qp
239
140
(56%)
(33%)
140
130
164
51
(47%)
(43%)
(55%)
(17%)
427
233
130
185
(44%)
(25%)
(35%)
185
266
73
(43%)
(62%)
(17%)
526
296
164
266
227
(45%)
(25%)
(40%)
(34%)
227
71
(43%)
(13%)
664
80 (12%)
83
51
73
71
80
(40%)
(25%)
(35%)
(34%)
(38%)
208
Fig. 5 The number of topics that are shared between each pair of systems. The numbers in the diagonal cells show the number of important topics per system. The percentage values show the percentage of topics in the system indicated by the row name that are shared with the system indicated by the column name.
Discussion How do similar systems log common topics? In our case study, we chose six systems from different domains. We found that each system shares a portion (12% to 62%) of topics with other systems, and that the likelihood of logging the common topics is statistically significantly correlated among these systems. It is interesting to discuss how similar systems log their common topics. Therefore, we analyzed the common topics that are shared by two similar systems: Qpid-Java and ActiveMQ. Both systems are popular open source message brokers implemented in Java. Specifically, we added the ActiveMQ system into our cross-system topic modeling. We still set the number of topics to be 3,000, as we found that adding the new system into our cross-system topic modeling does not significantly change the number of important topics of the existing systems. Table 10 shows the number of common topics between these two systems and their log density correlation. As shown in the table, ActiveMQ has a wider range of topics than Qpid-Java. The former has 675 important topics while the later has 432 important topics. The larger number of important topics in ActiveMQ is likely because ActiveMQ is not only a message broker, but it
Studying Software Logging Using Topic Models
op do
ha
hadoop
0.5
tor ec dir
21
r rve se a y− jav id− qp
ck sta ud
clo
l me
ca
ata av air
0.47 ***
0.51 ***
0.62 ***
0.49 ***
0.42 ***
0.46
0.42 ***
0.43 ***
0.46 ***
0.53 ***
0.42
0.45 ***
0.39 ***
0.35 **
1 0.8
0.6
directory−server
qpid−java
0.4
0.2
0
cloudstack
0.48
0.46 ***
0.43 ***
camel
0.46
0.49 ***
−0.2
−0.4
airavata
0.44
−0.6
−0.8
−1
Fig. 6 The Spearman correlation of the log density of the common topics that are shared between each pair of systems. The values in the diagonal cells show the average log density correlation between each system and other systems on the shared topics. The symbols below the correlation values indicate the statistical significance of the respective correlation: o p ≥ 0.05; * p < 0.05; ** p < 0.01; *** p < 0.001.
also supports many other features such as enterprise integration patterns10 . These two systems share 294 common topics. The Qpid-Java system shares 68% (the largest percentage for each pair of systems) of its topics with the ActiveMQ system. The respective log density values of these common topics have a statistically significant correlation of 0.45, which is not the highest correlation value between each pair of systems. In summary, for similar systems such as Qpid-Java and ActiveMQ, they may share a relatively large portion of common topics; however, their likelihood of logging such common topics does not necessarily have a larger correlation than a pair of systems from different domains. Topics shared by all the studied systems. As shown in Table 9, there are only 39 topics that are commonly shared among all the studied systems. We measured each system’s log density for these 39 topics and calculated their pairwise Spearman correlations. The log density values of the studied systems have a statistically significant correlation of 0.38 to 0.70. In other words, the likelihood of logging these common topics is statistically correlated among all the studied systems. Table 11 also lists the six most log-intensive topics and 10
http://activemq.apache.org
22
Heng Li et al.
Table 10 Common topics between two similar systems: Qpid-Java and ActiveMQ. The symbols below a correlation value indicate the statistical significance of the correlation: *** p < 0.001. System Qpid-Java ActiveMQ
# Important topics
# Common topics
Log density correlation
432 675
294 (68%) 294 (44%)
0.45 ***
Table 11 The common topics that are shared by all of the six studied systems: The six most log-intensive topics and the six least log-intensive topics. A topic label marked with a “∗” symbol or a “†” symbol indicates that the topic is concerned with communication between machines or interaction between threads, respectively.
Most likely logged topics
Least likely logged topics
Top words
Topic label
stop, except, overrid, stop except, overrid stop, servic , except stop, shutdown, servic stop, stop servic except, except except, error, thrown, except thrown, param, occur, error occur, except error, thrown error host, host host, list host, find, host type, list, host list, host find, type host, find host connect, connect connect, except, except connect, connect except, close, connect close, creat connect, connect host, creat event, event event, handl, event type, type, event handler, handler, handler handl, overrid, event applic messag, messag messag, except, except messag, messag except, messag param, param messag, object messag, overrid, object
stopping server ∗ throwing exception finding host ∗ connection management ∗
hash, code, hash code, overrid, overrid hash, code result, prime, prime result, result prime, code hash equal, object, overrid, equal object, overrid equal, result equal, equal equal, object equal, equal type, type equal append, append append, builder, builder builder, overrid, builder append, overrid builder, length append, time append, type append system, println, system println, print, usag, except system, println system, exit, println usag, usag system index, index index, substr, start index, param, substr index, length, length index, size, list index node, node node, node list, list node, param node, type node, except node, node type, node param, param
hash coding equal operation
event handling † message exception ∗
string builder printing string indexing graph node management
the six least log-intensive topics among the 39 common topics. After manual analysis and labeling, we found that these two groups of topics have very distinguishable patterns. Most of the top-logged topics are concerned with communication between machines or interactions between threads, such as “stopping server” and “finding host”. In comparison, most of the least-logged topics are concerned with low-level data structure operations, such as “hash coding” and “string indexing”. Impact of choosing a different number of topics. In this RQ, we chose 3,000 topics for the cross-system topic modeling. We now examine whether our choice of the number of topics impacts our results. Using the Hadoop system as an example, Table 12 shows the cross-system topic modeling results when varying the number of topics from 3,000 to 2,000 and 1,000. As we decrease the number of topics from 3,000 to 1,000, the number of important topics for the Hadoop system also decreases from 696 to 384, at a lower decreasing ratio. The median number of common topics that are shared between Hadoop and other systems also decreases from 233 to 148. However, the percentage of the common topics increases from 33% to 39%. In other words, as we decrease the number of topics, the topics become more coarse-grained and they are more likely to be shared by multiple systems. Finally, the log density correlation of the common topics between the Hadoop system and other systems does not change significantly when we vary the number of topics from 3,000 to 1,000; in fact, the median correlation values remain around 0.5 and the correlations are always statistically significant while we vary the number of topics. Similar
Studying Software Logging Using Topic Models
23
Table 12 Cross-system topic modeling results when varying the number of topics, using the Hadoop system as an example. System
# Topics
# Important topics
Hadoop
3,000 2,000 1,000
696 584 384
# Common topics (median) 233 (33%) 213 (36%) 148 (39%)
Log density correlation (median) 0.49 0.45 0.53
observations also hold to the other studied systems. Overall, our results in this research question are not sensitive to the number of topics that is used in the cross-system topic modeling. � Each studied system shares a portion (12% to 62%) of its topics with other systems. The likelihood of logging the common topics has a statistically significant correlation of 0.35 to 0.62 among all the studied systems. Developers of a particular system can consult other systems when making their logging decisions or when developing logging guidelines. � � RQ3: Can topics provide additional explanatory power for the likelihood of a code snippet being logged? Motivation In RQ1, we observed that source code that is related to certain topics is more likely to be logged. In this RQ, we further studied the statistical relationship between topics and logging. We are interested in knowing whether our code topics can offer a different view of logging. Namely, we want to study whether adding topic-based metrics to a set of baseline metrics can provide additional explanatory power for the likelihood of a code snippet being logged. Approach To answer this research question, we built regression models to study the relationship between the topics in a method and the likelihood of a method being logged. The response variable of our regression models is a dichotomous variable that indicates whether a method should have a logging statement or not, and the explanatory variables are represented by a set of baseline metrics and topic-based metrics. The baseline metrics capture the structural information of a method, while the topic-based metrics capture the semantic information of a method. Baseline metrics. We used 14 baseline metrics, as listed in Table 13, to capture the structural information of a method. Prior studies (Fu et al., 2014; Yuan et al., 2012a; Zhu et al., 2015) found that the structure of a code snippet
24
Heng Li et al.
Table 13 Selected baseline metrics and the rationale behind the choices of these metrics. Metric LOC CCN NUM TRY
NUM CATCH
NUM THROW
NUM THROWS NUM IF
NUM ELSE
NUM SWITCH
NUM FOR
NUM WHILE
NUM RETURN
NUM METHOD
FANIN
Definition (d) — Rationale (r) d: Number of lines of code in a method. r: Large methods are likely to have more logging statements. d: McCabe’s cyclomatic complexity (McCabe, 1976) of a method. r: Complex methods are likely to have more logging statements. d: Number of try statements in a method. r: A try block indicates developers’ uncertainty about the execution outcome of code, thus developers tend to use logging statements for monitoring or debugging purposes. d: Number of catch clauses in a method. r: Exception catching code is often logged (Apache-Commons, 2016; Fu et al., 2014; Microsoft-MSDN, 2016; Yuan et al., 2012a; Zhu et al., 2015). d: Number of throw statements in a method. r: A logging statement is sometimes inserted right before a throw statement (Fu et al., 2014); developers also sometimes re-throw an exception instead of logging an exception. d: Number of throws clauses in a method declaration. r: Methods that throw exceptions are likely to have logging statements. d: Number of if statements in a method. r: Developers tend to log logic-branch points for understanding execution traces (Fu et al., 2014). d: Number of else clauses in a method. r: Developers tend to log logic-branch points for understanding execution traces (Fu et al., 2014). d: Number of switch statements in a method. r: Developers tend to log logic-branch points for understanding execution traces (Fu et al., 2014). d: Number of for statements in a method. r: Logging statements inside loops usually record the execution path or status of the loops. d: Number of while statements in a method. r: Logging statements inside loops usually record the execution path or status of the loops. d: Number of return statements in a method. r: More return statements indicates a more complex method (i.e., more possible execution outcomes); such a method is more likely to be logged for monitoring or debugging purposes. d: Number of method invocations in a method. r: Developers tend to check and log a return value from a method invocation (Fu et al., 2014). d: The number of classes that depend on (i.e., reference) the containing class of a method. r: High fan-in classes like libraries might have less logging statements to avoid the generation of too much logging.
exhibits a strong relation with its logging needs. Table 13 also briefly explains the rationale behind studying each of these baseline metrics. Topic-based metrics. The topic modeling results give us the membership (θ) assigned for each of the topics in each method. We consider the membership values that are assigned to the topics as the topic-based metrics, denoted by T0-T499. Prior studies also used similar topic-based metrics to predict or understand the relationship between topics and software defects (Chen et al., 2012; Nguyen et al., 2011). We filtered out topic membership values that are less than a threshold (we use 0.01 as the threshold) to remove noise topics for each method (Chen et al., 2012; Wallach et al., 2009).
Studying Software Logging Using Topic Models
25
Model construction. We built LASSO (least absolute shrinkage and selection operator (Tibshirani, 1996)) models to study the relationship between the explanatory metrics of a method and a response variable that indicates whether a method should have a logging statement or not. We use a LASSO model because it uses regularization to penalize a complex model that leads to over-fitting and it conducts feature selection simultaneously (Kuhn and Johnson, 2013; Tibshirani, 1996). An over-fitted model performs very well on the data on which the model was built, but usually has poor accuracy on a new data sample (Kuhn and Johnson, 2013). It is generally true that more complex models are more likely to lead to over-fitting (Kuhn and Johnson, 2013). The LASSO model uses a λ parameter to penalize the complexity of a model: the larger the λ value, the simpler the model (Tibshirani, 1996). Among the 500 topic-based metrics, many of them have little or no contribution for determining the logging likelihood of a method. A LASSO model, with a proper setting of the λ parameter, enables us to significantly reduce the number of variables in the model and reduce the possibility of over-fitting (Tibshirani, 1996). We used the stratified random sampling method (Kuhn and Johnson, 2013; Witten and Frank, 2005) to split the dataset of a system into 80% of training dataset and 20% of testing dataset, such that the distributions of logged methods and unlogged methods are properly reflected in both the training and testing datasets. We used the 80% training dataset to construct the model and tune the λ parameter, and left the 20% testing dataset only for testing purpose using the already tuned λ parameter. Similar “80%:20%” splitting approaches were also used by prior studies (Kuhn and Johnson, 2013; Martin et al., 2012). Splitting the dataset into distinct sets for model construction (including parameter tuning) and model evaluation ensures that we avoid over-fitting and that we provide an unbiased sense of model performance (Kuhn and Johnson, 2013). We used 10-fold cross validations to tune the λ value in a LASSO model, using only the training dataset. For each λ value, we used a 10-fold cross validation to measure the performance of the model (represented by AUC) using the λ value, and repeated for different λ values until we find a λ value with the best model performance. In this way, we got a LASSO model with the best cross-validated performance and we can avoid over-fitting. We used the “cv.glmnet” function in the “glmnet” R package (Friedman et al., 2010; Simon et al., 2011) to implement our model tuning process. Model evaluation. We used balanced accuracy (BA) as proposed by a prior study (Zhu et al., 2015) to evaluate the performance of our LASSO models. BA averages the probability of correctly identifying a logged method and the probability of correctly identifying a non-logged method. BA is widely used to evaluate the modeling results on imbalanced data (Cohen et al., 2004; Zhang et al., 2005; Zhu et al., 2015), since it avoids over optimism on imbalanced data sets. BA is calculated by Equation (5): BA =
TP 1 TN 1 × + × 2 TP + FN 2 FP + TN
(5)
26
Heng Li et al.
where TP, FP, FN and TN represent true positive, false positive, false negative and true negative, respectively. We also used the area under the ROC (receiver operating characteristic) curve (AUC) to evaluate the performance of the LASSO models. While the BA provides a balanced measure on our models’ accuracy in classifying logged methods and non-logged methods, the AUC evaluates our models’ ability of discrimination, i.e., how likely a model is able to correctly classify an actual logged method as a logged method, rather than classify an actual unlogged method as a logged method. The AUC is the area under the ROC curve which plots the true positive rate (T P/(T P + F N )) against false positive rate (F P/(F P + T N )). The AUC ranges between 0 and 1. A high value for the AUC indicates a classifier with a high discriminative ability; an AUC of 0.5 indicates a performance that is no better than random guessing. Evaluating the effect of the metrics on the model output. We evaluated the effect of the metrics (i.e., the explanatory variables) on the model output, i.e., the likelihood of a method being logged, by comparing the metrics’ standardized regression coefficients in the LASSO models. Standardized regression coefficients describe the expected change in the response variable (in standard deviation units) for a standard deviation change in a explanatory variable, while keeping the other explanatory variables fixed (Bring, 1994; Kabacoff, 2011). A positive coefficient means that a high value of that particular variable is associated with a higher probability of a method being logged, while a negative coefficient means that a high value of that particular variable is associated with a lower probability of a method being logged. For example, a topic-based metric with a positive coefficient means that a method with a greater membership of that particular topic has a higher chance to be logged. The standardized regression coefficients are not biased by the different scale of different variables in the model. In this work, we calculate the standardized regression coefficients by standardizing each of the explanatory variables to a mean of 0 and a standard deviation of 1, before feeding the data to the LASSO models. Results Table 14 shows the performance of the models that are built using the baseline metrics, and the models that are built using both the baseline and topicbased metrics. A high AUC indicates that our LASSO models are able to discriminate logged methods versus not-logged methods. A high BA implies that our LASSO models are able to provide accurate classification for the likelihood of a method being logged. The results highlight that developers are able to leverage a model to aid their logging decisions. Adding topic-based metrics to the baseline models gives a 3% to 13% improvement on AUC and a 6% to 16% improvement on BA for the LASSO models. In order to evaluate the statistical significance of adding the topic-based metrics to our baseline models, we used a Wilcoxon signed-rank test to compare the performance of the models that only use the
Studying Software Logging Using Topic Models
27
Table 14 Performance of the LASSO models, evaluated by AUC and BA. Project Hadoop Directory-Server Qpid-Java Camel CloudStack Airavata Cliff’s δ P-value (Wilcoxon)
Baseline metrics AUC BA 0.82 0.72 0.86 0.75 0.80 0.74 0.86 0.78 0.83 0.76 0.96 0.88 -
Baseline + Topics AUC BA 0.87 (+6%) 0.78 (+7%) 0.94 (+9%) 0.86 (+16%) 0.90 (+13%) 0.82 (+10%) 0.90 (+4%) 0.82 (+6%) 0.88 (+6%) 0.80 (+6%) 0.99 (+3%) 0.95 (+8%) 0.72 (large) 0.69 (large) 0.02 (sig.) 0.02 (sig.)
baseline metrics and the performance of the models that use both the baseline and topic-based metrics. The Wilcoxon signed-rank test is the non-parametric analogue to the paired t-test. We use the Wilcoxon signed-rank test instead of the paired t-test because the former does not assume a normal distribution of the compared data. We use a p-value that is below 0.05 to indicate that the alternative hypothesis (i.e., the performance change is statistically significant) is true. The test on the AUC values and the test on the BA values both result in a p-value of 0.02, which means that adding the topic-based metrics statistically significantly improves the performance of our LASSO models. We also computed Cliff’s δ effect size (Macbeth et al., 2011) to compare the performance of the models that only use the baseline metrics versus the performance of the models that use both the baseline metrics and the topic-based metrics. Cliff’s δ also has no assumption on the normality of the compared data. The magnitude of Cliff’s δ is assessed using the thresholds that are provided by Romano et al. (2006), i.e., δ < 0.147 “negligible”, δ < 0.33 “small”, δ < 0.474 “medium”, and δ >= 0.474 “large”. As shown in Table 14, the effect size of the AUC improvement is 0.72 (large), and the effect size of the BA improvement is 0.69 (large). Therefore, topic-related metrics provide additional explanatory power to the models that are built using the structural baseline metrics. In other words, topics can provide additional explanatory power for the likelihood of a method being logged. Both our baseline and topic-based metrics play important roles in determining the likelihood of a method being logged. Table 15 shows the top ten metrics for each LASSO model that uses both the baseline metrics and the topic-based metrics. These metrics are ordered by the absolute value of their corresponding standardized coefficients in the models. In each model, five to seven of the top ten important metrics for determining the likelihood of a method being logged are our topic-based metrics. The baseline metrics NUM TRY, NUM METHOD, and NUM CATCH have a strong relationship with the likelihood of a method being logged. Each of these three metrics appears at least four times in the top ten metrics and has a positive coefficient in the LASSO models for all studied systems. Developers tend to log try blocks as they are concerned about the uncertainty during the execution of try blocks; developers log method invocations as developers usu-
28
Heng Li et al.
Table 15 The top ten important metrics for determining the likelihood of a method being logged and their standardized coefficients. A letter “T” followed by a parenthesis indicates a topic-based metric and the manually derived topic label. A topic label followed by a ‡ symbol indicates that the particular topic is a log-intensive topic as listed in Table 5. Hadoop Metric NUM METHOD NUM CATCH T (prototype builder) CCN T (server protocal) NUM TRY NUM THROW T (client protocal) T (equal operation) T (string builder)
Directory-Server Coef 0.72 0.42 -0.31 0.28 -0.26 0.25 -0.22 -0.21 -0.15 -0.14
Metric NUM METHOD NUM TRY T (cursor operation ‡) T (decoder exception ‡) T (cursor exception) T (string builder) T (naming exception) FANIN T (state transition) T (tree operation)
Coef 1.13 0.29 0.28 -0.22 0.22 -0.17 -0.16 -0.15 -0.13 0.11
Metric NUM TRY NUM METHOD NUM CATCH T (search parameter) T (search entity) T (server response) T (legacy transaction) T (search criteria) NUM RETURN T (equal operation)
Camel Metric NUM METHOD NUM TRY NUM THROWS T (JSON schema) NUM CATCH NUM THROW T (string builder) T (model description) T (REST configuration) T (event handling) ‡
Qpid-Java Coef 0.73 0.58 0.43 0.31 -0.28 -0.24 -0.22 -0.18 -0.18 0.15
Metric T (message exception) ‡ LOC NUM RETURN T (list iteration) NUM IF T (connection management ‡) NUM CATCH T (object attribute) T (write flag) T (session management) ‡
Coef 0.80 0.62 0.44 -0.25 -0.25 -0.20 -0.16 -0.15 0.14 -0.14
Metric NUM TRY FANIN T (Thrift code - object reader) T (Thrift code - object writer) NUM THROWS NUM METHOD T (result validation) T (resource operation) ‡ T (customized logging) ‡ T (result transfer)
CloudStack
Coef 0.77 0.62 -0.54 -0.49 -0.26 0.25 0.25 -0.20 -0.19 0.17
Airavata Coef 2.09 -0.83 -0.69 -0.69 0.39 0.37 -0.33 0.31 0.23 0.17
ally need to check and record the return values of such method invocations; developers log catch blocks as a mean to handle exceptions for debugging purposes (Apache-Commons, 2016; Microsoft-MSDN, 2016). The baseline metrics NUM THROW, NUM THROWS and FANIN each appears twice in the top ten metrics. The NUM THROW metric has a negative coefficient in both of these two occurrences, indicating that developers tend not to throw an exception and log it at the same time; instead, they tend to log when they are catching an exception. In contrast, the NUM THROWS metric has a positive coefficient, showing that developers tend to add logging statements in methods that specify potential exceptions that might be thrown in that particular method or callee methods (with the latter case being more usual). The FANIN metric has a negative coefficient, indicating that high fan-in code tends to be associated with less logging statements, possibly for reducing logging overheads when called by other methods. Both the LOC and CNN metrics appear only once in the top ten metrics. The LOC metric has a positive coefficient, which is obvious as larger methods are more likely to require logging statements. The CCN metric also has a positive coefficient, indicating that developers tend to log complex methods which may need future debugging (Shang et al., 2015). The topic-based metrics play important roles in the LASSO models; in particular, the log-intensive topics have a strong and positive relationship with the likelihood of a method being logged. As shown in Table 15, we manually derived the topic label for each topic-based metric, by investigating the top words in the topic, the methods that have the largest
Studying Software Logging Using Topic Models
29
membership of the topic, and the containing classes of these methods. We use a ‡ symbol to mark the log-intensive metrics that we uncovered in RQ1. The metrics based on the log-intensive topics that are labeled as “cursor operation”, “decoder exception”, “message exception”, “session management”, “connection management”, “event handling”, “resource operation” and “customized logging”, have positive coefficients in the LASSO models, indicating that these topics have a positive relationship with the likelihood of a method being logged. In particular, the topic labeled as “message exception” has the strongest relationship with the likelihood of a method being logged in the Qpid-Java system. The topics that are labeled as “cursor operation” and “decoder exception”, also play the most important roles in determining the likelihood of a method being logged in the Directory-Server system. The “tree operation” topic in the Directory-Server system and the “result transfer” topic in the Airavata system also have a positive relationship with the likelihood of a method being logged. We found that the “tree operation” topic has an LD value of 0.03; and the “result transfer” topic has an LD value of 0.07. These two topics are also considered as log-intensive topics. Other topics that are listed in Table 15 have a negative relationship with the likelihood of a method being logged. These topics have an LD value of 0.00 to 0.01, which are much smaller than the log density values of the log-intensive topics (i.e., methods related to these topics most likely do not have any logging statements). Discussion Cross-system evaluation. In this research question, we evaluated the performance of our log recommendation models in a within-system setting. It is also interesting to study the performance of the models in a cross-system evaluation, i.e., train a model using one system (i.e., the training system) then use the trained model to predict the likelihood of logging a method in another system (i.e., the testing system). Like what we did in RQ2, we applied crosssystem topic modeling on a combined corpus of the six studied systems and set the number of topics to be 3,000. Then we derived topic-based metrics that are used as explanatory variables in our LASSO models. As discussed in RQ2, however, different systems have different sets of important topics. This issue poses a challenge to our cross-system evaluation, i.e., the training system and the testing system have different variable settings, which results in the poor performance of the cross-system models that leverage topic-based metrics. Even though we cannot fully overcome the fact that different systems have different sets of important topics which leads to the poor performance of crosssystem models, we took two strategies to alleviate the issue: – When training a LASSO model, we used the common topics between the training system and the testing system as our topic-based topics. We used the method mentioned in RQ2 to get the common topics of each pair of systems.
30
Heng Li et al.
Table 16 The performance (AUC) of the cross-system models using baseline metrics. The row names indicate the training systems and the column names indicate the testing systems. Hadoop Directory-Server Qpid-Java CloudStack Camel Airavata Average
Hadoop 0.74 0.60 0.78 0.80 0.74 0.73
Directory-Server 0.80 0.69 0.80 0.81 0.81 0.78
Qpid-Java 0.66 0.61 0.61 0.65 0.61 0.63
CloudStack 0.82 0.74 0.53 0.82 0.80 0.74
Camel 0.86 0.78 0.43 0.84 0.78 0.74
Airavata 0.88 0.91 0.61 0.93 0.90 0.85
Table 17 The performance (AUC) of the cross-system models using both baseline and topic-based metrics. The row names indicate the training systems and the column names indicate the testing systems. Hadoop Directory-Server Qpid-Java CloudStack Camel Airavata Average
Hadoop 0.78 0.74 0.79 0.82 0.74 0.77 (+5%)
Directory-Server 0.82 0.69 0.80 0.82 0.81 0.79 (+1%)
Qpid-Java 0.67 0.63 0.70 0.69 0.67 0.67 (+6%)
CloudStack 0.83 0.79 0.71 0.82 0.80 0.79 (+7%)
Camel 0.86 0.81 0.67 0.84 0.80 0.79 (+7%)
Airavata 0.90 0.92 0.82 0.90 0.90 0.89 (+5%)
– When training the LASSO model, we assigned more weight to the methods in the training system that have a larger membership of the important topics in the testing system. Specifically, for each method in the training system, we gave it a weight that is its total membership of all the important topics in the testing system. Tables 16 and 17 list the performance (AUC) of the cross-system models that use the baseline metrics and the performance (AUC) of the cross-system models that use both the baseline and topic-based metrics, respectively. For each system, we also calculated the average performance (AUC) of the models that were trained using other systems and tested on that particular system. The average AUC values increase by 1% to 7% when topic-based metrics are added to the baseline models. We also used a Wilcoxon singed-rank test and computed Cliff’s δ effect size to compare the average AUC values when using baseline metrics and when using both the baseline and topic-based metrics. The Wilcoxon signed-rank test got a p-value of 0.02, which indicates that the topic-based metrics bring statistically significant improvement to the baseline models. The Cliff’s δ effect size is 0.44, which means that the improvement is considered as “medium”. The effect of choosing a different number of topics. In this paper, we derived 500 topics from the source code of a software system and leveraged these topics to study the relationship between the topics of a method and the likelihood of a method being logged. In order to evaluate the impact of the choice of number of topics on our findings, we conducted a sensitivity analysis to quantitatively measure how the different number of topics influence the topic model’s ability to explain the likelihood of a code snippet being logged.
Studying Software Logging Using Topic Models
31
Table 18 Performance (AUC) of the LASSO models that leverage the baseline metrics and the topics-based metrics derived from different numbers of topics. Project Hadoop Directory-S. Qpid-Java Camel Cloudstack Airavata Cliff’s δ 1 1
Baseline 0.82 0.86 0.80 0.86 0.83 0.96 -
20 0.83 0.88 0.83 0.87 0.85 0.98 0.33M
50 0.84 0.87 0.85 0.88 0.86 0.99 0.44M
100 0.84 0.90 0.88 0.88 0.86 0.99 0.56L
Baseline + 20–3,000 topics 300 500 800 1,000 1,500 0.86 0.87 0.88 0.88 0.86 0.93 0.94 0.94 0.94 0.94 0.90 0.90 0.90 0.89 0.89 0.90 0.90 0.90 0.90 0.90 0.89 0.88 0.88 0.88 0.88 0.99 0.99 0.99 0.99 0.99 0.67L 0.72L 0.72L 0.72L 0.67L
2,000 0.86 0.93 0.89 0.90 0.87 0.98 0.67L
2,500 0.87 0.94 0.89 0.89 0.88 0.98 0.72L
3,000 0.86 0.93 0.89 0.90 0.88 0.99 0.67L
The superscripts S, M, and L represent small, medium, and large effect sizes, respectively.
Specifically, we changed the number of topics that we used in RQ3 from 500 to various numbers (i.e., from 20 to 3,000), and built LASSO models that leverage both the baseline metrics and the topic-based metrics. Table 18 shows the performance (evaluated using AUC) of these LASSO models that leverage the baseline metrics and the topic-based metrics that are derived from different number of topics. As we increase the number of topics from 20 to 3,000, the AUC values of the LASSO models increase until they reach a plateau. The AUC values of the LASSO models stay at or slightly fluctuate around the maximum point as we continue to increase the number of topics. Taking the Directory Server system for example, the AUC values of the LASSO models increase from 0.88 to 0.94 as we increase the number of topics from 20 to 500. However, as we continue to increase the number of topics, the AUC values stay around 0.94. As observed by Wallach et al. (2009), the reason may be that as the number of topics increases, the additional topics are rarely used in the topic assignment process. Thus, these additional topics are removed by the LASSO models. The AUC values reach their maximum points (highlighted in bold) when using 50 to 800 topics for the studied systems. In particular, four out of the six systems reach their maximum AUC values when using 300 topics or less. The LASSO models that leverage both the baseline metrics and topic-based metrics that are derived from 300 topics achieve an 3% to 13% improvement of AUC over the LASSO models that only leverage the baseline metrics. Table 18 also shows the Cliff’s δ effect sizes of comparing the performance of the models that only use the baseline metrics versus the performance of the models that use both the baseline metrics and the topic-based metrics. Using 20 or 50 topics improves the AUC of the baseline models with a medium effect size; using 100 or more topics improves the AUC of the baseline models with a large effect size. The impact of filtering out small methods. In this paper, we filtered out small methods for each studied system (Section 4.2), as intuitively small methods usually implement simple functionalities (e.g., getters and setters) and are less likely to need logging statements. We now examine the effect of filtering out small methods on our models. Table 19 shows the performance of the LASSO models without the filtering process. Without filtering out small methods, both the models that leverage baseline metrics and the models that
32
Heng Li et al.
Table 19 Performance of the LASSO models (without filtering out small methods), evaluated by AUC and BA. Project Hadoop Directory-Server Qpid-Java Camel CloudStack Airavata Cliff’s δ P-value (Wilcoxon)
Baseline metrics AUC BA 0.92 0.81 0.89 0.78 0.89 0.79 0.92 0.83 0.95 0.82 0.97 0.92 -
Baseline AUC 0.94 (+2%) 0.95 (+7%) 0.93 (+4%) 0.93 (+1%) 0.96 (+1%) 0.99 (+2%) 0.53 (large) 0.02 (sig.)
+ Topics BA 0.84 (+4%) 0.89 (+14%) 0.84 (+6%) 0.86 (+4%) 0.89 (+9%) 0.97 (+5%) 0.72 (large) 0.02 (sig.)
leverage baseline and topic-based metrics have better performance in terms of AUC and BA. Yet the topic-based metrics still bring a 1% to 7% improvement on AUC and a 4% to 14% improvement on BA, over the baseline metrics, for the LASSO models. The AUC improvement has an effect size of 0.53 (large) and the BA improvement has an effect size of 0.72 (large), both of which are statistically significant. However, the additional explanatory power (i.e., 1% to 7% improvement on AUC and 4% to 14% improvement on BA) is smaller than it is when a filtering process is applied (i.e., 3% to 13% improvement on AUC and 6% to 16% improvement on BA). These results can be explained by the fact that the filtered small methods are much less likely to have logging statements. Taking the Hadoop system for example, the filtered small methods make up 60% of all the methods, but they only contain 5% of all the logged methods. The structural metrics (e.g., LOC) can simply be used to predict such small methods as being not logged. In other words, topic-based metrics are less likely to bring additional explanatory power to the small methods. However, such methods are far less likely to be logged. � Our LASSO models that combine baseline metrics and topic-based metrics achieve an AUC of 0.87 to 0.99 and a BA of 0.78 to 0.95. The topic-based metrics provide an AUC improvement of 3% to 13% and a BA improvement of 6% to 16%, over the baseline metrics. The topics-based metrics play important roles in the LASSO models; in particular, the log-intensive topics have a strong and positive relationship with the likelihood of a method being logged. � � 6 Threats to Validity External Validity. Different systems are concerned with different topics. The discussions on the specific topics in this paper may not be generalized to other systems. Findings from additional case studies on other systems can benefit our study. However, through a case study on six systems that are of different domains and sizes, we expect that our general findings (i.e., the answers to the
Studying Software Logging Using Topic Models
33
research questions) can stand for other systems. We believe that developers can leverage the specific topics in their own systems to help understand and guide their logging decisions. Our study focused on the source code (i.e., production code) of the studied systems and excluded the testing code. We are more interested in the production code because the logging in the source code directly impacts the customer’s experience about the performance and diagnosability of a system. On the other hand, testing code is mainly used for in-house diagnosis, and the impact of logging is usually less of a concern. However, it is interesting to study the differences between the logging statements in the production code and the testing code. We expect future studies to explore the differences between production code logging and testing code logging. Internal Validity. The regression modeling results present the relation between the likelihood of a method being logged and a set of software metrics. The relation does not represent the casual effects of these metrics on the likelihood of a method being logged. In RQ3, we used 14 structural metrics to form the baseline of our models. The selected metrics do not necessarily represent all the structural information of a method. However, we used both the general information (e.g., LOC and CCN) and the detailed information (e.g., the number of if-statements and the number of catch blocks), trying to cover a large spectrum of structural information about a method. In this paper, we studied the relationship between logging decisions and the underlying topics in the software systems. Our study was based on the assumption that the logging practices of these projects are appropriate. However, the logging practices of these projects may not always be appropriate. In order to avoid learning bad practices, we chose several successful and widely-used open source systems. Construct Validity. Interpreting LDA-generated topics may not always be an easy task (Hindle et al., 2014), and the interpretation may be subjective. Thus, the first author of the paper tried to first understand the topics and derive topic labels, and the second author validated the labels. In case a topic that is hard to interpret, we study the source code (i.e., both classes and methods) that are related to the topic. As suggested by prior studies (Chen et al., 2016b; Wallach et al., 2009), we chose 500 topics for the topic modeling of individual systems in RQ1. However, determining the appropriate number of topics to be used in topic modeling is a subjective process. As our primary purpose of using topic models is for interpretation, the appropriateness of a choice of topic number should be determined by how one plans to leverage the resulting topics for interpreting the meaning of the source code. We found that using 500 topics for each studied system provides reasonable and tractable results for us to interpret the generated topics. Besides, we discuss how the different numbers of topics influence the observations of each RQ. When running LDA, we applied MALLET’s hyper-parameter optimization to automatically find the optimal α and β values. However, the optimization
34
Heng Li et al.
heuristics are designed for natural language documents instead of source code files. As the source code is different from natural language, we may not get the optimal topics. Future in-depth studies are needed to explore this wideranging concern across the multitude of uses of LDA on software data (Chen et al., 2016b). Topic models create automated topics that capture the co-occurrences of words in methods. However, one may be concerned about the rationale of studying the logging practices using topics instead of simply using the words that exist in a method. We use topics instead of words for two reasons: 1) topic models provide a higher-level overview and interpretable labels of a code snippet (Blei et al., 2003; Steyvers and Griffiths, 2007); 2) and using words in a code snippet to model the likelihood of a code snippet being logged is very computationally expensive and the resulting model is more likely to over-fit. Our experiments show that there are 2,117 to 5,474 different words (excluding English stop words and programming language keywords) in our studied systems, hence one would need to build a very expensive model (2,117 to 5,474 metrics) using these words. Our experiments also show that using 2,117 to 5,474 words as explanatory variables provides 3% to 10% (with a median of 4%) additional explanatory power (in terms of AUC) to the baseline models. In comparison, using only 300 topics as explanatory variables provides 3% to 13% (with a median of 6%) additional explanatory power to the baseline models.
7 Related Work In this section, we discuss two areas of prior studies that are related to our paper.
7.1 Software Logging Empirical studies of software logging. Researchers have performed empirical studies on various aspects of software logging practices, including where to log (Fu et al., 2014), log change behaviors (Kabinna et al., 2016; Li et al., 2017a; Yuan et al., 2012b), verbosity level of logging (Li et al., 2017b), log evolution (Shang et al., 2014), anti-patterns in the logging code (Chen and Jiang, 2017), and logging practices in industry (Fu et al., 2014; Pecchia et al., 2015). However, there exists no research that studies the relationship between logging decisions and the underlying topics behind the logged source code. Improving software logging. Prior research also proposed approaches to improve logging statements. Errlog (Yuan et al., 2012a) analyzes the source code to detect unlogged exceptions (abnormal or unusual conditions) and automatically insert the missing logging statements. A recent tool named LogAdvisor (Zhu et al., 2015) aims to provide developers with suggestions on where to log. LogAdvisor extracts contextual features (such as textual features) of a
Studying Software Logging Using Topic Models
35
code snippet and leverages the features to suggest whether a logging statement should be added to a code snippet. However, they only focus on the exception snippets and the return-value-check snippets which together cover 41% of the logging statements (Fu et al., 2014). The tool cannot suggest inserting logging statements outside the exception snippets and the return-value-check snippets, such as the logging statement in Listing 1. Their text features count the frequencies of each word that appear in a code snippet. In comparison, our topic-based metrics provide a better explanation of the semantic meanings of a code snippet. All these tools try to improve software logging by adding additional logged information or suggesting where to log. Based on our reported results in this paper, these tools should also consider the topics of a code snippet when providing logging suggestions.
7.2 Applying Topic Models on Software Engineering Tasks Topic models are widely used in the Software Engineering research for various tasks (Chen et al., 2016b; Sun et al., 2016), such as concept location (Cleary et al., 2008; Poshyvanyk et al., 2007; Rao and Kak, 2011), traceability linking (Asuncion et al., 2010), understanding software evolution (Hu et al., 2015; Thomas et al., 2011), code search (Tian et al., 2009), software refactoring (Bavota et al., 2014), and software maintenance (Sun et al., 2015a,b). Recent studies explored how to effectively leverage topic models in software engineering tasks (Panichella et al., 2013, 2016). However, there is no study of software logging using topic models (Chen et al., 2016b). Some prior studies (Chen et al., 2012; Nguyen et al., 2011) successfully show that topics in source code are correlated to some source code metrics (e.g., quality). Thus in this paper, we followed up on that intuition and we studied the relationship between code topics and logging decisions. Prior studies (De Lucia et al., 2012, 2014) also found that most LDAgenerated topics are easy for developers to understand, and these topics can be useful for developers to get a high-level overview of a system (Thomas et al., 2011). In this paper, we also conducted a manual study on the topics, and our study provides a high-level overview of which topics are more likely to need logging statements in our studied systems.
8 Conclusion Inserting logging statements in the source code appropriately is a challenging task, as both logging too much and logging too little are undesirable. We believe that the code snippets of different topics have different logging requirements. In this paper, we used LDA to extract the underlying topics from the source code, and studied the relationship between the logging decisions and the recovered topics. We found that a small number of topics, in particular, the topics that can be generalized to communication between machines or
36
Heng Li et al.
interaction between threads, are much more likely to be logged than other topics. We also found that the likelihood of logging the common topics has a significant correlation across all the studied systems, thus developers of a particular system can consult other systems when making their logging decisions or developing logging guidelines. Finally, we leveraged the recovered topics in regression models to provide additional explanatory power for the likelihood of a method being logged. Our case study on six open source software systems suggests that topics can statistically help explain the likelihood of a method being logged. As code topics contain valuable information that is correlated with logging decisions, topic information should be considered in the logging practices of practitioners when they wish to allocate limited logging resources (e.g., by allocating more logging resources to log-intensive topics). Future work on logging recommendation tools should also consider topic information in order to help software practitioners make more informed logging decisions. Furthermore, our findings encourage future work to develop topic-influenced logging guidelines (e.g., which topics need further logging). This work suggests that there is a strong relationship between the topics of a code snippet and the likelihood of a code snippet containing logging statements. As different log levels (e.g., “debug” or “warning”) indicate different logging purposes (e.g., for debugging or for revealing problems), we also encourage future work to study the relationship between code topics and different log levels (i.e., different logging purposes).
References Apache-Commons (2016). Best practices - logging exceptions. https: //commons.apache.org/logging/guide.html. Asuncion, H. U., Asuncion, A. U., and Taylor, R. N. (2010). Software traceability with topic modeling. In Proceedings of the 32nd International Conference on Software Engineering, ICSE ’10, pages 95–104. Baldi, P. F., Lopes, C. V., Linstead, E. J., and Bajracharya, S. K. (2008a). A theory of aspects as latent topics. In Proceedings of the 23rd ACM SIGPLAN Conference on Object-oriented Programming Systems Languages and Applications, OOPSLA ’08, pages 543–562. Baldi, P. F., Lopes, C. V., Linstead, E. J., and Bajracharya, S. K. (2008b). A theory of aspects as latent topics. In ACM Sigplan Notices, volume 43, pages 543–562. ACM. Bavota, G., Oliveto, R., Gethers, M., Poshyvanyk, D., and Lucia, A. D. (2014). Methodbook: Recommending move method refactorings via relational topic models. IEEE Transactions on Software Engineering, 40(7), 671–694. Binkley, D., Heinz, D., Lawrie, D., and Overfelt, J. (2014). Understanding LDA in source code analysis. In Proceedings of the 22Nd International Conference on Program Comprehension, pages 26–36.
Studying Software Logging Using Topic Models
37
Blei, D. M., Ng, A. Y., and Jordan, M. I. (2003). Latent Dirichlet allocation. Journal of Machine Learning Research, 3, 993–1022. Bring, J. (1994). How to standardize regression coefficients. The American Statistician, 48(3), 209–213. Brown, P. F., deSouza, P. V., Mercer, R. L., Pietra, V. J. D., and Lai, J. C. (1992). Class-based n-gram models of natural language. Computational Linguistics, 18, 467–479. Chang, J., Gerrish, S., Wang, C., Boyd-graber, J. L., and Blei, D. M. (2009). Reading tea leaves: How humans interpret topic models. In Advances in Neural Information Processing Systems 22 , pages 288–296. Chen, B. and Jiang, Z. M. (2017). Characterizing and detecting anti-patterns in the logging code. In Proceedings of the 39th International Conference on Software Engineering, ICSE ’17, pages 71–81. Chen, T.-H., Thomas, S. W., Nagappan, M., and Hassan, A. (2012). Explaining software defects using topic models. In Proceedings of the 9th Working Conference on Mining Software Repositories, MSR ’12, pages 189–198. Chen, T.-H., Shang, W., Hassan, A. E., Nasser, M., and Flora, P. (2016a). Cacheoptimizer: Helping developers configure caching frameworks for hibernate-based database-centric web applications. In Proceedings of the 24th ACM SIGSOFT International Symposium on Foundations of Software Engineering, FSE ’16, pages 666–677. Chen, T.-H., Thomas, S. W., and Hassan, A. E. (2016b). A survey on the use of topic models when mining software repositories. Empirical Software Engineering, 21(5), 1843–1919. Chen, T.-H., Syer, M. D., Shang, W., Jiang, Z. M., Hassan, A. E., Nasser, M., and Flora, P. (2017a). Analytics-driven load testing: An industrial experience report on load testing of large-scale systems. In Proceedings of the 39th International Conference on Software Engineering: Software Engineering in Practice Track , ICSE-SEIP ’17, pages 243–252. Chen, T.-H., Shang, W., Nagappan, M., Hassan, A. E., and Thomas, S. W. (2017b). Topic-based software defect explanation. Journal of Systems and Software, 129, 79–106. Cleary, B., Exton, C., Buckley, J., and English, M. (2008). An empirical analysis of information retrieval based concept location techniques in software comprehension. Empirical Software Engineering, 14(1), 93–130. Cohen, I., Goldszmidt, M., Kelly, T., Symons, J., and Chase, J. S. (2004). Correlating instrumentation data to system states: A building block for automated diagnosis and control. In Proceedings of the 6th Conference on Symposium on Opearting Systems Design & Implementation, pages 16–16. De Lucia, A., Di Penta, M., Oliveto, R., Panichella, A., and Panichella, S. (2012). Using IR methods for labeling source code artifacts: Is it worthwhile? In Proceedings of the 20th International Conference on Program Comprehension, ICPC ’12, pages 193–202. De Lucia, A., Di Penta, M., Oliveto, R., Panichella, A., and Panichella, S. (2014). Labeling source code with information retrieval methods: an empirical study. Empirical Software Engineering, pages 1–38.
38
Heng Li et al.
Friedman, J., Hastie, T., and Tibshirani, R. (2010). Regularization paths for generalized linear models via coordinate descent. Journal of Statistical Software, 33(1), 1–22. Fu, Q., Zhu, J., Hu, W., Lou, J.-G., Ding, R., Lin, Q., Zhang, D., and Xie, T. (2014). Where do developers log? an empirical study on logging practices in industry. In Companion Proceedings of the 36th International Conference on Software Engineering, ICSE Companion ’14, pages 24–33. Goshtasby, A. A. (2012). Similarity and dissimilarity measures. In Image Registration: Principles, Tools and Methods, pages 7–66. Springer London, London. Groeneveld, R. A. and Meeden, G. (1984). Measuring Skewness and Kurtosis. Journal of the Royal Statistical Society. Series D (The Statistician), 33(4). Hall, D., Jurafsky, D., and Manning, C. D. (2008). Studying the history of ideas using topic models. In Proceedings of the 2008 conference on empirical methods in natural language processing, EMNLP ’08, pages 363–371. Association for Computational Linguistics. Hindle, A., Bird, C., Zimmermann, T., and Nagappan, N. (2014). Do topics make sense to managers and developers? Empirical Software Engineering. Hu, J., Sun, X., Lo, D., and Li, B. (2015). Modeling the evolution of development topics using dynamic topic models. In Proceedings of the 22nd IEEE International Conference on Software Analysis, Evolution, and Reengineering, SANER’ 15, pages 3–12. Kabacoff, R. (2011). R in Action. Manning Publications Co. Kabinna, S., Bezemer, C.-P., Hassan, A. E., and Shang, W. (2016). Examining the stability of logging statements. In Proceedings of the 23rd IEEE International Conference on Software Analysis, Evolution, and Reengineering, SANER ’16. Kuhn, A., Ducasse, S., and G´ırba, T. (2007). Semantic clustering: Identifying topics in source code. Information and Software Technology, 49, 230–243. Kuhn, M. and Johnson, K. (2013). Applied predictive modeling. Springer. Lal, S. and Sureka, A. (2016). Logopt: Static feature extraction from source code for automated catch block logging prediction. In Proceedings of the 9th India Software Engineering Conference, ISEC ’16, pages 151–155. Li, H., Shang, W., Zou, Y., and Hassan, A. E. (2017a). Towards just-in-time suggestions for log changes. Empirical Software Engineering, 22(4), 1831– 1865. Li, H., Shang, W., and Hassan, A. E. (2017b). Which log level should developers choose for a new logging statement? Empirical Software Engineering, 22(4), 1684–1716. Linstead, E., Lopes, C., and Baldi, P. (2008). An application of latent Dirichlet allocation to analyzing software evolution. In Proceedings of Seventh International Conference on Machine Learning and Applications, ICMLA ’12, pages 813–818. Liu, Y., Poshyvanyk, D., Ferenc, R., Gyimothy, T., and Chrisochoides, N. (2009a). Modeling class cohesion as mixtures of latent topics. In Proceedings of the 25th International Conference on Software Maintenance, ICSE ’09,
Studying Software Logging Using Topic Models
39
pages 233 –242. Liu, Y., Poshyvanyk, D., Ferenc, R., Gyimothy, T., and Chrisochoides, N. (2009b). Modeling class cohesion as mixtures of latent topics. In Proceedings of the 25th IEEE International Conference on Software Maintenance, ICSM ’09, pages 233–242. Macbeth, G., Razumiejczyk, E., and Ledesma, R. D. (2011). Cliff’s delta calculator: A non-parametric effect size program for two groups of observations. Universitas Psychologica, 10(2), 545–555. Mariani, L. and Pastore, F. (2008). Automated identification of failure causes in system logs. In Proceedings of the 2008 19th International Symposium on Software Reliability Engineering, pages 117–126. Martin, T. M., Harten, P., Young, D. M., Muratov, E. N., Golbraikh, A., Zhu, H., and Tropsha, A. (2012). Does rational selection of training and test sets improve the outcome of qsar modeling? Journal of chemical information and modeling, 52(10), 2570–2578. Maskeri, G., Sarkar, S., and Heafield, K. (2008). Mining business topics in source code using latent Dirichlet allocation. In Proceedings of the 1st India Software Engineering Conference, pages 113–120. McCabe, T. J. (1976). A complexity measure. IEEE Transactions on software Engineering, (4), 308–320. McCallum, A. K. (2002). Mallet: A machine learning for language toolkit. Microsoft-MSDN (2016). Logging an exception. https://msdn.microsoft. com/en-us/library/ff664711(v=pandp.50).aspx. Misra, H., Capp´e, O., and Yvon, F. (2008). Using lda to detect semantically incoherent documents. In Proceedings of the 12th Conference on Computational Natural Language Learning, CoNLL ’08, pages 41–48. Association for Computational Linguistics. Nguyen, T. T., Nguyen, T. N., and Phuong, T. M. (2011). Topic-based defect prediction. In Proceedings of the 33rd International Conference on Software Engineering, ICSE ’11, pages 932–935. Oliner, A., Ganapathi, A., and Xu, W. (2012). Advances and challenges in log analysis. Communications of the ACM , 55(2), 55–61. Panichella, A., Dit, B., Oliveto, R., Di Penta, M., Poshyvanyk, D., and De Lucia, A. (2013). How to effectively use topic models for software engineering tasks? an approach based on genetic algorithms. In Proceedings of the 2013 International Conference on Software Engineering, ICSE ’13, pages 522– 531. Panichella, A., Dit, B., Oliveto, R., Di Penta, M., Poshyvanyk, D., and De Lucia, A. (2016). Parameterizing and assembling ir-based solutions for se tasks using genetic algorithms. In Proceedings of the 23rd IEEE International Conference on Software Analysis, Evolution, and Reengineering, SANER ’16. Pecchia, A., Cinque, M., Carrozza, G., and Cotroneo, D. (2015). Industry practices and event logging: Assessment of a critical software development process. In Proceedings of the 37th International Conference on Software Engineering, ICSE ’15, pages 169–178.
40
Heng Li et al.
Poshyvanyk, D., Gueheneuc, Y., Marcus, A., Antoniol, G., and Rajlich, V. (2007). Feature location using probabilistic ranking of methods based on execution scenarios and information retrieval. IEEE Trans. on Software Engineering, pages 420–432. Rao, S. and Kak, A. (2011). Retrieval from software libraries for bug localization: A comparative study of generic and composite text models. In Proceeding of the 8th Working Conference on Mining Software Repositories, MSR ’11, pages 43–52. Romano, J., Kromrey, J. D., Coraggio, J., and Skowronek, J. (2006). Appropriate statistics for ordinal level data: Should we really be using t-test and cohensd for evaluating group differences on the nsse and other surveys. In annual meeting of the Florida Association of Institutional Research, pages 1–33. Shang, W., Jiang, Z. M., Adams, B., Hassan, A. E., Godfrey, M. W., Nasser, M., and Flora, P. (2014). An exploratory study of the evolution of communicated information about the execution of large software systems. Journal of Software: Evolution and Process, 26(1), 3–26. Shang, W., Nagappan, M., and Hassan, A. E. (2015). Studying the relationship between logging characteristics and the code quality of platform software. Empirical Software Engineering, 20(1), 1–27. Simon, N., Friedman, J., Hastie, T., and Tibshirani, R. (2011). Regularization paths for cox’s proportional hazards model via coordinate descent. Journal of Statistical Software, 39(5), 1–13. Steyvers, M. and Griffiths, T. (2007). Probabilistic topic models. Handbook of latent semantic analysis, 427(7), 424–440. Sun, X., Li, B., Leung, H., Li, B., and Li, Y. (2015a). Msr4sm: Using topic models to effectively mining software repositories for software maintenance tasks. Information and Software Technology, 66, 1–12. Sun, X., Li, B., Li, Y., and Chen, Y. (2015b). What information in software historical repositories do we need to support software maintenance tasks? an approach based on topic model. In Computer and Information Science, pages 27–37. Springer International Publishing, Cham. Sun, X., Liu, X., Li, B., Duan, Y., Yang, H., and Hu, J. (2016). Exploring topic models in software engineering data analysis: A survey. In Proceedings of the 17th IEEE/ACIS International Conference on Software Engineering, Artificial Intelligence, Networking and Parallel/Distributed Computing, SNPD’ 16, pages 357–362. Swinscow, T. D. V., Campbell, M. J., et al. (2002). Statistics at Square One. BMJ, London. Syer, M. D., Jiang, Z. M., Nagappan, M., Hassan, A. E., Nasser, M., and Flora, P. (2013). Leveraging performance counters and execution logs to diagnose memory-related performance issues. In Proceedings of the 29th IEEE International Conference on Software Maintenance, ICSM 13’, pages 110–119. Thomas, S., Adams, B., Hassan, A. E., and Blostein, D. (2010). Validating the use of topic models for software evolution. In Proceedings of the 10th Inter-
Studying Software Logging Using Topic Models
41
national Working Conference on Source Code Analysis and Manipulation, SCAM ’10, pages 55–64. Thomas, S. W. (2012). A lightweight source code preprocesser. https:// github.com/doofuslarge/lscp. Thomas, S. W., Adams, B., Hassan, A. E., and Blostein, D. (2011). Modeling the evolution of topics in source code histories. In Proceedings of the 8th Working Conference on Mining Software Repositories, pages 173–182. Thomas, S. W., Adams, B., Hassan, A. E., and Blostein, D. (2014). Studying software evolution using topic models. Science of Computer Programming, 80, 457–479. Tian, K., Revelle, M., and Poshyvanyk, D. (2009). Using latent Dirichlet allocation for automatic categorization of software. In Proceedings of the 6th International Working Conference on Mining Software Repositories, MSR ’09, pages 163–166. Tibshirani, R. (1996). Regression shrinkage and selection via the lasso. Journal of the Royal Statistical Society. Series B (Methodological), pages 267–288. Wallach, H. M., Mimno, D. M., and McCallum, A. (2009). Rethinking lda: Why priors matter. In Advances in neural information processing systems, NIPS ’09, pages 1973–1981. Witten, I. H. and Frank, E. (2005). Data Mining: Practical machine learning tools and techniques. Morgan Kaufmann. Xu, W., Huang, L., Fox, A., Patterson, D., and Jordan, M. I. (2009). Detecting large-scale system problems by mining console logs. In Proceedings of the ACM SIGOPS 22Nd Symposium on Operating Systems Principles, SOSP ’09, pages 117–132. Yuan, D., Mai, H., Xiong, W., Tan, L., Zhou, Y., and Pasupathy, S. (2010). Sherlog: Error diagnosis by connecting clues from run-time logs. SIGARCH Computer Architecture News, 38(1), 143–154. Yuan, D., Zheng, J., Park, S., Zhou, Y., and Savage, S. (2011). Improving software diagnosability via log enhancement. In Proceedings of the Sixteenth International Conference on Architectural Support for Programming Languages and Operating Systems, ASPLOS ’11, pages 3–14. Yuan, D., Park, S., Huang, P., Liu, Y., Lee, M. M., Tang, X., Zhou, Y., and Savage, S. (2012a). Be conservative: Enhancing failure diagnosis with proactive logging. In Proceedings of the 10th USENIX Conference on Operating Systems Design and Implementation, OSDI’12, pages 293–306. Yuan, D., Park, S., and Zhou, Y. (2012b). Characterizing logging practices in open-source software. In Proceedings of the 34th International Conference on Software Engineering, ICSE ’12, pages 102–112. Yuan, D., Luo, Y., Zhuang, X., Rodrigues, G. R., Zhao, X., Zhang, Y., Jain, P. U., and Stumm, M. (2014). Simple testing can prevent most critical failures: An analysis of production failures in distributed data-intensive systems. In Proceedings of the 11th USENIX Conference on Operating Systems Design and Implementation, OSDI’14, pages 249–265. Zeng, L., Xiao, Y., and Chen, H. (2015). Linux auditing: Overhead and adaptation. In Proceedings of 2015 IEEE International Conference on Commu-
42
Heng Li et al.
nications, ICC ’15, pages 7168–7173. Zhang, S., Cohen, I., Symons, J., and Fox, A. (2005). Ensembles of models for automated diagnosis of system performance problems. In Proceedings of the 2005 International Conference on Dependable Systems and Networks, DSN ’05, pages 644–653. Zhu, J., He, P., Fu, Q., Zhang, H., Lyu, M. R., and Zhang, D. (2015). Learning to log: Helping developers make informed logging decisions. In Proceedings of the 37th International Conference on Software Engineering - Volume 1 , ICSE ’15, pages 415–425.