Exploiting Fully Convolutional Neural Networks for Fast Road Detection Caio C´esar Teodoro Mendes1,2 , Vincent Fr´emont2 and Denis Fernando Wolf1
Abstract— Road detection is a crucial task in autonomous navigation systems. It is responsible for delimiting the road area and hence the free and valid space for maneuvers. In this paper, we consider the visual road detection problem where, given an image, the objective is to classify every of its pixels into road or non-road. We address this task by proposing a convolutional neural network architecture. We are especially interested in a model that takes advantage of a large contextual window while maintaining a fast inference. We achieve this by using a Network-in-Network (NiN) architecture and by converting the model into a fully convolutional network after training. Experiments have been conducted to evaluate the effects of different contextual window sizes (the amount of contextual information) and also to evaluate the NiN aspect of the proposed architecture. Finally, we evaluated our approach using the KITTI road detection benchmark achieving results in line with other state-of-the-art methods while maintaining real-time inference. The benchmark results also reveal that the inference time of our approach is unique at this level of accuracy, being two orders of magnitude faster than other methods with similar performance.
I. I NTRODUCTION Autonomous vehicle technology has the potential to improve traffic safety, traffic flow in large cities, mobility for the disabled and overall change the transport landscape. Road detection is a key enabler of such systems, it provides not only the free and valid space for navigation but also crucial information for other tasks such as pedestrian and vehicle detection. Most solutions employ multi-layer LIDAR sensors for this purpose due to its reliable geometric information output. However, these sensors are expensive and provide limited information about color and texture which is essential for some tasks (e.g. detection of traffic light state). Cameras, on the other hand, cost a fraction of a LIDAR, are capable of high-resolution outputs and are already a reality in commercial vehicles. However, visual information, as opposed to geometric one, is notoriously difficult to work with, as numerous factors may alter the appearance of a scene. In this paper, we tackle the problem of visual road detection where, given an image, the objective is to classify each pixel as road or non-road. This constitutes a challenging task since there are different types of roads and lane markings. Illumination is also a critical issue as we are dealing with an open environment where the natural illumination may drastically alter the scene appearance. Furthermore, hardly any (2D) geometrical prior is useful when dealing with Authors1 are with the Mobile Robotics Lab, Institute of Mathematics and Computer Science (ICMC), University of S˜ao Paulo (USP), SP, Brazil,
{caiom; denis}@icmc.usp.br Authors2 are with Heudiasyc UMR CNRS 7253, Universit´e de Technologie de Compi`egne, France,
[email protected]
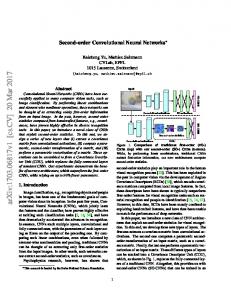
Fig. 1: Overview of the proposed approach. A patch (marked in orange) is feed to a convolutional neural network, its output (road or non-road) is attributed to the center region of the patch (marked in green).
images as roads may assume a wide range of sizes and shapes on a single frame. During the last years, this problem has been approached in a number of different ways. For instance, the work [1] relies on identifying abrupt changes in the appearance near the road boundaries to delimit the road region. However, most works pose the problem as a supervised machine learning one, where the features of an image region (or the whole image) are used as input to a model and the model outputs the class (road or non-road) which is attributed to the pixels whose input is referent. An example of such a work is given by [2] where the image is divided into a grid and each squared region is independently classified based on a selection of hand-crafted features. Some works focus on creating or using a set of features that are adequate to this specific task. For example, the work [3] proposes a set of illumination invariant features to improve the classification in shadowed areas. However, as such works classifies regions independently, they may misclassify regions of similar appearance. A possible solution is to include contextual information, that is including information not only of the pixel or region being classified but also from its surroundings or even the whole image (global context). Some efforts have been made in this direction, [4] uses Conditional Random Fields (CRF) and [5] spatial rays features to incorporate contextual cues. Nevertheless, they are limited since first-order CRFs only allow the direct influence of adjacent regions while the spatial rays approach requires a pre-segmented image. More effective approaches are presented in [6] and [7], the former creates a hierarchical image segmentation and uses
x2
Image 3x621x187
3x66x66 Patch
1st pass: 3x66x66 2nd pass: 16x32x32
Conv 3x3 - 32
32x64x64
16x64x64
16x32x32
32x30x30
16x30x30
16x15x15
Conv 1x1 - 16
Polling 2x2
Dense 1000
Image 3x621x187
1000x1x1 2x1x1
Softmax 2
Argmax - Upsample 4x4
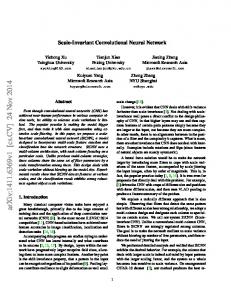
Fig. 2: Detailed view of the network architecture. The input to the model is a patch extracted from the image, its output is the class (road or non-road) which is attributed to a 4×4 region in the center of the input patch.
the classification information of one level to inform the next one. The later uses region-specific (De)convolutional Neural Networks (DNNs) enabling the non-linear influence of distant regions. Both approaches, however, are computationally costly and were not able to reach real-time even with parallel implementations. This work proposes a road detection system based on Convolutional Neural Networks (CNNs). It consists of extracting patches around a pixel or region of the image and classifying those patches using a trained CNN. The output class it attributed to the pixel or region from which the patch was centered, as shown by Fig. 1. We hence classify the pixel or region using not only its information but also information about its surrounding, that is, contextual information. The specific CNN architecture was designed to allow its conversion to a Fully Convolutional Network (FCN) at inference time. In turn, this conversion may allow the use of a large contextual window while maintaining real-time inference. II. P ROPOSED M ETHODOLOGY A. Convolutional Neural Networks The main component of the system is a Convolutional Neural Network (CNN). CNNs are biologically inspired models and belong to a group of methods usually referred as “deep learning” due to the use of a relatively large number of non-linear transformations. Although its initial theory dates back to 1980 [8] its practical success started in 1998 with LeCun’s improved design [9] and consolidated in 2012 with the results obtained in the ImageNet competition [10]. The later success popularized the method and was partially due to the efficient use of Graphics Processing Units (GPUs) and a new regularization technique called dropout [11]. Nowadays CNNs are a sensible choice for many visual tasks including object recognition, detection and image segmentation. CNNs can be viewed as an enhancement of the standard Multi-Layer Perceptrons (MLPs), where the main difference is the addition of convolutional layers. Such layers perform a similar operation as a standard image convolution but instead of using hard-coded kernels or filter banks, these parameters
are learned through backpropagation jointly with the rest of the network. Such layers allow the training of much larger (deep) networks and are able to learn directly from images (or raw input in general) avoiding, therefore, the need for task-specific hand-crafted features. A convolutional layer can be defined by the number of filters (Nf ), the filters’ size (Fx ×Fy ) and their stride (Sx ×Sy ). The number of learnable parameters of a layer is Ic × Nf × Fx × Fy + Nb , where Ic is the number of channels of the previous layer and the final Nb refers to the additional bias parameter for each filter. Given an input with size Ic × Ix × Iy , the output size can be calculated according to:
Oc = N ;
Ox =
I x − Fx + 1; Sx
Oy =
Iy − Fy + 1. (1) Sy
Convolutional layers tend to be followed by polling layers. Such layers reduce the dimensionality of the input by performing non-parametric operations (e.g. average, max) in local regions of the input. This layer tends to aggregate similar regions, enforce translation invariance and avoid overfitting. A typical CNN architecture consists of a repeated sequence of convolutional and polling layers, referred by some authors as the features extraction phase, followed by a number of fully connected layers (as in an MLP) where the final layer implements the loss function (e.g. Softmax). After each convolutional and fully connected layer a point-wise non-linearity, such as the rectified linear unit (ReLU) function σ(x) = max (0, x), is usually applied. The training is performed using stochastic gradient descent and the gradients are computed according to the chain rule, exactly as in a standard MLP. B. Network Architecture The proposed network architecture can be seen in Fig. 2. The input to the network is a three-channel image patch and its output is a class (road or non-road) that is attributed to the 4×4 region in the center of the patch. To classify a whole image, a patch should be extracted and classified for every 4×4 region of the original image (i.e. patches are extracted
with a 4×4 stride). The network itself starts with a conv. 3×3 - 32 (32 filters sized 3×3 each) layer, followed by a conv. 1×1 - 16 and a max-polling layer of 2×2. These three layers are repeated in sequence with the same parameters. Finally, there is a fully-connected layer with 1000 neurons and a final layer with 2 neurons (one for each class). All convolutional layers have a stride of 1×1, are followed by the ReLU activation function and do not employ padding. The first fully connected layer is followed by the ReLU function while the final layer implements the Softmax loss function. This architecture was inspired by the LeNet-5 architecture (convolutions followed by polling) and by the more recent “Network-in-Network” (NiN) [12] architecture which adds additional 1×1 convolution layers before polling. The reason for adding this 1×1 convolutional layer in our network is threefold: (I) it increases the network depth allowing it to learn high-level features; (II) it reduces the number of channels by a factor of half, speeding up training and inference and (III) it does not reduce the channel size which is important since we do not use padding between layers. We did not increase the number of convolution filters after the first polling (as it is usually the case) since preliminary experiments showed little to no benefit of doing so. Further design decisions will be clarified in the next section. C. Inference CNN architectures, as the one proposed, can be converted into a Fully Convolutional Network (FCNs) by converting the fully connected layers into convolutional layers. The benefit of doing so is that, instead of inputting only a patch, the whole image could be used as input and the network would output the classes for every image region. The use of FCNs for inference is especially important in cases where the contextual window or patch is large and there is a lot of overlap between subsequent patches, which is the case of the proposed architecture. Although we could directly train an FCN, instead of using it only for inference, we have chosen not to do so for the following reasons: (I) its training is unstable due to the lack of fine batch size control (i.e. the minimum batch size is an entire image) and (II) our sampling approach (we use only 25% of all samples) would reduce the speed advantage of directly training a FCN. To convert a standard CNN architecture (with fully connected layers) to a FCN there are at least three constraints that should be followed so that the FCN produces the exact same results as a per patch classification: (I) there could be no padding between layers, as the padding in the FCN and the regular CNN would be placed in different places; (II) the size of the channels to the first fully connected layer should be odd sized and (III) the output class should be upsampled to compensated the effects of the polling layers present in the network. These constraints further clarify the design decisions involving the proposed model, for instance, that is why we attribute the classification result to a 4×4 region of the image (we have 2 polling layers of 2×2 each). Concretely, at inference time, we convert the two fully connected layer in our model to convolutional layers. Taking,
for example, an input patch of 66×66, the first fullyconnected layer with 1000 neurons would be converted into a 15×15 - 1000 convolutional layer. This conversion is possible because both layers share the same number of weights. The last fully connected layer would become a 1×1 - 2 convolutional layer. It should be clear that both networks produce the same results using effectively the same operations, the only difference is that the FCN network is able to deal arbitrarily sized inputs and outputs hence being able to classify the whole image at once. This inference scheme allows efficient inference even when using large contextual window sizes. III. E XPERIMENTS A. Dataset and Setup To train and evaluate our approach we employed the KITTI Vision Benchmark Suite [13] or, more specifically, the road detection benchmark. This benchmark provides 289 training images alongside their ground-truth and 290 test images. Both sets of images are divided into three categories: urban marked (UM), urban multiple marked lanes (UMM) and urban unmarked (UU). The benchmark ranks methods by their maximum F-measure on the Bird’s-eye view (BEV) transformation of the test set. The benchmark also provides LIDAR, stereo and GPS data. In this work, we only made use of the monocular color images and we do not distinguish between the three road categories. We divided the 298 training images into two different sets, one for training with 260 images and one for validation containing 29 images. All the quantitative results reported in this paper, excluding our benchmark submission, are referent to these 29 images. We perform the evaluation in the same way as the benchmark server: the prediction and the ground truth images are both transformed to the BEV space and are compared pixel-wise. We use the images at half of their original resolution and the results are linearly interpolated back to the original resolution for evaluation. We implemented our work using the Python language, the OpenCV1 library and a modified version of the Caffe framework [14] with the cuDNN v2 library2 . The tests were conducted on a machine equipped with an Intel Core i74930K, 64GB RAM, and an NVIDIA Titan X. B. Training Scheme Using the training and validation images, we created training and validation datasets for each of the patch sizes tested. Each sample consists of the RGB patch and its referent class. To create the samples, we scan the image skipping 4 pixels in each axis (stride of 4) and extracted the patch centered around each 4×4 region. We included only samples whose 4×4 regions are of a single class, ignoring ambiguous samples. All images are padded (using reflection) so the 4×4 regions cover the full original image. The probability of including a sample in our dataset is proportional to 1 http://www.opencv.org/ 2 https://developer.nvidia.com/cudnn
(a) Above the average sample results.
(b) Average sample results.
(c) Below the average sample results.
Fig. 3: Sample classification results using the test set of the KITTI road detection dataset. TABLE I: Patch Size Evaluation (in %)
TABLE II: Network-in-Network Evaluation (in %)
Patch Size
F-measure
Accuracy
Precision
Recall
Inf. Time
Model
F-measure
Accuracy
Precision
Recall
Inf. Time
10x10 18x18 34x34 50x50 66x66
84.8 88.3 90.9 91.7 92.2
88.7 91.1 93.1 93.6 93.9
89.3 91.1 93.4 92.6 92.8
80.8 85.8 88.5 90.9 91.6
8 ms 9 ms 14 ms 21 ms 25 ms
With NiN Without
92.2 92.1
93.9 93.9
92.8 93.4
91.6 90.8
25 ms 41 ms
Diff.
-0.1
0.0
+0.6
-0.8
+16 ms
the region it would occupy in the BEV space, hence the loss of our network approximates the benchmark evaluation more closely. In total, only 25% of all possible samples were included, using more samples yielded no performance benefit. All samples are standardized channel-wise. We conducted the training using mini-batch gradient descent with a batch size of 100, initial learning rate of 0.01, momentum of 0.9 and an L2 weight decay rate of 0.0005. The learning rate is reduced after each full training epoch according to l := l × 0.96, where l is the learning rate. We also employed a dropout rate of 50% in the two fully connected layers. The training ends after 10 full epochs without any improvement in the validation dataset. After each training session, we evaluated the model’s F-measure using the validation images. We repeat this procedure five times and use the model with the best F-measure. This has been done for two reasons: (I) the weight initialization is random, generating a different model each time and (II) the employed loss function is not directly related to the F-measure in the BEV space. C. Qualitative Results Fig. 3 shows a sample of the obtained results using the images of the test set. Each column represents a road category, starting with UM, followed by UMM and finally the UU category. The rows or sub-figures represent the subjective “quality” of the results, ranging from above the average to below the average. The first row reveals that our
approach performs reasonably well in shadowed areas and, as the output from the FCN model is linearly interpolated, the artifacts of classifying “blocks” (due to the use of polling layers and half of the original resolution) is barely visible. The second row shows a limitation of our method, where it behaves erratically and may misclassify small regions. The final row displays our worst sample results in each road category and reveals two further limitations: its inability to deal with extreme lighting conditions and with different road surfaces types. More qualitative results can be seen as a video at http://youtu.be/3FER84XD17w. D. Patch Size Evaluation We initially tested the effect of the patch size on the accuracy and the inference time of the model. The specific chosen sizes are related to the constraints imposed by the use of an FCN for inference. The quantitative results are shown in table I, where the inference time refers only to the model time. As expected, the F-measure increases with the patch size due to the larger context. The inference time scaled approximately linearly after the size 18×18. A visual sample of the results can be seen in Fig. 4. The number of false positives negatives decreases significantly with larger patch sizes and the false negatives are virtually all removed. E. Network-in-Network Evaluation We also evaluated the role of the additional 1×1 convolutional layer, which is a key component of the proposed architecture. We trained a network with a patch size of 66×66 but removing the two 1×1 convolutional layers of
TABLE III: Urban Road KITIT Benchmark Results (in %)
TABLE IV: Processing Time
Method
MaxF
Pre.
Rec.
FPR
FNR
Runtime
Task
Processing Time (ms)
DNN [6] Our method HIM [7] NNP StixelNet [15] CB [16] FusedCRF [17] ProbBoost [18] SPRAY [5]
93.43 90.79 90.64 89.68 89.12 88.97 88.25 87.78 87.09
95.09 90.87 91.62 89.67 85.80 89.50 83.62 86.59 87.10
91.82 90.72 89.68 89.68 92.71 88.44 93.44 89.01 87.08
2.61 5.02 4.52 5.69 8.45 5.71 10.08 7.60 7.10
8.18 9.28 10.32 10.32 7.29 11.56 6.56 10.99 12.92
2s 0.03s 7s 5s 1s 2s 2s 150s 0.04s
Resize Pad Scale Copy to GPU Model Forward Pad Resize Crop Resize
1.4 1.8 2.5 0.4 25.4 0.2 0.4 0.0 0.6
Total
32.7
the model. The results are shown in Table II. While the performance is virtually the same, the inference time is higher. This result validates our assumption that by adding a 1×1 convolutional layer we could maintain (or improve) performance while reducing the inference time. F. Benchmark Submission To compare our method with others, we submitted our results to the KITTI road detection benchmark3 . Table III presents the first nine results in the Urban Road category which is an aggregate of all three road categories (UU, UM, and UMM). Our method achieved the second best score out of 33 participants while being the fastest method (excluding the baseline submission). These results include the participants taking advantage of LIDAR (FusedCRF) or stereo vision (NNP and ProbBoost) data. The first method of the benchmark (DNN) uses a combination of convolutional and deconvolutional layers to include a global context and also uses position-specific classifiers to take advantage of a positional prior (i.e. the bottom-center region is more likely to be road). Both the global context and the positional prior may explain their higher score, however, as they use many larger models, their inference time is two orders of magnitude slower than ours. The HIM method also uses a global context and while their scores are similar to ours, their inference time is far from being practical. Further methods employ a range of techniques to achieve their results, from post-processing their results with stereo information (NNP), to using “rays features” to include contextual information (SPRAY). One topic that is present in most of these works (DNN, HIM, CB, FusedCRF, and SPRAY) is the use of contextual information, this includes our previous work (CB) where we made use of “contextual blocks” to efficiently include contextual information, however our implementation did not reach real-time and, as we used a standard MLP, we had to use a selection of hand-crafted features which may not have been the most appropriated for the task. G. Processing Time Given a dataset image in the main memory of our test machine, Table IV presents the processing time for each of the steps involved in producing the inference results. The first resize operation is performed to reduce the image to half of 3 http://www.cvlibs.net/datasets/kitti/index.php
its original resolution while the last one is its counterpart. The padding and resize operations after the model are used to compensate the effects of the convolutional and polling layers respectively. As expected, most of the time is spend in the model itself which is responsible for more than 75% of the total time. IV. D ISCUSSION The proposed methodology successfully yields results comparable with other state of the art methods while maintaining a fast inference time, which is especially important for road detection. Our method differentiates itself from other similar works in three main points: (I) the network was carefully designed to allow the conversion and fast inference using an FCN; (II) the use of the NiN type architecture which contributed to both the performance and the inference speed and (III) the use of a large contextual window which, as the experiments show, contributed to the performance of the method. Despite dealing reasonable well with shadowed areas, our method may misclassify regions subject to extreme lighting conditions. This limitation, however, is not a peculiarity of our method and affect most, if not all, vision-based methods (including stereo vision ones). Another relevant limitation is the inability to deal with different types of road surfaces. This limitation may be remedied with the inclusion of a global context but, as we do not have access to other methods’ (which use a global context) results in those specific images, this possibility remains unanswered. The training data does not contain this type of road, which brings another question: How would the method react if trained on different road surfaces? This also reveals what could be considered a limitation of the benchmark itself as it contains only the standard asphalt road in its training set. Our method also presents some instability, misclassifying small regions sometimes and, while most of it could be filtered using a temporal filter, it is probable that some regions would still be misclassified. One practical consideration is that, although our method has a fast inference time, it is contingent on the use of a highend GPU. GPUs are already available in commercial cars but only in their low consumption versions with limited performance. Our method, however, could scale for such devices by changing the patch size. Finally, given the existence of a
device already capable of running our method in real-time and the rapid pace with which GPU technology advances, a low consumption counterpart of the used GPU should emerge in a small amount of time. V. C ONCLUSIONS AND F UTURE W ORKS We have presented a machine learning approach for road detection which is able to take advantage of large amounts of contextual information while maintaining a relatively fast inference time. Experimental tests revealed the importance of the use of large contextual windows and its effects on the inference time of the proposed model. The experiments also reveal that the specific chosen model architecture was a key enabler of such results, significantly reducing the inference time. Unfortunately, the proposed approach presents some limitations, as its inability to correctly classify different types of road surfaces or regions subject to extreme lighting conditions. Nevertheless, our approach is unique in terms of its inference time at this level of accuracy. For future works, we are investigating the use of sparse convolutional neural networks for the efficient inclusion of a global context without the need for padding.
(a) Patch size 10x10.
(b) Patch size 18x18.
(c) Patch size 34x34.
ACKNOWLEDGMENT The authors would like to acknowledge the support granted by FAPESP (process nr. 2011/21483-4) and CNPq (process nr. 202415/2014-7). R EFERENCES [1] J. McCall and M. Trivedi, “Video-based lane estimation and tracking for driver assistance: survey, system, and evaluation,” IEEE Transactions on Intelligent Transportation Systems, vol. 7, no. 1, pp. 20–37, March 2006. [2] P. Shinzato, V. Grassi, F. Osorio, and D. Wolf, “Fast visual road recognition and horizon detection using multiple artificial neural networks,” in IEEE Intelligent Vehicles Symposium (IV), June 2012, pp. 1090–1095. [3] J. Alvarez and A. Lopez, “Road detection based on illuminant invariance,” IEEE Transactions on Intelligent Transportation Systems, vol. 12, no. 1, pp. 184–193, March 2011. [4] M. Passani, J. Yebes, and L. Bergasa, “Crf-based semantic labeling in miniaturized road scenes,” in IEEE Conference on Intelligent Transportation Systems (ITSC), October 2014, pp. 1902–1903. [5] T. Kuhnl, F. Kummert, and J. Fritsch, “Spatial ray features for real-time ego-lane extraction,” in IEEE Conference on Intelligent Transportation Systems (ITSC), September 2012, pp. 288–293. [6] R. Mohan, “Deep Deconvolutional Networks for Scene Parsing,” 2014, preprint, arXiv:1411.4101. [Online]. Available: http://arxiv.org/ abs/1411.4101 [7] D. Munoz, J. A. Bagnell, and M. Hebert, “Stacked hierarchical labeling,” in European Conference on Computer Vision (ECCV), September 2010, pp. 57–70. [8] K. Fukushima, “Neocognitron: A self-organizing neural network model for a mechanism of pattern recognition unaffected by shift in position,” Biological Cybernetics, vol. 36, no. 4, pp. 193–202, 1980. [9] Y. Lecun, L. Bottou, Y. Bengio, and P. Haffner, “Gradient-based learning applied to document recognition,” Proceedings of the IEEE, vol. 86, no. 11, pp. 2278–2324, Nov 1998. [10] A. Krizhevsky, I. Sutskever, and G. E. Hinton, “Imagenet classification with deep convolutional neural networks,” in Advances in Neural Information Processing Systems, 2012, pp. 1097–1105. [11] N. Srivastava, G. Hinton, A. Krizhevsky, I. Sutskever, and R. Salakhutdinov, “Dropout: A simple way to prevent neural networks from overfitting,” Journal of Machine Learning Research, vol. 15, pp. 1929– 1958, 2014. [12] M. Lin, Q. Chen, and S. Yan, “Network in network,” 2013, preprint, arXiv:1312.4400. [Online]. Available: http://arxiv.org/abs/1312.4400
(d) Patch size 50x50.
(e) Patch size 66x66.
Fig. 4: Classification results using different patches sizes where green represents true positive, red false negative and blue false positive.
[13] J. Fritsch, T. Kuhnl, and A. Geiger, “A new performance measure and evaluation benchmark for road detection algorithms,” in IEEE Conference on Intelligent Transportation Systems (ITSC), October 2013, pp. 1693–1700. [14] Y. Jia, E. Shelhamer, J. Donahue, S. Karayev, J. Long, R. Girshick, S. Guadarrama, and T. Darrell, “Caffe: Convolutional architecture for fast feature embedding,” 2014, preprint, arXiv:1408.5093. [15] D. Levi, N. Garnett, and E. Fetaya, “Stixelnet: A deep convolutional network for obstacle detection and road segmentation.” in 26TH British Machine Vision Conference (BMVC), 2015. [16] C. C. T. Mendes, V. Fr´emont, and D. F. Wolf, “Vision-based road detection using contextual blocks,” 2015, preprint, arXiv:1509.01122. [17] L. Xiao, B. Dai, D. Liu, T. Hu, and T. Wu, “Crf based road detection with multi-sensor fusion,” in IEEE Intelligent Vehicles Symposium (IV), June 2015, pp. 192–198. [18] G. B. Vitor, A. C. Victorino, and J. V. Ferreira, “A probabilistic distribution approach for the classification of urban roads in complex environments,” in Workshop on IEEE International Conference on Robotics and Automation (ICRA), 2014.