Nov 16, 2012 - 1 Computer Vision Lab, Department of Electrical Engineering and Computer Science, University of Central Florida, Orlando, FL, USA.
ORIGINAL RESEARCH ARTICLE published: 16 November 2012 doi: 10.3389/fnsys.2012.00075
SYSTEMS NEUROSCIENCE
Exploiting the brain’s network structure in identifying ADHD subjects Soumyabrata Dey 1*, A. Ravishankar Rao 2 and Mubarak Shah 1 1 2
Computer Vision Lab, Department of Electrical Engineering and Computer Science, University of Central Florida, Orlando, FL, USA IBM T.J. Watson Research Center, Yorktown Heights, NY, USA
Edited by: Damien Fair, Oregon Health and Science University, USA Reviewed by: Jason Bohland, Boston University, USA Joao Sato, Universidade Federal do ABC, Brazil *Correspondence: Soumyabrata Dey, Computer Vision Lab, Department of Electrical Engineering and Computer Science, University of Central Florida, Orlando, FL 32816-2362, USA. e-mail: soumyabrata.dey@ knights.ucf.edu
Attention Deficit Hyperactive Disorder (ADHD) is a common behavioral problem affecting children. In this work, we investigate the automatic classification of ADHD subjects using the resting state functional magnetic resonance imaging (fMRI) sequences of the brain. We show that brain can be modeled as a functional network, and certain properties of the networks differ in ADHD subjects from control subjects. We compute the pairwise correlation of brain voxels’ activity over the time frame of the experimental protocol which helps to model the function of a brain as a network. Different network features are computed for each of the voxels constructing the network. The concatenation of the network features of all the voxels in a brain serves as the feature vector. Feature vectors from a set of subjects are then used to train a PCA-LDA (principal component analysis-linear discriminant analysis) based classifier. We hypothesized that ADHD related differences lie in some specific regions of brain and using features only from those regions are sufficient to discriminate ADHD and control subjects. We propose a method to create a brain mask which includes the useful regions only and demonstrate that using the feature from the masked regions improves classification accuracy on the test data set. We train our classifier with 776 subjects, and test on 171 subjects provided by the Neuro Bureau for the ADHD-200 challenge. We demonstrate the utility of graph-motif features, specifically the maps that represent the frequency of participation of voxels in network cycles of length 3. The best classification performance (69.59%) is achieved using 3-cycle map features with masking. Our proposed approach holds promise in being able to diagnose and understand the disorder. Keywords: attention deficit hyperactive disorder, default mode network, functional magnetic resonance image, linear discriminant analysis, principal component analysis
1. INTRODUCTION Attention Deficit Hyperactivity Disorder (ADHD) is a common behavioral disorder affecting children. Approximately 3–5% of school aged children are diagnosed with ADHD. Currently, no well-known biological measure exists to diagnose ADHD. Instead doctors rely on behavioral symptoms to identify it. To understand the cause of the disorder more fundamentally, researchers are using new structural and functional imaging tools like MRI and functional magnetic resonance imaging (fMRI). fMRI has been widely used to study the functioning of brain. It provides high quality visualization of spatio-temporal activity within a brain, which can be used to compare the functioning of normal brains against those with disorders. fMRI has been used for different functional studies of brain. Some of the researchers have used task-related fMRI data, in which the test subjects perform conscious tasks depending on the input stimuli. Others used resting state brain fMRI data. The brain remains active even during rest, when it is not engaged in an attentive task. Raichle et al. (2001) identified several brain areas such as the medial prefrontal cortex (MPFC), posterior cingulate cortex (PCC), and precuneus that are active during rest. These areas form part of a functional network known as the
Frontiers in Systems Neuroscience
resting-state network or default mode network (DMN) (Greicius et al., 2004; Damoiseaux et al., 2006). The literature (Greicius et al., 2004; Cherkassky et al., 2006; Damoiseaux et al., 2006) tends to use interchangeably the concepts of resting state brain networks and the DMN as defined by Raichle et al. (2001). We compare the brain regions that we have found in the current ADHD data set with the components of the DMN described by Raichle et al. (2001). It is believed that the DMN may be responsible for synchronizing all parts of the brain’s activity; disruptions to this network may cause a number of complex brain disorders (Raichle, 2010). Researchers have studied neural substrates relevant to ADHD related behaviors, such as attention lapses, and identified the DMN as the key areas to better understand the problem (Weissman et al., 2006). In this study we use the resting state brain fMRI data and hypothesize that the differences between ADHD conditioned and control brains lie in the variation of functional connections of DMN. Many studies have been performed to identify functional differences related to ADHD. Most of the approaches use group label analysis to deduce the statistical differences between ADHD conditioned and control groups. Structural MRI analysis suggests that there are abnormalities in ADHD brains, specifically
www.frontiersin.org
November 2012 | Volume 6 | Article 75 | 1
Dey et al.
Brain’s network in identifying ADHD
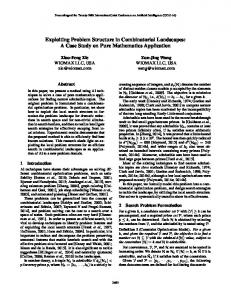
in the frontal lobes, basal ganglia, parietal lobe, occipital lobe, and cerebellum (Castellanos et al., 1996; Overmeyer et al., 2001; Sowell et al., 2003; Seidman et al., 2006). In another set of studies, ADHD brains were analyzed using task-related fMRI data. Bush et al. (1999) found significant low activity in the anterior cingulate cortex when ADHD subjects were asked to perform the Counting Stroop during fMRI. Durston (2003) showed that ADHD conditioned children have difficulty performing the go/nogo task and display decreased activity in the frontostriatal regions. Teicher et al. (2000) demonstrated that boys with ADHD have higher T2 relaxation time in the putamen which is directly connected to a child’s capacity to sit still. A third set of work was done using the resting state brain fMRI to locate any abnormalities in the DMN. Castellanos et al. (2008) performed Generalized Linear Model based regression analysis on the whole brain with respect to three frontal foci of DMN, and found low negative correlated activity in precuneus/anterior cingulate cortex in ADHD subjects. Tian et al. (2006) found functional abnormalities in the dorsal anterior cingulate cortex; Cao et al. (2006) showed decreased regional homogeneity in the frontal-striatal-cerebellar circuits, but increased regional homogeneity in the occipital cortex among boys with ADHD. Zang et al. (2007) verified decreased amplitude of low-frequency fluctuation (ALFF) in the right inferior frontal cortex, left sensorimotor cortex, bilateral cerebellum, and the vermis, as well as increased ALFF in the right anterior cingulate cortex, left sensorimotor cortex, and bilateral brainstem. While group level analysis can suggest statistical differences between two groups, it may not be that useful for clinical diagnosis at the individual level. There have been relatively few investigations at the individual level of classification of the ADHD subjects. One such study is performed by Zhu et al. (2008) who used a PCA-LDA (principal component analysis-linear discriminant analysis) based classifier to separate ADHD and control subjects at individual level. Unlike our network connectivity feature, which can connect all the synchronous regions of the whole brain, they used a regional homogeneity based feature for classification. Also the experiments were performed on only 20 subjects, which are not conclusive. Our algorithm exploits the topological differences between the functional networks of the ADHD and controlled brains. The different steps of our approach are described in the Figure 1. The input to our algorithm is brain fMRI sequences of the subjects.
1 Time
4d fMRI time series
Voxel Arranged in a matrix
0 Correlation Matrix (N x N)
fMRI data can be viewed as a 4-D video such that the 3-D volume of the brain is divided into small voxels and imaged for a certain duration . The data can also be viewed as a time series of intensity values for each of the voxels. The correlation of these intensity time-series can be an indication of how synchronous the activities of two voxels are, and higher correlation values suggest that two voxels are working in synchronization. A functional network structure is generated for the brain of each of the subjects under study by computing the correlations for all possible pairs of voxels and establishing a connections between any pairs of voxels if their correlation value is sufficiently high. Different network features, such as degree maps, cycle maps, and weight maps are computed from the network to capture topological differences between ADHD and control subjects. We have provided a detailed description of all the network features in the later sections of the article. A brain mask is computed that includes only the regions with useful information to classify ADHD and control subjects. For the rest of the article, we refer to this mask as a “useful region mask.” The details of the useful region mask computation procedure are described in section 2.2. Finally, the network features from the voxels within the useful region mask are extracted to train a PCA-LDA based classifier. We have tested the performance of each of the network features computed on the training data set from the Kennedy Krieger Institute (KKI). We selected two different kinds of network features, degree map and 3-cycle map, for the experiments on the full data set. In our work, we have performed experiments on a large challenging data set which includes subjects from different races, age groups, and data capturing sites. We propose a new approach for the automatic classification of ADHD subjects, and believe that our work will be helpful to the medical imaging community.
2. MATERIALS AND METHODS 2.1. DATA
We use the data provided by the Neuro Bureau for the ADHD 200 competition which consists of 776 training subjects and 197 test subjects. Eight different centers contributed to the compilation of the whole data set, which makes the data diverse as well as complex. Different phenotypic information, such as age, gender, handedness, and IQ, is also provided for each subject. Consider Table 1 for an overview of the data set. All research conducted by ADHD-200 data contributing sites was conducted
1 1 0 0 0 1 1 0 0 0 0 0 1 1 1 0 0 1 1 0 0 0 1 0 1 0 0 0 0 1 0 1 0 1 0 1 1 0 0 0
0 0 1 0 1 1 0 0 0 0 1 1 1 0 0 1 0 0 0 1 1 0 1 1
Network Features Computation (sec 2.2.1)
Useful Region Mask Generation (sec 2.3)
PCA + LDA Classification (sec 2.2.2 )
Adjacency Matrix (N x N)
FIGURE 1 | Overview of our approach. Compute an N × N correlation matrix (N is the number of voxels) using fMRI data; compute the adjacency matrix by thresholding the low correlation values to generate a network; compute network features such as node degree and cycle count
Frontiers in Systems Neuroscience
for each node of the network; generate a mask for the brain regions which are believed to be most effective for classification; extract feature values within the generated brain mask and classify subjects using the PCA-LDA classifier.
www.frontiersin.org
November 2012 | Volume 6 | Article 75 | 2
Dey et al.
Brain’s network in identifying ADHD
Table 1 | Summary of the data set released for ADHD-200 competition. Center
Sub Cnt
Age (years)
Male
Female
Control
Combined
Hyperactive
Inattentive
TRAINING DATA SET Kennedy Krieger Institute
83
8 − 13
46
37
61
16
1
Neuro Image Sample
48
11 − 22
31
17
23
18
6
1
New York University
222
7 − 18
145
77
99
77
2
44
5
79
7 − 12
43
36
42
23
2
12
152
8 − 17
102
50
93
22
0
37
University of Pittsburg
89
10 − 20
46
43
89
0
0
0
Washington University in St. Louis
61
7 − 22
33
28
61
0
0
0
Oregon Health and Science University Peking University
TEST DATA SET Kennedy Krieger Institute
11
8 − 12
10
1
8
3
0
0
Neuro Image Sample
25
13 − 26
12
13
14
11
0
0 7
New York University
41
7 − 17
28
13
12
22
0
Oregon Health and Science University
34
7 − 12
17
17
27
5
1
1
Peking University
51
8 − 15
32
19
27
9
1
14
9
14 − 17
7
2
5
0
0
4
26
8 − 18
9
17
−
−
−
−
University of Pittsburg Brown University
A total of eight centers contributed to the data. The labels of the Brown University test set are not yet released.
with local IRB approval, and contributed in compliance with local IRB protocols. In compliance with HIPAA Privacy Rules, all data used for the experiments of this article is fully anonymized. The competition organizers made sure that the 18 patient identifiers are removed, as well as face information. For all our experiments we have used preprocessed resting state fMRI data registered in a 4 × 4 × 4 mm voxel resolution Montreal Neurological Institute (MNI) space, with nuisance variance removed, filtered using a bandpass filter (0.009 Hz