ignore the perception that users have from cloud services. As a consequence ...... phone call center: A queueing-science perspective,â Jour- nal of the American ...
Exploiting User Patience for Scaling Resource Capacity in Cloud Services Renato L. F. Cunha, Marcos D. Assunc¸a˜ o, Carlos Cardonha, Marco A. S. Netto IBM Research Brazil Abstract—An important feature of cloud computing is its elasticity, that is, the ability to have resource capacity dynamically modified according to the current system load. Auto-scaling is challenging because it must account for two conflicting objectives: minimising system capacity available to users and maximising QoS, which typically translates to short response times. Current auto-scaling techniques are based solely on load forecasts and ignore the perception that users have from cloud services. As a consequence, providers tend to provision a volume of resources that is significantly larger than necessary to keep users satisfied. In this article, we propose a scheduling algorithm and an autoscaling triggering technique that explore user patience in order to identify critical times when auto-scaling is needed and the appropriate volume of capacity by which the cloud platform should either extend or shrink. The proposed technique assists service providers in reducing costs related to resource allocation while keeping the same QoS to users. Our experiments show that it is possible to reduce resource-hour by up to approximately 8% compared to auto-scaling based on system utilisation.
I. I NTRODUCTION Several service providers rely on public clouds to deliver a range of IT resources—including processing, storage, network, and software—to end users and organisations of various types and sizes. The benefits of a cloud solution derive from economies of scale, possibility to deploy applications globally, reduction of upfront investment in IT infrastructure, and the adoption of a pay-as-you-go model, where clients are charged only for the resources they consume. The elasticity of the cloud enables organisations to change infrastructure capacity on demand and avoid tasks that are necessary when resources are managed locally, such as procurement of new hardware and software. Elasticity is an appealing feature, but it is important to remark that deciding when and by how much the system capacity should be modified dynamically is a challenging task. Current auto-scaling techniques monitor and predict system utilisation to trigger actions when the use of certain target resources, such as CPU, memory, and network bandwidth, exceed pre-determined thresholds. However, these approaches are unsatisfactory, since they may lead to unnecessarily high resource allocation operations that may not even be able to reduce the perceived degradation in QoS. This situation typically occurs when the load is bursty—as predictions are less accurate—and during retry periods, when users resume service use after a short period of quality degradation1 . 1 Scryer Auto-scaling: http://techblog.netflix.com/2013/11/scryer-netflixspredictive-auto-scaling.html
Another challenging aspect for the specification of efficient auto-scaling techniques is the identification of adequate scalein and scale-out step sizes, i.e., the number of resources by which the cloud should shrink and expand, respectively. For example, if step sizes in scale-out and scale-in operations are too small or too large, respectively, response times may increase and the perceived QoS may reach unacceptably low levels. Conversely, if step sizes in scale-out and scale-in operations are too large or too small, respectively, utilisation levels may become low, which basically results in economic losses. Existing work has overseen the fact that users have heterogeneous QoS requirements, interact with cloud services in different manners, have distinct expectations on response time, and varying patience. By exploiting these facts, it is possible to delay (minor delays [1]) handling service requests from patient users with low QoS demands and prioritise those submitted by individuals with less patience. For both types of users, the service would meet response time expectations and could eventually lead to significant reductions in the number of resources employed to service user requests. Our previous work [2], [3] has shown the benefits of such strategies, but their implications on auto-scaling decisions remained open. In this paper we propose a scheduling algorithm and an auto-scaling technique that explore heterogeneity of user patience in order to perform better auto-scaling decisions. The key contributions of this paper are: •
• •
Identification of opportunities and challenges of autoscaling considering different user expectation and patience levels (§ II); A patience-based scheduling algorithm and a technique for deciding when auto-scaling should be activated (§ III); Experiments that show reduction of up to 8% of resourcehour compared to auto-scaling based on system utilisation information (§ IV). II. P ROBLEM D ESCRIPTION
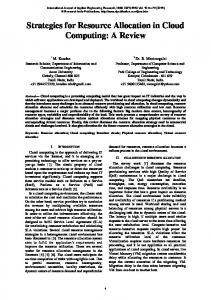
This paper considers the case of a service provider that autoscales the pool of resources allocated to a service according to budget and request response time constraints. As illustrated in Figure 1, the scenario comprises: users accessing a service; a service provider; and a cloud infrastructure provider. The literature shows that users have different expectations on
Goal: How Can the Service Provider Minimise Resource/Hour Usage and Keep the Overall User Experience?
USERS
SERVICE PROVIDER
CLOUD INFRASTRUCTURE PROVIDER
-2
-1 1
- Expected QoS - Actual User Patience
-
2
Patience (d)
- Resource Pool
Elastic Resource Pool Delivered QoS Estimated User Patience Resource Auto-scaling Decisions
Fig. 1. Scenario: A service provider wishes to maximise overall user experience via optimal resource auto-scaling decisions considering factors such as (i) users’ patience level; (ii) delivered response time; and (iii) resource pool allocated from a cloud infrastructure provider.
User experience (ue)
Fig. 2. Using prospect theory [4] to model variations on user patience as a function of the request QoS.
service quality, hence resulting in heterogeneous levels of patience when faced with delays and quality degradation. The questions we set ourselves to address are therefore: (i) how to determine critical times when auto-scaling is necessary or when it can be avoided by exploiting information about users’ patience; and (ii) how large the scale steps should be. There is no distinction between standard and premium users, but we assume that expectations on response time (QoS) and level of patience may vary from user to user. It is easy to see why this assumption is realistic by considering a practical example. While users expect to get results from Web searches in a couple of seconds, there is a larger tolerance margin from those performing large-scale graph mining, which can take from minutes to hours. We consider the scenario of a cloud service that is designed to deliver a given response time to users, and attempts to perform auto-scaling decisions based on estimations of future workload and user patience. It allocates resources from a cloud infrastructure where machines typically are characterised by their cost and performance; we consider that resources are pairwise indistinguishable (and, therefore, have the same cost and performance characteristics). Differences between the level of expectation and the actual response times for submitted requests have an impact in the users’ patience with a service. The effect of a single interaction persists with decreasing importance over time. We model the variation of user patience as a function of its request QoS, which is given by the ratio between expected and actual response times. Inspired by prospect theory [4], we assume that the impact of delays is higher than that of fast responses (see Figure 2). Finally, we assume that a user will find the QoS unacceptable if her patience goes below her personal lower bound. III. S CHEDULING AND M ODELLING In this section, we present a formal description of the problem and describe both the scheduling algorithms and the auto-scaling techniques employed in our experiments.
We propose a new scheduling algorithm that takes user patience into account. It serves requests according to the number of times that their respective users would tolerate long response delays. The intuition behind it is simple: if the user submitting job j1 has a larger tolerance than the user submitting job j2 , then j2 should be scheduled first. For the auto-scaling operations, we investigate two strategies. The first one is solely based on system utilisation, but we present a formula that determines an upper bound on the volume by which the service capacity should increase or shrink, avoiding the invocation of several auto-scaling operations in a row. Finally, the second strategy extends the first by employing user patience in order to identify an appropriate step level. A. Mathematical Description We consider a discrete-time state-space model, so all the time-related values are integer numbers belonging to T ⊆ N. We are given a set U of users, a set J of incoming jobs, and a set M of machines that can be provisioned and used to service these requests. The ownership relation between U and J is given by the function o : J → U, that is, job j was submitted by user u(j). In each moment t ∈ T , M can be partitioned in sets Ma,t and Mn,t containing the machines that are currently active and inactive, respectively. We denote |M| by m and |Ma,t | by mt . The system always has to keep a minimum number b > 0 of active machines, i.e., |Ma,t | ≥ b for every t in T . We consider scenarios where jobs have an average processing time ρ ∈ N. Moreover, we assume that, after submitting job j, the amount of time user u(j) is expecting to wait before receiving the results is given by ρβu(j) , where βu(j) is a multiplicative factor that may differ from user to user. The response time of the provider for job j is denoted by rj . For each u ∈ U and t ∈ T , φt,u ∈ R+ denotes u’s patience at instant t. If φt,u goes below a certain threshold τu ∈ [0, 1), we say that u is unhappy. User patience changes over time
according to the QoS being delivered by the provider. More precisely, φt,u(j) improves if rj < ρj βu(j) and decreases otherwise. Based on the ideas introduced by Prospect Theory, where the sense of losing an opportunity has higher impact in a user’s patience than the sense of gaining, we define the behaviour of φt,u as follows. First, we assume that the user reaction after submitting task j and obtaining response time rj is given by ρβu(j) , xj = rj where xj > 1 indicates that the provider’s answer to j came faster than expected and xj < 1 accounts for situations where the response time was slower. In order to consider the different user reactions suggested by prospect theory, we assume that the value φt,u changes from φt,u after the submission of j as follows: ( α1,u φt−1,u + (1 − α1,u )xj , if xj > 1 φt,u = α2,u φt−1,u + (1 − α2,u )xj , else. In both cases, we use exponential smoothing to update the patience level. In order to make the immediate impact of slower response times higher than that of faster ones, we have α1,u > α2,u . Moreover, different users may have different values of α1,u and α2,u . The main goal of a provider is to deliver acceptable response times and to keep the number of active resources at a minimum. More formally, we have a multi-criteria optimization P problem where we want to minimise |M n,i |, which t∈T denotes thePsum of provisioned machines over time, and to maximise (t,u)∈T ×U φt,u , which is equal to the sum of patience levels for all users over time. B. Scheduling Algorithms In our computational experiments, we employed the following scheduling strategies. 1) FIFO Scheduling: First-in, First-out (FIFO) is one of the oldest and most frequently used scheduling strategies. It focuses mainly on fairness, as it schedules jobs to machines according to their arrival order. 2) Lowest Patience First Scheduling: The Lowest Patience First (LPF) algorithm orders arriving jobs according to the patience level of their respective users as follows. If, at instant t, user u submits job j and xj < 1, we have φt+1,u = α1 φt,u + (1 − α1 )xj ≥ α1 φt,u , that is, since lim
rj →∞
ρβu = 0, rj
φt+1,u becomes closer to α1 φt,u as rj → ∞, and therefore α1 φt,u is a lower bound of φt+1,u whose accuracy grows with
the system load. Using this bound, we can estimate the value kj ∈ N for which φt+kj ,u ≤ τu as follows: k
α1 j φt,u k α1 j
≥ τu τu ≥ φt,u �
kj
≥ logα1
� τu . φt,u
Value kj indicates the number of submissions for which u(j) will tolerate a bad QoS before having τu(j) surpassed. LPF sorts the jobs in the scheduling queue according to kj . In order to avoid starvation, LPF sets kj to zero if job j is waiting for a period of time that is at least twice as large as the current average response time. C. Auto-scaling Triggering The scaling strategies presented here employ resource utilisation as a trigger for deciding on scale-out and scale-in operations. The scheduler computes the resource utilisation periodically, maintaining a window with the past w measurements. Upper and lower thresholds define the interval of utilisation levels that are considered normal. After each measurement, the scheduler obtains a utilisation forecast for the next time interval using weighted exponential smoothing. If the past u measurements and the forecast are below (above) the lower (upper) threshold, the scheduler triggers a scale-in (scale-out) operation. In order to decide the number of resources that should be released or allocated from the cloud, we propose the following auto-scaling strategies. 1) Utilisation-based Auto-scaling Triggering: Let Wt be the volume of machine utilisation at time t. The current system t utilisation is estimated as W mt . In the Utilisation-based Auto-scaling Triggering (TU) strategy, the provider sets parameters H and L, 0 ≤ L ≤ H ≤ 1, indicating utilisation thresholds according to which machines are activated and deactivated, respectively. When choosing the values for these parameters, an administrator wants to avoid situations where the system performs conflicting auto scaling operations in consecutive steps (e.g., scale out takes place immediately after a scale in operation). This t situation happens if W =⇒ Wt > Hmt and mt > H Wt mt +λm < L =⇒ Wt < L(mt + λm) hold simultaneously. In order to avoid this issue, the following inequality must be valid: Hmt > L(mt + λm) H mt + λm > L mt H λm > 1+ . L mt Analogously, it is not desirable to have a situation where the system deactivates machines in one step and activates in the
following step under the same conditions of system utilisation. Because b > 0, we know that mt − λm should be greater than t zero. Therefore, this situation will happen if W mt < L =⇒ Wt Wt < Lmt and mt −λm > H =⇒ Wt > H(mt − λm) hold simultaneously. This problem is avoided if H λm >1+ . L mt − λm From both inequalities, it follows that 1 + mtλm −λm . But we have that
H L
• •
≥ 1 + λm mt and
λm mt − λm mt
>
λm mt mt − λm
λm
>
0,
>
reduce the number of resources allocated by exploiting the heterogeneity in user patience. We evaluated the following techniques for task scheduling and auto-scaling triggering:
H L
≥
λm so both inequalities are satisfied if H L ≥ 1 + mt −λm . Because we are assuming that the system provider will keep at least b machines active, we have that mt − λm ≥ b. Therefore, the parameters have to obey the relation below:
λm H >1+ . (1) L b From the inequality above, one derives an upper bound for the step size s = λm. This value is typically high, so the administrator of a cloud service can choose a multiplicative factor γ ∈ [0, 1] indicating the strategy’s “aggressiveness”. The step size will be of s(1 − γ) and of sγ resources for scale-in and scale-out operations, respectively. 2) Utilisation- and Patience-based Auto-scaling Triggering: In the TU strategy, γ is fixed, so the cloud system will always have the same behaviour (aggressive or conservative). Moreover, the perception that users have from the current QoS provided by the cloud server is ignored. The Utilisationbased and Patience-based Auto-scaling Triggering (TUP) strategy leverages TU by employing user patience in order to set dynamically the value of γ. Let Kˆt denote the average value of kj for all the jobs in the server (either enqueued or in execution). Whenever the system decides that an auto-scaling operation should be performed, a sequence S containing the last k averages Kˆt is created and has some percentage of its largest and smallest values removed. Finally, from the remaining elements of S, the system takes the largest value K. Finally, the value of γ ˆt ˆt K will be K K and 1 − K for scale out and scale in operations, respectively. Basically, TUP was designed to adapt the system behaviour according to the current average patience level of users. Namely, if Kˆt is high, a more aggressive policy is acceptable. Conversely, if Kˆt is low, a conservative approach could support the improvement of QoS. IV. E VALUATION We conducted extensive computational experiments in order to verify whether the proposed technique for auto-scaling can
•
FIFO+TU: First-In-First-Out scheduling with autoscaling considering only resource utilisation; LPF+TU: LPF scheduling with auto-scaling considering resource utilisation; LPF+TUP: LPF scheduling with auto-scaling considering resource utilisation, and the users’ patience to define the resource step size of scale-out and scale-in operations.
We examined the trade-off between patience and resource allocation considering the following metrics: •
•
Percentage of dissatisfactions: Percentage of jobs j for which the patience of their respective users u(j) were below τu(j) after the execution of j. Allocated resource-time: Resource capacity—in machine seconds—allocated to serve user requests.
The rest of this section describes the experimental set-up and the analysis of the obtained results.
A. Experimental Set-up A discrete event simulator built in house was used to evaluate the performance of the auto-scaling techniques. To model the load of the service provider, we crafted two types of workloads with variable numbers of users over a 24-hour period as shown in Figure. 3. The rationale behind these workloads is described as follows: •
•
Normal day: consists of small peaks of utilisation during the start, middle, and end of work hours. Outside these intervals, but still in work hours, this workload remains around the peak values, while outside the working hours it goes down significantly. Peaky day: consists of tipping workload peaks, a typical scenario in corporations near the end of quarters and semesters. The configuration is used to test the solution’s behaviour handling stress situations.
Jobs have an execution time of 10 seconds, whereas a user’s expectation on the response time of a job j is drawn uniformly from the average job length to a positive multiplicative factor of job length (i.e. ρβo(j,t) defined in Section III is 1.2). For users in the system, the job inter-arrival time is drawn uniformly from 0 to 100 seconds. We vary the maximum number of resources that can be allocated from the cloud from 162 to 180 and set the initial capacity to 25% of the maximum made available by the provider to the target customer. The lower and upper target thresholds for resource utilisation (i.e. L and H) are 40% and 70% respectively.
User dissatisfaction on the normal workload
Scenario 90
Normal
80
LPF+TU
14
70
User dissatisfaction (%)
Total system utilisation (%)
FIFO+TU
16
Peaky
60 50 40 30
12 10 8 6 4
20 2 10 0
3
6
9
12
15
18
21
0
24
162
164
166
168
Hour
B. Result Analysis Scheduling Techniques. We first evaluate the percentage of dissatisfactions under both FIFO+TU and LPF+TU techniques. Figures 4 and 5 present the results for this metric under normal and peaky workloads respectively. Peaky produces higher percentage of dissatisfactions due to abrupt increases in system utilisation. Although FIFO+TU is expected to provide fairness regarding response time and consequently a balance in user satisfaction, overall LPF+TU was considerably better according to the optimisation metric. LPF+TU brought more benefit compared to FIFO+TU under normal workload because the scheduler had more margin of manoeuvre due to the higher number of patient users whose satisfaction level could be slightly reduced. Finally, the same auto-scaling technique was employed in both configurations, so resource consumption was equal. Auto-scaling Decisions. Figures 6 and 7 show percentage of dissatisfactions for LPF+TU and LPF+TUP under normal and peaky workloads, respectively. We observe that overall, both auto-scaling techniques perform equally considering percentage of dissatisfactions. For a few scenarios, such as with 162 (Normal) and 164 (Peaky) resources, performing scaling based on utilisation is marginally better than using utilisation and patience, a phenomenon that the number of resources allocated by TUP may be too low for situations where system load grows abruptly, leading to bad QoS. With respect to allocated resource-time, LPF+TUP was superior to LPF+TU. LPF+TUP reduces the number of resources because the scheduler checks whether average user patience is still under control before taking a scale-out decision; if this is the case, the scheduler does not allocate addi-
172
174
176
178
180
Fig. 4. Percentage of dissatisfaction for FIFO+TU and LPF+TU with load based auto-scaling trigger on normal workload.
User dissatisfaction on the peaky workload FIFO+TU
25
User dissatisfaction (%)
Fig. 3. The two types of workloads. For each hour in a given day, the load found in each workload represents a percentage of the maximum number of users that could be present in the system. For example, suppose nu represents the maximum possible number of users found in the system. If nu = 100, in hour 0 of the “Normal” workload, there are 30 users in the system. The number is approximate as we added a random variation of 5%.
170
Resources
LPF+TU
20
15
10
5
0
162
164
166
168
170
172
174
176
178
180
Resources
Fig. 5. Percentage of dissatisfaction for FIFO+TU and LPF+TU with load based auto-scaling trigger on Peaky workload.
tional resources to handle the load. Similarly, if the number of resources can be decreased and the average patience is acceptable, it removes more resources than LPF-TU. Figures 8 and 9 show the number of resources allocated over time for LPF+TU and LPF+TUP respectively under peaky workload, and similar results were obtained for the normal workload. Dashed rectangles show the main differences between the two approaches. Finally, Figures 10 and 11 show that LPF-TUP beats LPF-TU in savings on the overall allocated resourcetime by up to 8% for peaky and 4% for normal workloads, respectively. V. R ELATED W ORK Projects related to our work fall into categories of scheduling, user behaviour, and cloud computing auto-scaling.
User dissatisfaction on the normal workload LPF+TU
6
LPF+TUP
User dissatisfaction (%)
5 4 3 2 1 0
162
164
166
168
170
172
174
176
178
180
Resources
Fig. 6. Percentage of dissatisfaction for LPF+TU and LPF+TUP with load based auto-scaling trigger on Normal workload.
Fig. 8. Number of resources over time for LPF+TU auto-scaling approach on Peaky workload.
User dissatisfaction on the peaky workload LPF+TU
14
LPF+TUP
User dissatisfaction (%)
12 10 8 6 4 2 0
162
164
166
168
170
172
174
176
178
180
Resources
Fig. 7. Percentage of dissatisfaction for LPF+TU and LPF+TUP with load based auto-scaling trigger on Peaky workload.
Scheduling is a well-studied topic in several domains for which the number of theoretical problems, solution approaches, and practical applications is considerably large [5], [6]. Commonly used algorithms include FIFO, priority-based, deadline-driven, hybrid approaches that use backfilling techniques [7], among others [8], [9]. In addition to priorities and deadlines, other factors have been considered, such as fairness [10], energy-consumption [11], and context-awareness [12]. Moreover, utility functions were used to model how the importance of results to users varies over time [13], [14]. User behaviour has been explored for optimising resource management in the context of web caching and page prefetching [15], [16], [17], [18], [19], [20]. The goal in these works is to understand how users access web pages, to investigate their tolerance level on delays, and to pre-fetch or
Fig. 9. Number of resources over time for LPF+TUP auto-scaling approach on Peaky workload.
modify page content to enhance user experience. Techniques in this area focus mostly on web content and minimising response time of user requests. Service research has also investigated the impact of delays in users’ behaviour. For instance, Taylor [21] described the concept of delays and surveyed passengers affected by delayed flights to test their hypotheses. Brown et al. [22] and Gans et al. [23] investigated the impact of service delays in call centres. In behavioural economics, Kahneman and Tversky [4] introduced prospect theory to model how people make choices in situations that involve risk or uncertainty. Netto et al. [3] introduced a scheduling strategy that considers information on how fast users consume results generated by service providers. Our previous work [2] investigated the scheduling of user requests considering their patience and expectations, but with no auto-scaling of cloud resources.
Resource-time usage on the normal workload
Resource-time usage (s)
1.0 ×10
7
LPF+TU
and/or utilisation information, and one shortcoming of these approaches is that actual users’ needs with regards to their expectations and patience levels are ignored. As a consequence, they over-provision resources in situations where that is not strictly needed.
LPF+TUP
0.8
0.6
0.4
0.2
0.0
162
164
166
168
170
172
174
176
178
180
Resources
Fig. 10. Comparison of the resource-time usage for both LPF+TU and LPF+TUP on the Normal workload.
Resource-time usage on the peaky workload 9 ×10
6
LPF+TU
LPF+TUP
Resource-time usage (s)
8 7 6 5 4 3 2 1 0
162
164
166
168
170
172
174
176
178
180
We modelled user patience based on prospect theory and performed extensive experiments considering FIFO and Lowest Patience First scheduling combined with auto-scaling based on utilisation level. FIFO is a scheduling strategy that brings several fairness benefits, which can potentially balance quality of service among users of a cloud service. However, it has limitations on understanding individual user expectations and patience. Our results show that if this aspect is to be taken into account, Lowest Patience First scheduling is clearly better. We then evaluated how auto-scaling operations that consider utilisation and patience would benefit users and cloud providers. The main conclusion is that the proposed autoscaling trigger has great potential to reduce resource capacity without impacting negatively in the users’ satisfaction. Even though this brings benefits mainly to cloud providers, eventually such benefits can be brought to users in the form of reduced prices. The method by which this benefit is achieved comes from the understanding of how auto-scaling operations can be further tuned with the verification of user patience and how users tolerate eventual drops in QoS. We believe that the proposed technique fills an existing gap in the literature. Moreover, as sensors become more pervasive, factors that influence users’ patience and needs are starting to be better understood. On the top of this data, it will certainly be possible to specialize and improve the techniques presented in this work.
Resources
R EFERENCES Fig. 11. Comparison of the resource-time usage for both LPF+TU and LPF+TUP on the Peaky workload.
Shen et al. [24] presented a system to automate elastic resource scaling for cloud computing environments. Their system does not require prior knowledge about the applications running in the cloud. Other projects consider auto-scaling in different scenarios, such as auto-scaling for MapReduce applications [25], [26], vertical versus horizontal auto-scaling [27], operational costs [28], and integer model based autoscaling [29] . Unlike previous work, our proposed auto-scaling technique considers information on user patience while interacting with the service provider. VI. C ONCLUSIONS This paper introduced a scheduling algorithm and an autoscaling technique based on user patience. Traditional resource allocation and auto-scaling techniques are based on load
[1] J. Ramsay, A. Barbesi, and J. Preece, “A psychological investigation of long retrieval times on the world wide web,” Interacting with computers, vol. 10, no. 1, pp. 77– 86, 1998. [2] C. Cardonha, M. D. Assunc¸a˜ o, M. A. S. Netto, R. L. F. Cunha, and C. Queiroz, “Patience-aware scheduling for cloud services: Freeing users from the chains of boredom,” in Proc. of the 11th International Conference on Service Oriented Computing (ICSOC’13), 2013. [3] M. A. S. Netto et al., “Leveraging attention scarcity to improve the overall user experience of cloud services,” in Proc. of the Int. Conf. on Network and Service Management (CNSM’13), 2013. [4] D. Kahneman and A. Tversky, “Prospect theory: An analysis of decision under risk,” Econometrica: Journal of the Econometric Society, pp. 263–291, 1979. [5] J. Blazewicz, K. Ecke, G. Schmidt, and J. Weglarz, Scheduling in Computer and Manufacturing Systems, 2nd ed., 1994. [6] M. L. Pinedo, Planning and Scheduling in Manufacturing and Services, 2nd ed., 2007.
[7] D. Tsafrir, Y. Etsion, and D. G. Feitelson, “Backfilling using system-generated predictions rather than user runtime estimates,” IEEE Transactions on Parallel and Distributed Systems, vol. 18, no. 6, pp. 789–803, 2007. [8] T. D. Braun et al., “A comparison of eleven static heuristics for mapping a class of independent tasks onto heterogeneous distributed computing systems,” Journal of Parallel and Distributed computing, 2001. [9] D. G. Feitelson, L. Rudolph, U. Schwiegelshohn, K. C. Sevcik, and P. Wong, “Theory and practice in parallel job scheduling,” in Workshop on Job Scheduling Strategies for Parallel Processing (JSSPP’97), 1997. [10] N. D. Doulamis, A. D. Doulamis, E. A. Varvarigos, and T. A. Varvarigou, “Fair scheduling algorithms in grids,” IEEE Transactions on Parallel and Distributed Systems, vol. 18, no. 11, pp. 1630–1648, 2007. [11] J.-F. Pineau, Y. Robert, and F. Vivien, “Energy-aware scheduling of bag-of-tasks applications on master– worker platforms,” Concurrency and Computation: Practice and Experience, vol. 23, no. 2, pp. 145–157, 2011. [12] M. D. Assunc¸a˜ o et al., “Context-aware job scheduling for cloud computing environments,” in Proceedings of the 5th IEEE Int. Conf. on Utility and Cloud Computing (UCC), 2012. [13] C. B. Lee and A. Snavely, “Precise and realistic utility functions for user-centric performance analysis of schedulers,” in Proceedings of the Int. Symp. on HighPerformance Distributed Computing (HPDC’07), 2007. [14] A. AuYoung et al., “Service contracts and aggregate utility functions,” in 15th IEEE Int. Symp. on High Performance Distributed Computing (HPDC’06), 2006. [15] D. F. Galletta, R. M. Henry, S. McCoy, and P. Polak, “Web site delays: How tolerant are users?” Journal of the Association for Information Systems, vol. 5, no. 1, pp. 1–28, 2004. [16] F. Alt, A. Sahami Shirazi, A. Schmidt, and R. Atterer, “Bridging waiting times on web pages,” in 14th Int. Conf. on Human-computer interaction with mobile devices and services (MobileHCI’12). New York, NY, USA: ACM, 2012, pp. 305–308. [17] R. Atterer, M. Wnuk, and A. Schmidt, “Knowing the user’s every move: user activity tracking for website usability evaluation and implicit interaction,” in 15th Int. Conf. on World Wide Web (WWW’06). New York, NY, USA: ACM, 2006, pp. 203–212. [18] C. R. Cunha and C. F. B. Jaccoud, “Determining www user’s next access and its application to pre-fetching,” in 2nd IEEE Symp. on Computers and Communications
(ISCC ’97), Washington, DC, USA, 1997, pp. 6–. [19] N. Bhatti, A. Bouch, and A. Kuchinsky, “Integrating user-perceived quality into web server design,” Computer Networks, vol. 33, no. 1, pp. 1–16, 2000. [20] A. Bouch, A. Kuchinsky, and N. Bhatti, “Quality is in the eye of the beholder: meeting users’ requirements for internet quality of service,” in Proceedings of the SIGCHI conference on Human factors in computing systems. ACM, 2000, pp. 297–304. [21] S. Taylor, “Waiting for service: the relationship between delays and evaluations of service,” The Journal of Marketing, pp. 56–69, 1994. [22] L. Brown, N. Gans, A. Mandelbaum, A. Sakov, H. Shen, S. Zeltyn, and L. Zhao, “Statistical analysis of a telephone call center: A queueing-science perspective,” Journal of the American Statistical Association, vol. 100, pp. 36–50, 2005. [23] N. Gans, G. Koole, and A. Mandelbaum, “Telephone call centers: Tutorial, review, and research prospects,” Manufacturing & Service Operations Management, vol. 5, no. 2, pp. 79–141, 2003. [24] Z. Shen, S. Subbiah, X. Gu, and J. Wilkes, “Cloudscale: elastic resource scaling for multi-tenant cloud systems,” in Proc. of the 2nd ACM Symposium on Cloud Computing. ACM, 2011, p. 5. [25] Y. Chen, S. Alspaugh, and R. Katz, “Interactive analytical processing in big data systems: A cross-industry study of mapreduce workloads,” Proc. VLDB Endow., 2012. [26] Z. Fadika and M. Govindaraju, “DELMA: Dynamically ELastic MapReduce Framework for CPU-Intensive Applications,” in Proc. of the 11th IEEE/ACM International Symposium on Cluster, Cloud and Grid Computing (CCGrid’11), 2011, pp. 454–463. [27] M. Sedaghat, F. Hernandez-Rodriguez, and E. Elmroth, “A virtual machine re-packing approach to the horizontal vs. vertical elasticity trade-off for cloud autoscaling,” in Proc. of the ACM Cloud and Autonomic Computing Conference (CAC’13). ACM, 2013. [28] M. Mao and M. Humphrey, “Auto-scaling to minimize cost and meet application deadlines in cloud workflows,” in Proc. of the Int. Conf. for High Performance Computing, Networking, Storage and Analysis (SC). IEEE, 2011, pp. 1–12. [29] M. Mao, J. Li, and M. Humphrey, “Cloud auto-scaling with deadline and budget constraints,” in Proc. of the 11th IEEE/ACM International Conference on Grid Computing (GRID). IEEE/ACM, 2010, pp. 41–48.