Apr 1, 2011 - Multi-domain search, Graphical User Interface, Exploratory. Search, Web .... name and a collection of attributes (single or multi-valued) exposed by .... the query itself by exploring the available services and their connections ...
WWW 2011 – Demo
March 28–April 1, 2011, Hyderabad, India
Exploratory Search in Multi-domain Information Spaces with Liquid Query Alessandro Bozzon, Marco Brambilla, Stefano Ceri, Piero Fraternali, Salvatore Vadacca Politecnico di Milano P. Leonardo da Vinci, 32. 20133, Milano, Italy
[firstname.lastname]@polimi.it The Search Computing project (www.search-computing.eu) is tackling this issue by designing: a query language that addresses the structure of complex queries, organized as conjunctive expressions over search services covering different domains [1]; a query processing framework consisting of query translation to an executable plan, its optimization, and its execution [3][4], which produces results in the form of object combinations, ordered according to a global rank (e.g. [12]); and a user interaction paradigm called Liquid Query that give users maximum flexibility in exploring the result [5], by producing more “result combinations”, or “more results from a specific service”, or “performing an expansion of the results” by adding new domains of interest. This is in line with the spirit of past results of the exploratory search discipline [7][9][11].
ABSTRACT Search Computing (SeCo) aims at building search applications that bridge the gap between general-purpose and vertical search engines [1][2]. SeCo queries extract ranked information about several interconnected domains, such as “hotels”, “restaurants” or “concerts”, by interacting with Web data sources which are wrapped as search services; an example of query is: “Find a good Jazz concert close to the user’s current location, together with close-by good restaurants and hotels”. The SeCo system supports the deployment of search applications, by providing a generic software architecture and the tools for service and query registration, for query formulation and execution, and for result browsing. In this demo paper, we focus on the Liquid Query (LQ) interface which supports the iteration over query formulation, result visualization and query refinement, with commands for perusing the result set, changing the visualization of data based on their type (e.g., geographical or temporal) and interacting with the remote search services. It also supports an exploratory search approach, where the user starts by accessing one data source (e.g., an event listing for finding interesting concerts), then is assisted in progressively joining other correlated sources in an interactive exploration of the search space. The exploration paths can be chosen on the fly and the navigation history can be browsed back and forth for cross-checking the retrieved options.
Liquid Query acts as a facilitator in the exploration process: it covers most of the phases of the information seeking funnel [14] and, according to the information foraging theory [13], increases the information acquisition efficiency at the single patch level (thanks to combinations) and reduces the effort for moving from one patch to the other (thanks to search expansion mechanisms). The usage of search computing systems is appropriate for tasks that lie just after the boundary of the note-taking limit in exploratory search [10], where the complexity of the search task and of the associated information is quite high, and the exploration of the options plays an important role in finding the ideal solution.
Categories and Subject Descriptors
In this demo, we show how queries can be dynamically defined and extended in the user search session. By means of such paradigm, the user is supported in expressing fully exploratory queries, starting by constructing a network of connected resources, each corresponding to a clearly identified real-world concept (e.g., hotel, flight, hospital, doctor), and correlated by predefined semantic links (hotels are close to restaurants, doctors cure diseases and are located at hospitals). In such setting, the system must be able of supporting query expansion and result tracking, giving the user the possibility to move “forward” (adding one node) and “backward” (deleting one node) along the exploration history; or of dynamically selecting and deselecting the object instances of interest.
H.5.4 [Information Interfaces and Presentation]: Hypertext/ Hypermedia. H.3.3 [Information Storage and Retrieval]: Information Search and Retrieval – search process, query formulation
General Terms Design, Experimentation
Keywords Multi-domain search, Graphical User Interface, Exploratory Search, Web data integration
1. INTRODUCTION User interfaces of search engines, i.e. of the most popular entry points to the Web, are based on keywords. Such a query interface, however, is inadequate to express complex search queries that involve several domains of interest. Furthermore, the one shot query and response paradigm is not sufficient to address the need for information exploration and comparison that is intrinsic to such complex search tasks.
We demonstrate how the intertwining of appropriate result visualization and exploration steps can facilitate the user in his information seeking tasks. In particular, we illustrate a set of results presentation options, including tabular representations, which presents combinations as a whole, and atom views, which visualize instances of different objects in separate lists, and at the same time displaying the combinations they belong to and their global rank. This view allows users to focus at each step on the new results, and therefore is most suitable for a progressive exploration; moreover, the atom view paradigm is simpler and therefore can be exported to a mobile scenario.
Copyright is held by the International World Wide Web Conference Committee (IW3C2). Distribution of these papers is limited to classroom use, and personal use by others. WWW 2011, March 28–April 1, 2011, Hyderabad, India. ACM 978-1-4503-0637-9/11/03.
189
WWW 2011 – Demo
March 28–April 1, 2011, Hyderabad, India
either both tagged as output (yielding to a parallel join) or one is tagged as output and the other one is tagged as input (yielding to a pipe join).
The supported search tasks go beyond the typical one-shot, memory-less interaction with a search engine, and span over several steps, with the possibility of suspending and resuming the work (e.g., perform the search process in different days). In our demonstration we highlight the exploration and interaction issues, together with the architectural and query execution challenges they pose to an engine that need to actually perform the queries.
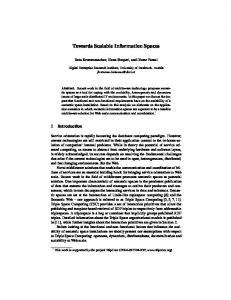
Access patterns are next refined into service interfaces, including a name and an endpoint of a concrete search service. The actual service invocation is managed by the Execution Engine, which supervises the interaction with several wrappers used to access Web APIs and databases. Queries enter the system at the Liquid Query user interface, which is a client-side component that allows users to perform predefined queries, by filling-in runtime parameters through a form, or exploratory search. In both cases, queries are submitted to the Query Orchestrator, a server side component that manages queries, results caching, and user’s sessions. A new query consists of a conjunction of predicates over data sources, join predicates to express connections of the sources, and a global rank criterion for sorting the result set. Each query undergo an analysis and translation process, managed by the Query Analyzer, which produces the Query Execution Plan (QEP), which is a graph of low-level components that specifies the activities to be executed (e.g., the service calls), their order of precedence, and the strategy to execute joins. The plan is output by the Query Optimizer, which chooses the join implementation (e.g., parallel vs. pipe join) and sets the parameters of the join execution strategy (e.g., the number of times a service is called to retrieve the top-k results of the query). A QEP is executed by the Execution Engine, which analyses and breaks it recursively into subcomponents, which in turn are either QEPs or atomic service invocations. The results of service calls are accumulated by the engine, which builds progressively the combinations constituting the query response, which are submitted back to the Liquid Query interface for visualization and interaction.
3. THE LQ DEMO
Figure 1: The Search Computing architecture
The demo implements a multi-domain search scenario over a set of heterogeneous data sources, and focuses on interaction primitives and visualization techniques for supporting complex search tasks. During the demo, users will search for concerts in a theatre close to a specified location, and good restaurants and hotels at walking distance. Subsequently, users may want to explore other information, such as news associated to the concert, close by public transportation stations, and so on.
2. THE SECO ARCHITECTURE The Liquid Query demo sits on top of an architecture that covers all the phases necessary for formulating and processing multidomain search queries (Figure 1). SeCo queries can be addressed to a constellation of Web data sources, including search engine APIs, products, events and people databases (e.g., Amazon, Eventful, LinkedIn), scientific data sources (e.g., DBPL, PubMed), and community curated data sources (e.g., YQL Open Data Tables, DBpedia). These data sources are registered in the system using the Service Mart Repository, which contains a multi-level description of the callable search services [6]. At the most conceptual level, sources are registered as service marts and characterized by the service name and a collection of attributes (single or multi-valued) exposed by the service.
As a preliminary step to query processing, the demo will show the registration of service marts, access patterns and physical service interfaces for the Concert and Restaurant objects and their connections. For example, a Concert will be described by the following service mart: Concert (Title, Venue, Genre, Price, Address, Performances(Date, Time))
where Venue, Title, Genre, Price, Address are single-value attributes and Performances is a multi-valued attribute, in turn described by the single-valued attributes Date and Time.
Such abstract description is refined into one or more access patterns, i.e., logical signatures that specify whether each attribute is either an input or an output in the service call; output attributes are tagged as ranked if the service produces results ordered on the value of that attribute. Access patterns can be joined, when parameters of one service mart match, both for type and meaning, the output parameters of another mart, and these parameters are
3.1 Query formulation and refinement The demo will start with the simplest form of interaction: the execution of pre-defined queries. A pre-defined query is a conjunctive formula over access patterns, equipped with a set of possible ranking criteria; for instance, the query “Find a combination of jazz concerts and vegetarian restaurants near
190
WWW 2011 – Demo
March 28–April 1, 2011, Hyderabad, India
objects within an Atom view (in which case all the combinations it belongs to and associated objects are highlighted, see Figure 4).
Times Square, NY.” Such queries are defined by an expert user and deployed in the Liquid Query interface as a configuration file, which is used to build a form-based widget for the end user to insert the runtime parameters (e.g., “jazz, vegetarian, Times Square NY”) and submit the query. The query configuration may also contain the specification of additional access patterns that can be used to expand the query, by exploring information connected to the objects of the results set. The attendees will be given the opportunity to try several queries and interact with various visualizations and commands on the result set. A query result set is a set of combinations ranked by a global ranking function: each combination is constituted by different objects, each extracted from an individual services mart. The objects in a combination are joined according to the access patterns specified in the query; combinations are filtered according to selection conditions. The result set is ranked, according to a global ranking criterion, which usually considers local rank attributes of objects (e.g., rating attributes, prices of products and services) or rank attributes of object tuples (e.g., the distance between objects).
Figure 3: The Atom View, which shows individual objects and their combinations, with local and global rankings. The components of the selected combination are highlighted.
Figure 4: The Atom View after the exploration of recent News about a concert. One additional atom appears. By selecting one object (i.e., the piece of news), all the connected objects and all the respective combinations are highlighted. Figure 2: The Tabular View; each row represents a combination including one instance of each object.
3.2 Type-dependent data visualization Types of result data can be used to provide type-dependent visualizations of objects and their relationships [8]. Among them, one (Figure 5) exploits the geographic coordinates for the involved objects, by representing them in a map: each object is shown as an icon, and the local ranking (e.g., the price of the Hotel or the rating of the Restaurant) is represented by the size of the icon. A combination is then represented by a set of different icons, which are highlighted when the combination is selected. The second visualization, shown in Figure 6, uses the timeline paradigm for displaying Concert objects, which occur at different dates.
The Liquid Query demonstration will first present the simplest result set visualization, i.e. the Tabular View (Figure 2). In the Tabular View, combinations are presented as rows, sorted with respect to the global rank. Service mart attributes are presented as columns, grouped by domain. Derived attributes (e.g., calculated distances, total prices) are also shown as columns. The attendees will have the possibility of perusing the result set, with commands for view control (hiding and showing of columns, grouping on values, filtering, ordering). Some commands allow refining the query by interacting with the Orchestrator: e.g., users can ask for more results from one or more services or change the rank criterion. A special command is query expansion, which enables a controlled form of exploration: the attendee will select one or more combinations of interest and ask for novel information on some of the included objects (e.g., chosen a Concert, ask for information about the recent News associated with it). After familiarizing with the Tabular View, the demo will explore other data visualizations, including the so-called Atom View (Figure 3). This view is useful to highlight the local population and ranking individual service marts, which are less visible in the Tabular View, by showing the object’s name (or any suitable identifier), while more properties can be asked for separately. Users can select combinations (in which case all objects forming the currently selected combination are highlighted, Figure 3) or
191
WWW 2011 – Demo
March 28–April 1, 2011, Hyderabad, India
change the selection of combinations or to refresh the results before trying a new exploration in a different direction.
Figure 5: Visualization of objects and combinations based on geographical location, with explicit ranking information.
5. DEMO HIGHLIGHTS The demo will show both the use of predefined queries and of exploratory sessions, upon collections of services representing a variety of concepts registered within the Service Mart Repository. Users will select the best answers and then inspect additional properties that are reachable from such answers. In the demo, we will show that they can look for concerts and hotels, and the additionally look for news and reviews related to concerts, restaurants close to hotels, public transports reaching the concert venue and so on. We plan to use generic services covering the US (such as GoogleMovie or YQL data tables); users will be able to compare plans built by the system with their expectations. Figure 6: Visualization of multidimensional data based on temporal location (or other visualization)
We will also highlight the challenges posed by the execution of exploratory/incremental queries by describing the distribution of tasks between the query engine and the choreographer, where the former executes one-shot queries and the latter maintains the history of the exploration session.
This visualization highlights the relationships between Concerts and Restaurants – note that the first concert builds one combination while the second concert builds three combinations; the distance between concert and restaurant is visualized. As in Figure 5, each object has a different icon, and the local ranking is represented by the size of the icon.
Acknowledgements. This research is funded by European Research Council, under the IDEAS Advanced Grants program.
6. REFERENCES [1] Ceri, S., and Brambilla, M. (Eds.) 2010. Search Computing Challenges and Directions. Lecture Notes in Computer Science, Springer-Verlag, vol. 5950, April 2010. [2] Ceri, S. and Brambilla, M. (Eds.) 2011. New Trends in Search Computing. Lecture Notes in Computer Science, Springer-Verlag, vol. 6585, March 2011, in print. [3] Ceri, S., Braga, D., Corcoglioniti, F., Grossniklaus, M., and Vadacca, S. 2010. Search Computing. Keynote speech at ICOODB, Zurich, September 2010. [4] Braga, D., Ceri, S., Daniel, F., and Martinenghi, D. 2008. Optimization of Multi-Domain Queries on the Web. In Proceedings of VLDB 2008, Auckland, August 2008. [5] Bozzon, A., Brambilla, M., Ceri, S., and Fraternali, P. 2010. Liquid Query: Multi-Domain Exploratory Search on the Web. In Proceedings of WWW 2010, Raleigh, pp. 161-170. [6] Campi, A., Ceri, S., Maesani, A., and Ronchi, S. 2010. Designing Service Marts for Engineering Search Computing Applications. In Proc. of ICWE 2010, Wien, July 2010. [7] De Vries, A., Alink, W., Cornacchia, R. 2010. Search by strategy. ESAIR Workshop at CIKCM'10, pp. 27-28. [8] Huynh, D. , Karger, D. , Miller, R. 2007. Exhibit: lightweight structured data publishing. WWW Conf. 2007, pp.737-746. [9] Kuhlthau, C. C. 2005. Kuhlthau’s information search process. Theories of information behavior, pp. 230-234. Medford, NJ: Information Today (2005). [10] Kumar, R., Tomkins, A. 2009. A Characterization of Online Search Behaviour, Data Engineering Bullettin, June 2009 Vol. 32 N. 2. (2009) [11] Marchionini, G. 2006. Exploratory search: from finding to understanding. Commun. ACM 49(4): 41-46. (2006) [12] Martinenghi, D. and Tagliasacchi, M. 2010. Proximity-Rank Join. In Proceedings of VLDB 2010, Singapore. [13] Pirolli, P., Stuart, K. C. 1999. Information Foraging. Psychological Review. Vol. 106(4), Oct 1999, pp. 643-675. [14] Rose, D. 2008. The information seeking funnel. National Science Foundation workshop on Information-Seeking Support Systems (ISSS), June 26-27, Chapel Hill, NC (2008)
4. EXPLORATORY SEARCH The demo will also demonstrate the exploratory search interaction paradigm. Starting from an initial status with no predefined query, the user can perform a progressive, step-by-step construction of the query itself by exploring the available services and their connections, as supported by the Service Mart Repository. A user can start from anyone of the Concert, Restaurant and Hotel concepts and progressively build the query, which eventually can include all these three concepts, as shown by Figures 3 and 4. Initially, a user submits some initial search criteria referred to a single object (e.g., find a jazz concert near Times Square, NYC, on May, 27th), and the query retrieves instances of that object. Then, the query consists of three steps. The user may select a subset of these instances (e.g., the Don Friedman Trio concert), then proceed to the selection of the next object to explore (e.g., a nearby Restaurant), then add some selection condition on the object (e.g., to be vegetarian); this yields to a new QEP which, in conjunction with the previous query, yields to a new query. The three steps can be repeated on other objects that are reachable from concerts and restaurants, thereby allowing the exploration of an arbitrary number of interconnected concepts. The system supports result tracking, giving the user the possibility of moving “forward” (by adding one concept) and “backward” (by deleting one concept). The selection of the possible exploration directions starts from the concepts currently part of the result schema; the list of possible forward and backward moves is shown to users at each stage of the exploration. For instance, starting from a concert, one can decide to explore by geographical distance the close-by relevant objects (restaurants, hotels, stations, and so on) or by terminological distance the associated news (as shown in the result set of Figure 4). The exploration path is shown as an ordered set of breadcrumbs, which allows the user to see the steps explored so far in terms of selected concepts and, eventually, to backtrack the exploration by clicking on a node in the path. Then, the user may choose to
192