IEEE TRANSACTIONS ON VISUALIZATION AND COMPUTER GRAPHICS, VOL. 17, NO. 12, DECEMBER 2011
2489
Exploring Ambient and Artistic Visualization for Residential Energy Use Feedback Johnny Rodgers and Lyn Bartram, Member, IEEE Abstract—Providing effective feedback on resource consumption in the home is a key challenge of environmental conservation efforts. One promising approach for providing feedback about residential energy consumption is the use of ambient and artistic visualizations. Pervasive computing technologies enable the integration of such feedback into the home in the form of distributed point-of-consumption feedback devices to support decision-making in everyday activities. However, introducing these devices into the home requires sensitivity to the domestic context. In this paper we describe three abstract visualizations and suggest four design requirements that this type of device must meet to be effective: pragmatic, aesthetic, ambient, and ecological. We report on the findings from a mixed methods user study that explores the viability of using ambient and artistic feedback in the home based on these requirements. Our findings suggest that this approach is a viable way to provide resource use feedback and that both the aesthetics of the representation and the context of use are important elements that must be considered in this design space. Index Terms—Ambient visualization, informative art, casual infovis, sustainability, distributed visualization.
I NTRODUCTION Supporting sustainable resource use in the home requires a range of visualization techniques to aid informed decision-making. Distributed sensing and data collection mechanisms are making a wealth of data about resource consumption available to residents [3][5][15]. Visualizing this information in ways that are meaningful and contextually appropriate can help to bridge the gap between data and informed decisions about how to sustainably use resources. Current techniques include traditional software tools designed to support in-depth analysis and review. However, they do not support at-a-glance awareness. Moreover, they are typically not designed to integrate cohesively with the home, often residing on personal computers. Numerous researchers have pointed out that we cannot just import established visualization techniques to non-work environments [1][2][24][25]. Contextualizing feedback for these environments means considering a range of user attention from ambient to focused, appropriate placement of devices to support daily activities, and balancing aesthetic appeal and usefulness [29]. We cannot expect residents to refer to a laptop or mobile phone every time they make a resource use decision. Instead, we seek to enable occupants in making informed resource use decisions without imposing undue technological complexity or effort. A promising approach in this domain is the provision of ambient and artistic feedback integrated into the domestic environment. We believe subtle application of these techniques can reduce demands for attention and interaction and engage residents otherwise unaware of the impacts of their resource use. In order to integrate with daily routines, we focus on distributed point-of-consumption feedback devices designed to support awareness and decision-making in daily use-contexts. We are motivated by our experience in designing both traditional and ambient visualizations for two sustainable homes showcased at the 2009 International Solar Decathlon and the 2010 Olympics respectively and the visitor enthusiasm for our nontraditional display prototypes. • Johnny Rodgers is a recent Master of Science graduate from the School of Interactive Arts + Technology, Simon Fraser University, E-Mail:
[email protected]. • Lyn Bartram is an Assistant Professor at the School of Interactive Arts + Technology, Simon Fraser University, E-Mail:
[email protected]. Manuscript received 31 March 2011; accepted 1 August 2011; posted online 23 October 2011; mailed on 14 October 2011. For information on obtaining reprints of this article, please send email to:
[email protected]. 1077-2626/11/$26.00 © 2011 IEEE
Our goal is to explore the feasibility of ambient informative art visualizations in this domain and to examine issues relating to their use in typical home settings. In this paper we report on a mixed methods study conducted to explore the viability, appeal and environmental appropriateness of three ambient, abstract feedback prototypes. We approach this as a design exploration rather than a comparative usability test, aiming to elicit opinions and insights from participants about what works in this domain, and identify and understand those elements that are unsuccessful. Our results indicate that this is a promising approach to residential resource use feedback. We provide our insights into this emerging design space and outline many of the tradeoffs involved in effectively integrating such techniques into the home. 1
M OTIVATION
Commercially available resource use feedback tools include pointof-consumption devices such as the Kill-A-Watt, information dashboards and analysis interfaces, and online profiling and visualization tools such as Microsoft Hohm™ and Google PowerMeter™. These tools offer precise quantitative measures of energy expenditures, historical and predictive charting facilities, cost breakdowns, and performance tracking. This feature set facilitates task-focused, precise analysis of resource use. However, these tools do not integrate gracefully into home settings, nor do they provide convenient at-a-glance awareness of real-time resource use. Furthermore, they do not typically spark occupants’ curiosity or stimulate an emotional reaction. We are motivated to explore alternatives to these traditional approaches by our experience in designing interactive visualization ecosystems for two sustainable houses. These experiences have provided us with pragmatic insights into where tradeoffs are likely to occur when deploying these systems into real-world environments. As a highly situated and context-sensitive venue for feedback, houses present a multitude of design constraints not typically associated with traditional visualization approaches. For example, the physical layout of a home will introduce numerous constraints on placement, visibility, aesthetic choices, and interactive affordances. Similarly, designing for the idiosyncratic habits and expectations of users in home environments requires sensitivity to how such tools are likely to be used in everyday activities, and to how they cohere with other elements in the home. For example, residents have competing ideas about where visible technology should be located and who controls it. Simply installing software on the home PC or hanging a monitor on the wall is only going to help residents make Published by the IEEE Computer Society
IEEE TRANSACTIONS ON VISUALIZATION AND COMPUTER GRAPHICS, VOL. 17, NO. 12, DECEMBER 2011
2490
some kinds of decisions — and only as long as it integrates coherently with their daily activities. Thus, we propose that ambient, aesthetically-motivated feedback approaches may succeed in areas where traditional approaches have fallen short. Distributed ambient and artistic feedback methods aim to engage occupants and promote awareness in unexpected, novel ways. As Petersen et. al. point out, “aesthetics has the ability to surprise and provoke and to move the subject to a new insight of the world [23].” Based on previous research and our applied experience, we propose four design requirements against which we can assess this approach: 1) Pragmatic: comprehensibility and activityappropriateness, 2) Ambient: peripherality and appropriate attentional demands, 3) Ecological: appropriateness in terms of scale, position, and location, and how it fits with the location’s activities; and 4) Aesthetic: attractiveness and coherence with home, These requirements exist alongside others that are outside the scope of this inquiry, such as temporal (how do residents use the display over time?), behavioural (what model of behaviour change does the feedback utilize?), and interactive (how do people interact with and control the display?). These considerations have been addressed in detail by existing work in the field, specifically in [7][11][12][20][21][26]. 2
R EL ATED W ORK
Recent work has brought considerable attention to the design of “eco-feedback” technologies [7][20] and visualization techniques to promote resource use awareness [12][16]. While others have described the design of eco-feedback technology and ecovisualization at a high level [7][20], our work builds on designdriven exploration of working prototype solutions in this space, similar to [10][22][31]. Recent research has explored the design factors for ambient feedback specifically. Jafarinaimi et. al. evaluated the impact of a dynamic sculpture on office work habits, suggesting that, “ambient displays that make use of aesthetic and lifelike forms might be promising for making positive changes in human behavior [14].” Rogers et. al. studied several ambient feedback devices to promote stair use in an academic building, reporting a positive influence on user behaviour and suggesting that such feedback operates on an unconscious level [28]. Kim et. al. developed information widgets supplying information on computer power consumption, concluding that ambient displays are suitable for unobtrusively persuading users to change their habits [16]. Pousman and Stasko define ambient information systems by five criteria. Such systems, “display information that is important but not critical; can move from the periphery to the focus of attention and back again; focus on representations in the environment; provide subtle changes to reflect updates in information (should not be distracting); and are aesthetically pleasing and environmentally appropriate [25].” They situate ambient approaches as one facet of Casual InfoVis: “the use of computer mediated tools to depict personally meaningful information in visual ways that support everyday users in both everyday work and non-work situations [24].” Examples of this approach include the InfoCanvas, which artistically conveys peripheral personal information in order to reduce information overload [19], the Power-Aware Cord [10] that glows with patterns of light to indicate power draws, and various informative artworks [12][13][29]. Skog et. al. highlight the importance of balancing aesthetic appeal and practical usefulness when applying these techniques, noting that “aesthetic concerns become a major issue when a visualization is integrated with a larger environment. It will be necessary to design visualizations that not only provide useful information efficiently, but also blend in with the surroundings and are appealing to look at [29].” Aipperspach echoes this need for increased sensitivity to the introduction of technology into domestic spaces [1].
Kosara’s distinction between pragmatic and artistic information visualization has informed our conceptualization of this design space. Traditional, pragmatic information visualization enables exploration and analysis of a data set, allowing users to thoroughly understand the data. In contrast, artistic information visualization primarily aims to, “communicate a concern, rather than to show data [17].” Artistic displays may not be immediately recognizable as visualizations, and may require a period of learning to read accurately. Rather than optimizing for visual efficiency, this approach seeks to transform the data into something that is visible and interesting [17]: to give “meaningful presence to information that is not readily explicit for the user [14].” Pousman et. al. note that such visualizations can include a degree of ambiguity in their design, which allows for multiple ‘correct’ interpretations of the underlying data, and opens space for the creation of personal meanings [24]. 2.1 Evaluation Methods Several researchers have noted that the evaluation of ambient displays is inherently problematic [4][18][19], as they are designed to function peripherally to a primary task. Traditional methods of evaluating pragmatic information visualization can assume that user attention will be primary, focused and attentive, while we must assume secondary, peripheral attention. Moreover, traditional evaluation mechanisms do not tell us anything about how such feedback can be integrated into a domestic environment. Pousman et. al. have also highlighted the challenges of evaluating Casual InfoVis approaches, noting that such systems are not productivity-focused, do not always aim to support analytic insights, and are designed for casual usage patterns [24]. Skog et. al. argue that traditional methods of evaluating the effectiveness of a display — typically considered in a work context — are not the most important criteria to use when evaluating artistic displays [29]. They argue that aesthetic factors are just as relevant, as these visualizations will be “lived with rather than used [29].” Noting the significant logistical challenges of longitudinal studies that may better measure such factors, both Pousman and Stasko [24] and Ellis and Dix [4] propose mixed methods user studies as a viable approach that includes measures of user satisfaction alongside traditional measures of efficiency. In our case, the goal of these studies is not to establish statistically significant differences between established alternatives but rather to explore the design space to determine viable directions for further study and to elicit unforeseen opportunities and caveats. 3
V IS UALIZATION D ES IGN
We have scoped our design space to ambient and artistic visualizations of point-of-consumption energy use feedback. Nevertheless, the range of visualization possibilities remains very large. We are interested in exploring the utility and acceptance of many different representations, but we first chose to focus on abstract geometric visualizations. First, while depictive forms such as leaves falling from trees, melting icebergs, or bleached coral reefs [16] are often utilized to convey resource use feedback and its impact on natural environments, our ongoing work indicates that such representations can be fraught with misinterpretation and can induce feelings of guilt that do not always promote behaviour change [27], instead leading to a rejection of the representation and so the information it contains. Second, we hypothesize that abstract, nonrepresentational approaches are good candidates for ambient feedback that can remain peripheral to one’s attention while sustaining interest over time. Interactive demonstrations and source code for the prototype visualizations can be found at: http://johnny.hcssl.iat.sfu.ca/aa_vis/index.htm.
RODGERS AND BARTRAM: EXPLORING AMBIENT AND ARTISTIC VISUALIZATION FOR RESIDENTIAL ENERGY USE...
2491
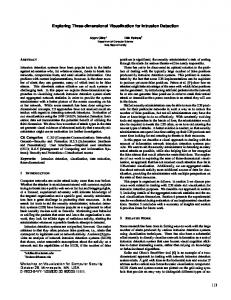
Fig. 1. The Phyllotaxis design. These screenshots were taken while an electric kettle was boiling water. From left, the following values are represented: 1) 0W 0W·h, 2) 1600W 1W·h, 3) 1600W 55W·h, 4) 0W 61W·h. When the kettle switches off and the power draw ceases the spiral resumes its symmetrical shape (at right), while the scale of the dots is maintained to signify the accumulated energy use.
Fig. 3. The Pinwheel design. From left to right, the following values are represented: 1) 12W 1W·h, 2) 1400W 1W·h, 3) 1400W 90W·h. At left, a few pinwheels spinning lazily during a low power state draw attention to vampire power consumption.
The prototype designs in Fig. 1, 2, and 3 represent a range within this large space of visual possibilities focused around abstract geometric patterns. These designs generally fit in the Symbolic Sculptural Display (in digital form) and Multiple Information Consolidator design patterns outlined by Pousman and Stasko in their analysis of ambient information systems, and extend these patterns in terms of representational flexibility and aesthetic emphasis [25]. The designs draw inspiration from computational aesthetics, generative and abstract art, and organic patterns. A wide variety of forms within this space were considered, including contoured lines, evolving origami arrangements, mandalas, spirographs, tangrams, and abstracted organic patterns such as snowflakes. After a period of exploration, three designs were selected for evaluation. These are meant to serve as research instruments with an exploratory rather than confirmatory purpose. We seek to expose participants to a variety of visual forms, with the objective of gathering insights into what works with simple abstract forms. Each design conveys both real-time power and cumulative energy use values using simple patterns of population and “behaviour” (motion, increases in size). We chose to represent both power use and cumulative energy use, as these are standard measures in current metering and in-home energy feedback systems. The Phyllotaxis design (Fig. 1) was chosen as a geometric form that is inherently ordered, but that can be ‘disturbed’ by power use. The visualization begins in the shape of a naturally occurring geometric spiral — found, for example, in the pattern of seeds in a sunflower. Real-time power use is mapped to the vibration of the seeds relative to their position in the spiral; the more power is used the farther they vibrate from that position. Cumulative energy use is represented by the increasing size of the seeds. Thus, power use agitates the seeds while energy use causes them to expand. In a low power state the seeds visually buzz, vibrating subtly but maintaining the general order of the geometric phyllotaxis pattern. Increases in power use cause the dots to vibrate more noticeably until, at high power draws, the visualization resembles a disordered and rapidly vibrating collection of particles. In recognition of the liberal use of motion in this design, we deliberately selected a monochromatic colour palette: a gradient of teal shades. In contrast to the Hive and Pinwheel designs, which continually shift position within the spatial confines of the display, the Phyllotaxis design is presented as a
single point of focus that persists over time. The Hive design is based on a beehive’s grid of hexagonal cells. As in the Phyllotaxis design, a naturally occurring geometric form inspired the choice of pattern. Power use is represented by the number of filled cells in a randomized spatial pattern, while energy use is indicated by the scale of the cells. As energy use accumulates, the cells grow and overlap. When no power draw is detected, the visualization is blank. Low power states cause a small number of hexes to gradually fade in. Increased use causes more cells to fill and the visualization to become denser. However, the result is never a static image; the nature of power use is that watt draws fluctuate from moment to moment for many devices. This results in a constantly shifting grid of overlapping colours and transparency values. These transitions lend the visualization the appearance of light filtering through fall leaves or stained glass. The Hive pattern was designed to provide feedback through slow gradual changes, rather than the rapid motion of the other two designs. We anticipated this would result in a calmer, less distracting appearance. In the Pinwheel design, power use is represented by both the number of pinwheels and their rate of rotation: the more power is drawn, the faster the pinwheels spin. Cumulative energy use is mapped to the scale of the pinwheels. Similar to the Hive, the Pinwheel visualization is in constant flux; as power use fluctuates new pinwheels are spawned and others fade away in a randomized layout. In combination with the rotation of each element, this gives the design a hypnotic appeal. Distinct from the Phyllotaxis and Hive patterns, the Pinwheel design does not incorporate a natural geometric form. Rather, an abstraction of a pinwheel shape is used to convey the flow of power driving the visualization. This simple mapping relies on familiarity with the mechanics of a pinwheel: the faster the wind is blowing, the faster the wheel spins. The prototypes were tailored to the activities and short timeframe of our study scenarios, and were specifically conceived to support activity-level feedback. Long-term state considerations, such as how and when the visual feedback would reset—at regular intervals? after activity ceases? at the user’s discretion? by gradually reducing scale in reverse?—and how past states of the visualization might be saved or represented for later reference have not been considered in detail or implemented in these prototypes. These essential considerations must be addressed in future work.
Fig. 2. The Hive design. The left three images indicate a similar usage pattern to the kettle example in Fig. 1. The image at far right shows the display after 3 hours of use connected to a home theatre system, representing 592W·h of accumulated energy use.
3.1 Implementation Power and energy use were recorded with two Kill-A-Watt powermonitoring units. We modified these to enable wireless transmission of collected data that was logged on a local server and used to drive the feedback display in near real-time (1 to 2 seconds lag). Data to drive the displays could be drawn from any available source, such as home infrastructure sensing networks [4][8][9], smart meters [30], or commercially-available point-of-consumption meters. All appliances in each of the study scenarios were monitored so that all participant actions were reflected in the feedback (see section 4.1). A small 7” LCD screen running at 800x480px resolution was used to display the visualizations. The display consumes 3.8W maximum power, has a brightness of 350cd/m2 and a 400:1 contrast
IEEE TRANSACTIONS ON VISUALIZATION AND COMPUTER GRAPHICS, VOL. 17, NO. 12, DECEMBER 2011
2492
ratio. The LCD was left at its default brightness setting during the study. The visualizations were presented in full screen on the panel, which was presented as a digital picture frame to the participants. Algorithms for mapping power and energy use to visual feedback were based on the maximum loads in each scenario. In the Home Theatre, the peak power draw was ~550 watts (W). Over a 15 minute activity session, the maximum cumulative energy use was thus ~138 Watt-hours (W·h). In the Kitchen scenario, the peak power draw was ~3200W, for a maximum cumulative energy use of ~533W·h over a 10 minute session. 4
S TUDY D ES IGN
We assessed our visualizations against the following criteria based on our four primary design requirements: • Pragmatic: Do participants understand the relationship between the visualization and the underlying concern (power and energy use)? Can participants identify what specific information is being visualized? How do participants envision using this feedback? How do participants compare artistic and traditional feedback? • Ambient: Is the display unobtrusive [18]? Are participants able to shift the display from the periphery to the focus of their attention and back again [25]? When and how often do participants notice changes in the display? • Ecological: How well does the display fit into the home environment? Do participants express a preference for where it should be located in the home or positioned in a room? What range of scale and brightness are appropriate? • Aesthetic: How do people describe their impressions of the aesthetic form of the visualization? Do participants express an interest in incorporating the feedback into their homes? What prototype designs are deemed to be the most aesthetically appealing? 4.1
User Study
Fig. 5. The Kitchen scenario of the user study. At right, a closeup of the display used to provide energy use feedback.
of the television. In the Kitchen scenario, participants made a snack or hot drink using a microwave, electric kettle, and toaster, and were asked to imagine they were in their own kitchen. The kitchen we used had one wall of floor-to-ceiling windows and so was filled with natural light. The kitchen appliances were arranged on the counter with the feedback display placed nearby on the counter top (Fig. 5). Each participant was randomly assigned to one of the two scenarios and completed the following steps: 1. Pre-Questionnaire: Recorded demographic information and participant familiarity with existing feedback tools. 2. Context-Setting exercise: Each participant read a document stating the basic concepts of electrical energy (terminology, units) and saw two traditional feedback types in order to establish a baseline of knowledge about the domain (see 5.1). 3. Scenario Activity: As outlined above. Each participant received energy use feedback from one of the three visualization designs during the activity. 4. Post-Questionnaire: Recorded participant responses to the visualization for each set of design requirements using likert scales, semantic differential scales, and multi-selection lists. 5. Interview: Each participant was asked to elaborate on their impressions of the visualization design that they saw. At the end of the interview, each participant was shown all three visualization designs side-by-side in order to gather comparative feedback. A pilot study with 2 participants (both male) was followed by a full study of 23 participants (14 female). 12 were between 19-29, 8 between 30-39, 2 between 40-49 and one was over 50. 16 lived in apartments or condominiums, while 7 lived in houses, townhouses, or basement suites. 19 rent or lease their home, while 4 own or coown. 16 of the participants pay for their electricity. Notably, none of the participants reported using any commercially available feedback tools, and only 9 of the participants reported receiving any feedback about their energy use at all: in each case, a monthly energy bill. 4.2 Data Collection and Analysis We collected data from multiple sources: questionnaires, observer notes, attention logs, energy use logs, and semi-structured in-depth
Fig. 4. Study diagram indicating scenarios, activities, and technical implementation.
We designed a mixed methods user study to evaluate our proposed approach. A between-subjects study design was used to compare results across two simulated domestic environments: a lab space converted to function as a home theatre, and a shared office kitchen set up as a home kitchen. Data was collected using pre and post-study questionnaires, in-study observations and system logs, and a post-study interview. In the home theatre scenario, participants were asked to use an entertainment unit for 15 minutes. This included a DVD player and movies, PlayStation™3 and games, surround-sound speakers, and a TV. Participants were encouraged to act as they would in their own living room. The room was darkened, with several lamps providing ambient light, and the door closed. The participant sat on a couch with a coffee table between them and the home theatre unit. They received feedback on their power and energy use during the session via a small display placed on the entertainment unit to the lower left
Fig. 6. One participant’s power use mapped to their attention events.
RODGERS AND BARTRAM: EXPLORING AMBIENT AND ARTISTIC VISUALIZATION FOR RESIDENTIAL ENERGY USE...
interviews. Questionnaire data included user ratings of comprehension, distraction, intrusiveness, attractiveness, relaxation/stress, engagement, and form factor. Observations during the study captured both general behaviour and attentional events. The primary researcher took notes during the user study, while a second observer with a view to the participant’s line of sight recorded attention to the feedback display. These attention events were coded and categorized by duration: glance (< 2 seconds), look (2-5 seconds), and inspect (5+ seconds). Though inexact, this data captured the regularity and duration of participant attention to the feedback at a coarse granularity. This avoided both vague selfreports of visual attention, and the overhead and awkwardness of eye-tracking equipment. This data was used to analyze the display’s peripherality in regards to ambient requirements, and to triangulate participant responses to questions about focus and attention. Each attention event was digitally timestamped, allowing us to map visual attention to power and energy use during the study (Fig. 6). Semi-structured interviews varying in length from 10 to 20 minutes were performed at the end of each session. These allowed us to triangulate data collected through the questionnaires and observations, and discuss participant’s insights in greater depth. Near the end of each interview, we elicited feedback on the aesthetic attributes of the two visualization designs that the participant did not see during the scenario activity. Observations and interviews were open-coded and analyzed along with the questionnaire responses and attention and energy logs to achieve a holistic picture of the results. 5
R ES UL TS
5.1 How Participants Understood Energy Use Before participating, each participant was asked to read a one page document explaining the basic concepts of electrical energy, and was shown two traditional feedback types in this domain: a screenshot from Google PowerMeter™ and an excerpt from the local energy bill. They were asked questions about this information in order to establish a baseline of knowledge about the research area. Half of the participants had some difficulty interpreting this feedback correctly, or expressing the data in the appropriate units. Others were able to correctly answer questions about the content of the document, but were confused by the traditional feedback visualizations composed of bar graphs and data tables, often hesitating and reconsidering their answers. Four of the participants expressed significant confusion about the concepts and were unable to successfully extract information from the charts. Given that these are the basic means by which residents find out about their energy use, this poor comprehension emphasizes the need for more usable and contextually appropriate resource use feedback in the home. 5.2 Pragmatic Requirements 16 of 23 participants correctly interpreted the visual feedback of both power and energy use and were able to articulate the mappings for each in their own words. 11 of these participants identified the visualization mappings explicitly, while 5 expressed the relationship between what they saw and their power and energy use more generally (Fig. 7). 4 other participants correctly interpreted the visualization of power use but misunderstood how energy use was represented. The final 3 participants either did not associate the visual feedback to data changes, or significantly misattributed the visual mappings. There were some noticeable discrepancies in comprehension between display designs. The majority of those exposed to the Hive design during the scenario were able to correctly associate the number of hexagons to power use, and their scale to energy use. The Phyllotaxis display parameters were also successfully mapped by most participants, with vibration linked to power use and size and density linked to energy use. However, participants noted that once the spiral became quite dense, it was more difficult to detect changes in power use, as contrast between the dots decreased.
2493
Fig. 7. Comprehension in aggregate (left) and by display design. Responses that explicitly articulated the data mappings in the visualization were coded as ‘correct,’ generally articulated mappings were coded ‘good,’ partial comprehension was coded ‘fair,’ and incorrect or lack of comprehension was coded ‘none.’
The Pinwheel design did not clearly communicate accumulated energy use. This design uses the same mapping as the Hive (number to watts, scale to energy), but for performance and aesthetic reasons uses a different scaling algorithm (Fig. 3). It appears that the reduced amplitude of the scaling relative to energy use rendered these accumulated changes imperceptible to most participants, who believed the pinwheels only represented real-time power draw through number and speed of rotation. Use contexts. Participants valued the real-time feedback of the ambient display, anticipating that it would help them make in-themoment decisions to eliminate unnecessary power use. Specific attention to transitions in visual feedback (Fig. 6) suggested that most participants directly related their actions (turning appliances on and off) to the visual feedback they received. Several participants became aware of “vampire power” through the feedback: the power consumed by electronics while they are switched off or in a standby mode. One noticed the vampire draw of the home theatre system because the feedback continued to subtly move after she switched everything off. Another was curious why a few Pinwheels continued to spin after the microwave finished, until he associated the feedback to the light that remained on inside the appliance and proceeded to close the door. Comparisons to traditional visualization. Having seen two “traditional” visualizations during the context-setting exercise, participants were asked to compare those graphs to the feedback they received. Several participants described the ambient visualization as easier to understand in the moment, while noting that it is less detailed: “With the graphs for Google (PowerMeter) and for the typical bill, you had to think about it a lot, you had to definitely read it and you had to sort of figure out where the information was... whereas with the display you could see at a glance that there is something going on.” Another commented on the intuitiveness of the ambient feedback in contrast to traditional graphs: “On those you have to focus on numbers and graphs and you don’t actually have to think with this display, it’s just intuitive: there are more pinwheels spinning so there is more energy being used.” However, the tension between ambient feedback and precise numerical data was also expressed, with participants requesting greater precision: “some sort of numerical representation so I can actually see the values.” However, others saw the display’s abstraction as a feature: “I like how it’s just sort of abstract... it’s not showing you a bar graph or that kind of thing. I like how you can just glance at it and get an idea of what’s going on without actually having to read any numbers.”
2494
IEEE TRANSACTIONS ON VISUALIZATION AND COMPUTER GRAPHICS, VOL. 17, NO. 12, DECEMBER 2011
Fig. 8. Participant ratings of Distraction (Likert scale responses to the statement, “I was distracted by the display”), and Unintrusive/Intrusive, Relaxing/Stressful semantic differential scales. Results are divided by display design on the Y-axis and colour-coded by scenario.
5.3 Ambient Requirements Fig. 8 shows participant ratings of distraction, intrusiveness, and relaxation/stress, separated by display design and scenario. The Hive design was rated as uniformly unintrusive and non-distracting, whereas the other two designs had more mixed results, with 6 participants rating the Phyllotaxis and Pinwheel as distracting and several others giving a neutral rating. One participant also rated the Pinwheel as intrusive. The Relaxing/Stressful scale results indicate participants found the Hive and Pinwheel displays to be Relaxing or Neutral, but the Phyllotaxis registered 2 Stressful results, which matches user’s affective descriptions of the designs. In terms of attention, participants attended to the display more often than they thought they did. When asked how often they noticed the display, a typical response was “every couple of minutes,” when in fact the attention data showed participants attended to the display much more regularly, sometimes dozens of times over the course of a 10 or 15 minute session. Novelty and curiosity likely played a large role in participant attention to the display, but we noticed some interesting variations in viewing patterns by scenario and activity. Use in the kitchen environment reliably showed a pattern of using an appliance (such as the toaster) and then viewing the display to see the corresponding power spike: a quick cause-and-effect check (Fig. 6). Participants were aware of this and related that they noticed the display most often during these transition periods. In the Home Theatre, we saw a different usage pattern, particularly with those participants who played video games during the scenario. Overall, participants had fewer views and these were less directly related to actual appliance use: they mostly glanced at the displays a short time after spikes in the energy use, but they did not actively view for them. The gaming participants were all in the lowest third of participants for total attention events, and reported the most distraction during the scenario activity. Motion. The two display designs that included rapid motion were considered to be more stressful and distracting than the Hive design, in which motion was restricted to slow fading transitions between states. One participant expressed that the motion of the Phyllotaxis design was highly distracting because, “The spiral is very agitated.” Similarly, another participant said, “If there was something I noticed it would probably be the vibration which made me feel a little bit anxious or kind of like it attracted my eye to it.” Others described the motion of the Pinwheels as calming. These variations suggest that the use of motion in such visualizations must be handled very sensitively in terms of the activities it is intended to support and where it is located in a user’s field of view.
5.4 Ecological Requirements Proximity to the activity and participant line of sight are key considerations in terms of the display’s ambient and ecological requirements. Several participants expressed annoyance with the proximity of the display to the television in the Home Theatre scenario, saying that it interfered with their attention. One participant who played video games during the session called it, “hella intrusive!” A recurring response indicated that, “if the small screen is in front of me or beside the TV then it is kind of too intrusive and too bright and distracting.” Participants suggested that, “It needs to be somewhere where you can glance at it casually,” and suggested they would place it on a side table, bookcase, or on the wall, where it is, “visible, but not in my face.” Conversely, participants in the Kitchen scenario wanted the display to be placed in a central, highly visible location, such as mounted on the fridge door, or adjacent to the primary appliances. One participant explained this preference, saying, “The kitchen, for sure, would be kind of like a focal point because I think a lot of energy is used in there. On the refrigerator door itself I think would make it really visible. It’s kind of a central location.” Another said, “I would put it somewhere where it is in my line of sight. I was imagining it like a dashboard in a car, where I want to be able to see the speedometer easily at a glance, not too far away from where I’m looking.” Location. Participants stated a desire for feedback in high-traffic locations where they spend the most time and use the most energy: the most common rooms indicated as sites for feedback were the kitchen, living room, office, and TV room (Fig. 9). The two scenarios for the study were in a kitchen and living room environment, so it is possible this influenced the results. Nevertheless, these scenarios were chosen specifically as sites of significant energy use in the home, and rooms where residents spend the majority of their time, and so align with the collected data. Though several participants were willing to place feedback in a variety of rooms in the home, about half selected only one or two locations (Fig. 9). This indicates that many residents have specific restrictions on where such visualizations might be appropriate and acceptable. Notable in this regard is that private rooms such as the bathroom and bedroom are unpopular sites for feedback. Additionally, several participants mentioned they wished to see the feedback integrated into their digital ecosystem, including on their smart phone and as a web app or laptop widget [2]. Scale and brightness. Participants did not express strong sentiments in terms of changing the size of the display, suggesting the 7” panel we used was within the appropriate range of scale for a domestic feedback device at this activity range (1 to 3m). However, we believe a variety of other form factors could work equally well if designed with the appropriate context in mind. One participant commented on the importance of environmental context in terms of
Fig. 9. Participants were asked where they would place a feedback display like this in their home. Participants (ordered by number of selections) are listed on the Y-axis and locations (ordered by number of responses) on the X-axis.
RODGERS AND BARTRAM: EXPLORING AMBIENT AND ARTISTIC VISUALIZATION FOR RESIDENTIAL ENERGY USE...
display size: “I think it is a good size, at least for the size of the room.” That is, this form factor works well for the room sizes and viewing distances in which it was tested, but perhaps not in a large sitting area or grand kitchen. Another participant with noticeably poor eyesight requested the screen be increased to, “at least double the size.” This was also our oldest participant, so this is something important to consider concerning the needs of different demographics. Responses about the brightness of the display varied slightly, but indicated that we were within the appropriate range for the two scenarios and lighting conditions we studied. That said, nearly all participants indicated they would want to be able to adjust the brightness of the screen as necessary if it were in their own home, either manually or through an automatic ambient light sensor. 5.5 Aesthetic Requirements Participants rated the display they were exposed to on a variety of semantic differential scales. Participants rated all displays as predominantly Attractive, Beautiful, and Interesting (or neutral), with no negative responses being listed in these categories. All but one participant rated the display they saw during the activity as Engaging or Neutral in the Boring-Engaging scale. All but 4 participants Agreed or Strongly Agreed on a Likert scale that they would like to have a display like this in their own home (2 Neutral and 2 Disagree responses), and 16 of 23 stated they would like to have this specific display in their own home (5 Neutral and 2 Disagree). Of the three display designs, 10 chose the Hive design as their favourite in terms of aesthetics, 6 chose the Phyllotaxis, and 5 chose the Pinwheel, while 2 indicated they would prefer a traditional graph over any of the display options provided. Some participants described the Hive design as, “abstract, artistic, organic, funky, modern, and pragmatic” while others found it “dense, boring, crowded, and confusing.” Many participants found the Pinwheel design, “attractive, calming, intuitive, peaceful, harmonious, neutral, and hypnotic,” but some others noted that it was, “distracting, flickering, and busy.” Finally, the Phyllotaxis design provoked the strongest reactions, with many participants indicating they found it, “stressful, anxious, frantic, dizzy, scary, intrusive, agitated, urgent, spastic, violent, and frenetic.” The relationship between quality of motion and emotional affect is apparent when comparing these participant descriptions across display designs. A unique perspective on the potential of abstract artistic visualization was articulated by one participant in regards to the Phyllotaxis display: “I think visualizations of energy use can be quite stark and negative and this one struck me as positive, it didn’t make me feel awful so that was quite nice.” Another participant alluded to this in reference to depictive artistic feedback in this domain, saying, “it takes this amount of energy to grow this many trees and you just
Fig. 10. Display preference in aggregate (left) and by display design. At right, the X-axis indicates participant preference, while the Y-axis indicates which visualization design the participant was exposed to during the scenario activity.
2495
cut down this many, but then that’s that negative thing... I don’t need the guilt.” As another participant sarcastically commented, energy feedback can’t be all, “dead trees and sea life dying.” Function in the home. Several participants engaged with the displays as instances of informative art, describing how it could be incorporated into their home environment as such. One participant described how he might display it: “this is an ambient, artistic thing and a fridge is a beautiful framing space for it. ...Clearly it has artistic value, it could be in a picture frame and I kind of imagine it could be on a wall and it would be presented as a piece of art.” Others pointed out that such a display could function as a conversation piece, emphasizing the potential social aspect of the object to promote discussion: “If I had this in my home and other people were drawn to it for the artsy uniqueness then that might get people interested and invested in this idea.” Customization and personal preferences. A common theme expressed by participants was the desire to be able to customize the display design. One participant stated she would simply want to, “keep it fresh,” while another described her desire for renewed engagement: “I get bored, and I will be less likely to look at something that’s been there the same day after day.” In some cases, the concern was to match the colour palette to the domestic environment: “if it’s the wrong blue it’s going to look really bad in my kitchen.” Another participant indicated a preference for alternative shapes: “If I was going to have a visualization based thing in my house I’m personally more partial to curves and rounder shapes.” Another wanted to fit the visualization to their mood: “I certainly wouldn’t want to have just this for the rest of my life on my wall or on my fridge, I’d want to be able to switch it out depending on my mood and such.” The prevalence of skinning and customization features in common software tools makes this result unsurprising. This is particularly important in the domestic environment where coherence with the surrounding aesthetic choices is highly valued. Closely tied to this is personal preference for specific colours. This was often the first attribute that participants mentioned. Unsurprisingly, participants often associated their affective experience of the display designs with the chosen colour palettes. 6
D IS CUS S ION : V IABILITY
AND
L IMITATIONS
We emphasise that the purpose of this study was not a statistical analysis of a comparison of alternatives, but rather an exploration of the design space afforded by this approach and an inquiry into what might be promising for future research. Taken as such, these results indicate the viability of ambient and artistic visualization as a promising method of providing real-time residential resource use feedback. Ambient point-of-consumption visualizations appear particularly well suited to promoting real-time awareness, at-aglance monitoring, and communication of otherwise-invisible vampire consumption. Key considerations for acceptance are the careful application of motion, placement for appropriate activity support, and customization affordances. Informed by these findings, future work can evaluate refined versions of these or similar visualization designs in an experimental study design suited to statistical analysis. The aesthetic emphasis of the designs often produced positive affect rather than feelings of guilt in our participants. This suggests that these visualizations can promote awareness in unexpected and constructive ways, and illustrates the potential for informative art to be provocative and engaging even when non-representational. The positive reception by many participants confirms our anecdotal experience with potential users in our two sustainable home projects. However, our findings also indicate that such approaches aren’t for everyone: for some users, a graph or numbers are still the most desirable form of feedback. We believe alternative approaches can exist alongside these traditional means, and do not suggest that all forms of feedback must fall into one or the other camp.
IEEE TRANSACTIONS ON VISUALIZATION AND COMPUTER GRAPHICS, VOL. 17, NO. 12, DECEMBER 2011
2496
16 of our 23 participants could reliably comprehend and make sense of the connection between their actions and what was being visualized, while another 4 partially understood the visualization. These results highlight the challenges of balancing aesthetic interest and effective data representation. Moreover, data representation must be carefully calibrated to avoid confusion. Several participants attempted to map each and every visual attribute of the abstract designs to a data point, including the colours, spatial position of elements, and incidental patterns of overlapping forms. Though the intended mappings of power and energy use were correctly identified in most cases, this detailed consideration of the various additional visual attributes by the participants was unexpected. Many of these design choices, such as colour selection, were based on purely aesthetic criteria. As discussed, some ambiguity in representation can encourage curiosity and engage viewers, but in some cases this ambiguity appeared to undermine participant comprehension. Thus, a more purposeful application of visual features in future efforts may help to improve comprehension and reduce confusion in this regard. Additionally, the separation of power and energy use data may help to clarify the purpose of a given visualization and facilitate correct interpretation of these distinct pieces of information. We also note the desire to have more detail on demand in the displays: participants indicated they liked the artistic feedback but wanted to “see the numbers” in certain situations. At least two approaches are possible here. One can design an interactive device that can switch states from an ambient display to a fully-fledged information appliance. Alternately, we can consider the ambient display as one tool in an ecosystem of different techniques involved in supporting sustainable resource use. This may include traditional tools such as dashboards and information widgets, mobile feedback, and more sophisticated visual analysis environments. There are clear tradeoffs between the precision of these tools and the abstraction of our proposed approach in terms of the attention each demands, and the kinds of decisions each can help support. We plan to evaluate both approaches in future work. Our results also indicate that balancing aesthetic interest and the attentional requirements of an ambient display rests on the appropriate application of potentially distracting visualization features such as abrupt motion transitions and thresholds of visual density. This is particularly important in relation to the context of use (location in home) and the activities the feedback is intended to support. Clearly, appropriate placement is governed by perceptual, aesthetic and contextual conditions that must be further investigated in future research. 7
C ONCLUS ION
We have explored the viability of ambient and artistic approaches to residential resource use feedback while indicating specific implications for design. Our findings span four primary design requirements: pragmatic, ambient, ecological and aesthetic. We explored this approach in a simulated context and gathered data on user comprehension, distraction and aesthetics acceptance. The physical characteristics of our prototypes were found to be within the range of suitability for a domestic setting, and participants were largely able to understand and recognize what was being visualized without undue distraction. The abstract visual qualities of the designs provoked a variety of responses, and revealed that many individuals are willing to engage with alternative representations of energy use beyond traditional graphs or depictive graphics. Our future work will build on this exploratory evaluation to refine the visual properties of such representations. In the long term, we hope to assess the impact of these approaches on behaviour through longitudinal evaluation. A CKNOWLEDGMENTS This research is supported by grants from the MITACS Accelerate BC program and the Graphics, Animation and New Media Network of Centres of Excellence. We thank our colleagues at BC Hydro for an ongoing and insightful collaboration.
R EF ERENCES [1]
[2]
[3]
[4]
[5]
[6]
[7]
[8]
[9]
[10]
[11]
[12]
[13]
[14]
[15]
[16]
[17]
[18]
R. Aipperspach, B. Hooker, and A. Woodruff, “The Heterogeneous Home,” Proc. of the 10th International Conference on Ubiquitous Computing, pp. 222-231, 2008. L. Bartram, J. Rodgers, and K. Muise, “Chasing the Negawatt: Visualization for Sustainable Living,” IEEE Computer Graphics and Applications, vol. 30, no. 3, pp. 8-14, May/June, 2010. T. Campbell, E. Larson, G. Cohn, R. Alcaide, and S. N. Patel, “WATTR: A Method for Self-Powered Wireless Sensing of Water Activity in the Home,” Proc. of the 12th ACM international conference on Ubiquitous computing, pp. 169-172, 2010. G. Cohn, E. Stuntebeck, J. Pandey, B. Otis, G. D. Abowd, and S. N. Patel, “SNUPI: Sensor Nodes Utilizing Powerline Infrastructure,” Proc. of the 12th ACM international conference on Ubiquitous computing, pp. 169-172, 2010. G. Cohn, S. Gupta, J. Froehlich, E. Larson, and S. N. Patel, “GasSense: Appliance-Level, Single-Point Sensing of Gas Activity in the Home,” in P. Floréen, A. Krüger, and M. Spasojevic (Eds.), Pervasive Computing, vol. 6030, pp. 265-282, Springer Berlin Heidelberg, 2010. G. Ellis and A. Dix, “An Explorative Analysis of User Evaluation Studies in Information Visualization,” Proc. of the 2006 AVI Workshop on Beyond time and errors: novel evaluation methods for information visualization, pp. 1-7, 2006. J. Froehlich, L. Findlater, and J. Landay, “The design of eco-feedback technology,” Proc. of the 28th International Conference on Human Factors in Computing Systems, pp. 1999–2008, 2010. J. Froehlich, E. Larson, T. Campbell, C. Haggerty, J. Fogarty, and S. N. Patel, “HydroSense: Infrastructure-Mediated Single-Point Sensing of Whole-Home Water Activity,” Proc. of the 11th International Conference on Ubiquitous Computing, pp. 235-244, 2009. S. Gupta, M. S. Reynolds, and S. N. Patel, “ElectriSense: Single-Point Sensing Using EMI for Electrical Event Detection and Classification in the Home,” Proc. of the 12th International Conference on Ubiquitous Computing, pp. 139-148, 2010. A. Gustafsson and M. Gyllenswärd, “The Power-Aware Cord: Energy Awareness Through Ambient Information Display,” Proc. of the 23rd International Conference on Human Factors in Computing Systems, Extended Abstracts, pp. 1423-1426, 2005. H. A. He, S. Greenberg, and E. M. Huang, “One Size Does Not Fit All: Applying the Transtheoretical Model to Energy Feedback Technology Design,” Proc. of the 28th International Conference on Human Factors in Computing Systems, pp. 927-936, 2010. T. Holmes, “Eco-Visualization: Combining Art and Technology to Reduce Energy Consumption,” Proc. of the 6th ACM SIGCHI Conference on Creativity & Cognition, pp. 153-162, 2007. L. E. Holmquist and T. Skog, “Informative Art: Information Visualization in Everyday Environments,” Proc. of the 21st International Conference on Human Factors in Computing Systems, pp. 229-235, 2003. N. Jafarinaimi, J. Forlizzi, A. Hurst, and J. Zimmerman, “Breakaway: An Ambient Display Designed to Change Human Behavior,” Proc. of the 23rd International Conference on Human Factors in Computing Systems, Extended Abstracts, pp. 1945-1948, 2005. Y. Kim, T. Schmid, Z. Charbiwala, and M.B. Srivastava, “ViridiScope: Design and Implementation of a Fine-Grained Power Monitoring System for Homes,” Proc. of the 11th International Conference on Ubiquitous Computing, pp. 245-254, 2009. T. Kim, H. Hong, and B. Magerko, “Design Requirements for Ambient Display that Supports Sustainable Lifestyle,” Proc. of the 8th ACM Conference on Designing Interactive Systems, pp. 103-112, 2010. R. Kosara, “Visualization Criticism–The Missing Link Between Information Visualization and Art,” Proc. of the 11th International Conference on Information Visualization, pp. 631-636, 2007. J. Mankoff, A. Dey, G. Hsich, J. Kientz, S. Lederer, and M. Ames, “Heuristic Evaluation of Ambient Displays,” Proc. of the 21st International Conference on Human Factors in Computing Systems, pp. 169-176, 2003.
RODGERS AND BARTRAM: EXPLORING AMBIENT AND ARTISTIC VISUALIZATION FOR RESIDENTIAL ENERGY USE... [19] T. Miller and J. Stasko, “Artistically Conveying Peripheral Information with the InfoCanvas,” Proc. of the Working Conference on Advanced Visual Interfaces, pp. 43-50, 2002. [20] J. Pierce, W. Odom, and E. Blevis, “Energy Aware Dwelling: A Critical Survey of Interaction Design for Eco-Visualizations,” Proceedings of OZCHI, pp. 1-8, 2008. [21] J. Pierce, D. J. Schiano, and D. Paulos, “Home, Habits, and Energy: Examining Domestic Interactions and Energy Consumption,” Proc. of the 28th International Conference on Human Factors in Computing Systems, pp. 1985-1994, 2010. [22] D. Petersen, J. Steele, and J. Wilkerson, “WattBot: A Residential Electricity Monitoring and Feedback System,” Proc. of the 27th International Conference on Human Factors in Computing Systems, Extended Abstracts, pp. 2847-2852, 2009. [23] M. G. Petersen, O. S., Iversen, P. G., Krogh, and M. Ludvigsen, “Aesthetic Interaction–A Pragmatist's Aesthetics of Interactive Systems,” Proc. of the 2nd ACM Conference on Designing Interactive Systems, pp. 269-276, 2004. [24] Z. Pousman, J. Stasko, and M. Mateas, “Casual Information Visualization: Depictions of Data in Everyday Life,” IEEE Transactions on Visualization and Computer Graphics, vol. 13, no. 6, pp. 1145-1152, 2007. [25] Z. Pousman and J. Stasko, “A Taxonomy of Ambient Information Systems: Four Patterns of Design,” Proc. of the Working Conference on Advanced Visual Interfaces, pp. 67-74, 2006. [26] Y. Riche, J. Dodge, and R. A. Metoyer, “Studying Always-On Electricity Feedback in the Home,” Proc. of the 28th International Conference on Human Factors in Computing Systems, pp. 1995-1998, 2010. [27] J. Rodgers. Residential Resource Use Feedback: Exploring Ambient And Artistic Approaches. M.Sc. Thesis, Simon Fraser University. 2011. [28] Y. Rogers, W. R. Hazlewood, P. Marshall, N. Dalton, and S. Hertrich, “Ambient Influence: Can Twinkly Lights Lure and Abstract Representations Trigger Behavioral Change?” Proc. of the 12th International Conference on Ubiquitous Computing, pp. 261-270, 2010. [29] T. Skog, S. Ljungblad, and L. E. Holmquist, “Between Aesthetics and Utility: Designing Ambient Information Visualizations,” Proc. IEEE Symposium on Information Visualization, pp. 30-37, 2003. [30] M. Weiss, F. Mattern, T. Graml, T. Staake, and E. Fleisch, “Handy Feedback: Connecting Smart Meters with Mobile Phones,” Proc. of the 8th International Conference on Mobile and Ubiquitous Multimedia, Article No. 15, 2009. [31] T. Yun, “Investigating the Impact of a Minimalist In-Home Energy Consumption Display,” Proc. of the 27th International Conference on Human Factors in Computing Systems, Extended Abstracts, pp. 44174422, 2009.
2497