Exploring Three-dimensional Visualization for Intrusion Detection Dirk Reiners†
Adam Oline∗
Department of Computer Science Iowa State University
A BSTRACT Intrusion detection systems have been popular tools in the battle against adversaries who, for whatever reason, desire to break into networks, compromise hosts, and steal valuable information. One problem with current implementations, however, is the sheer number of alerts they can generate, many of which tend to be false alarms. This drawback makes effective use of such systems a challenging task. In this paper we explore three-dimensional approaches to visualizing network intrusion detection system alerts and aggregated network statistics in order to provide the system administrator with a better picture of the events occurring on his or her network. While some research has been done using twodimensional concepts, 3D approaches have not received much attention with regard to detecting network intrusions. Evaluation of our visualizations using the 1999 DARPA Intrusion Detection Evaluation data set demonstrates the potential benefit of utilizing the third dimension. We show how a number of attack types in the data set generate visual evidence of abnormal activity that a security administrator might use as motivation for further investigation. CR Categories: C.2.0 [Computer-Communications Networks]: General—Security and Protection H.5.2 [Information Interfaces and Presentation]: User Interfaces—Graphical user interfaces (GUI); K.6.5 [Management of Computing and Information Systems]: Security and Protection—Unauthorized access Keywords: intrusion detection, visualization, data reduction, three-dimensional 1
I NTRODUCTION
Computer networks are under attack today more than ever before. Whether the attacker is an adolescent armed with common exploits trying to break into a public web server for fun and bragging rights, or a focused, experienced adversary with intimate knowledge of the targeted organization and a specific goal, security administrators face a great challenge in protecting their resources. In the search for tools to aid the security administrator, intrusion detection systems (IDS) have become popular as a supplement to other basic security devices such as firewalls. Monitoring user behavior or sniffing the packets that enter and leave the organization’s network, they look for telltale signs of malicious activity, alerting the administrator whenever a possible break-in attempt is detected. Intrusion detection systems are not perfect, however. One major criticism is that they often produce false positives, i.e., alerts that correspond to legitimate user or network activity. Axelsson [2] provides an analysis of network intrusion detection systems (NIDS) that shows, under reasonable assumptions about the activity on a network and the capabilities of the NIDS, if the number of false ∗
[email protected] †
[email protected]
Workshop on Visualization for Computer Security October 26, Minneapolis, MN, USA 0-7803-9477-1/05/$20.00 ©2005 IEEE.
positives is significant, the security administrator’s task of sorting through the alerts for serious threats will be nearly impossible. There has yet to be discovered an optimal solution to the problem of dealing with the typically large number of false positives produced by intrusion detection systems. This problem is exacerbated by the fact that some IDS implementations can be exploited to produce yet more false positives. Patton et al. [9] show how an attacker might take advantage of the ease with which false positives can be generated. By introducing artificial packets into the network he or she can generate false positives in order to mask their actual attack or desensitize the system monitors to an attack they will use in the future. Skilled security administrators may be able to tune the IDS products for their particular networks in such a way as to reduce the number of false positives, but not all administrators may have the time or knowledge to do so effectively. With constantly evolving tools and approaches in the hands of foes, the administrator would also be required to tweak the IDS often, so as to avoid missing the newest types of attacks. A better solution is needed, so that security administrators can spend less time setting up their IDS products and more time looking for and reacting to threats to their resources. In this paper we describe a visual approach to dealing with the amount of information network intrusion detection systems provide. We want to aid the security administrator in detecting as many actual attacks as possible, while also helping him or her recognize the false alarms that would otherwise waste their time. The emphasis of our work is exploring the area of three-dimensional visualization, an approach that has not received much attention thus far in IDS-related visualization. Additionally, we use aggregated statistics about network activity as an additional source of data for visualization, providing the administrator with multiple perspectives on the state of their resources. This paper is organized as follows. In section 2 we discuss previous work related to dealing with IDS alerts and visualization for intrusion detection purposes. We describe our approach in section 3, including details of the aggregated network statistics and the actual visualizations themselves. Section 4 presents the experimental results we obtained during evaluation of our implemented visualizations. Section 5 concludes with a summary of insights and section 6 provides ideas for future work. 2
R ELATED W ORK
Some research has been done in finding ways to work with the large number of alerts produced by various intrusion detection systems using visualization techniques. There has also been a substantial effort recently to directly visualize network information as a sort of intrusion detection system that uses human visual cognition abilities to detect interesting events, rather than relying on knowledge or behavior-based algorithms. Koike and Ohno’s SnortView tool [6] is an example of a twodimensional approach to dealing with network intrusion detection system alerts. A grid with time as the horizontal axis and source IP address as the vertical axis forms the main visualization component. NIDS Alerts and system events are plotted on the grid using symbols that provide an easy way to distinguish different types of ac-
113
tivity. The system events are used as an aid in determining whether an alert is a false positive. For example, a web server log event may indicate that the attack specified in a NIDS alert failed to cause any harm. Alerts that appear multiple times are grouped together by displaying only the first occurrence and overlaying a vertical line in that column to indicate how many more times it occurs. A second grid is placed adjacent to the main grid for the purpose of identifying associated destination IP addresses. By selecting an alert in the main grid, a line is drawn through both grids to highlight the associated source and destination addresses. Detailed textual information for each alert or event is provided at the bottom of the display. Erbacher [3] discusses a method to visualize various network and system activities in an effort to provide enough context for a security administrator to distinguish legitimate threats from normal activity and false alarms. In a two-dimensional display the host being monitored is represented at the center as an outlined circle. The thickness of the outline represents system load, while the number of short lines protruding outward represent the number of users on the system. Starting a little farther out from the circle, lines extend outward towards smaller circles, representing connections from other hosts. The lines are varied by color and drawing style to differentiate between types of connections. Attacks identified by the Portsentry tool are also displayed as thick, bright red lines. Intensity is used to show the time since a node last accessed the monitored host. The distance from the center to an outer circle is determined by how many octets of the IP addresses match; the more that match, the closer the circle is to the center. The exact positioning of a node on a ring about the center host is remembered so that connections from the same host can be identified over time. Finally, the border of the screen is colored according to the time of day. Vert et al. [12] describe a three-dimensional geometric approach to representing system information which could be used as a basis for intrusion detection. A spheroid geometric primitive called a spicule represents the various bits of information related to a single host on a network. The volume of a spicule corresponds to a computed value, based on various factors, that represents the associated host’s security fitness. Individual features are displayed using visual components called tracking vectors and fixed vectors. For features which have minimum and maximum values, tracking vectors travel from the horizontal plane towards the positive vertical axis on the surface of the spicule as the value of the feature approaches its maximum. Features that have no bound on growth are represented by fixed vectors around the equator of the spicule which grow outwards as their values increase. It is proposed that this model could be used for intrusion detection by considering how a spicule changes as a system’s state changes. If a system is known to be in a certain state, such as normal or under attack, the vectors around the spicule for that system may be used as a geometric signature of such a state, represented as angles for tracking vectors and magnitudes for fixed vectors. The geometric signature for a specific attack, for example, could be added to the spicule for a system under normal operation, resulting in a visual of what that system will look like under attack. McPherson et al. developed an interesting visualization focused on TCP and UDP port traffic called PortVis [8]. One challenge faced by network security researchers is the lack of available data sets on which to test ideas. Most organizations are understandably reluctant to release real captured traffic from their actual networks due to privacy concerns. The PortVis tool has an advantage over other efforts in regard to this dilemma because it uses very general information aggregated from network traffic flows. Specifically, the following pieces of data, accumulated over each hour, are used: protocol (TCP or UDP), port, hour, session count, unique source addresses, unique destination addresses, unique source/destination address pairs, and unique source countries. Given the high-level nature of the data being analyzed, an organi-
114
zation that wouldn’t normally allow details of their network traffic to be made public might be less inhibited in allowing the use of aggregated statistics. As it turns out, the PortVis developers were able to use network data from United States Department of Energy sites. The goals for the tool were discovering large-scale attacks and identifying smaller-scale attacks that might be analyzed by people with privileged access to the detailed network traffic. The main visualization consists of a two-dimensional 256 x 256 grid on which each position corresponds to a port; the vertical axis corresponds to the port number mod 256, and the horizontal axis corresponds to the integer value of the port number divided by 256. The color of the dot is determined by the value of a piece of data, which can be selected from the list above, at a given hour. While this part of the visualization takes up the majority of the display space, a number of smaller visuals are included as well. A timeline on the right-hand side gives a higher-level view of the port data. Within the timeline a window may be moved to select the current hour displayed in the main visualization. Back in the main visualization a marker may be moved around to select a small number of ports, which are magnified in a small space at the bottom-left corner of the display. Here the exact port numbers and data values for the selected ports are shown. Further drill-down may be accomplished by choosing one of the magnified ports, which then causes a three-dimensional timeline of all five data categories to be displayed in a window to the right of the magnification window. This timeline conveys the values of each data attribute, and the user is allowed to rotate the port timeline display about the vertical axis to get different perspectives. Finally, a fifth area of the display, called the gradient editor, is used to control the mapping from data values to colors in the main display. This allows the user to highlight different attribute values in the main display. Atkison et al. use a three-dimensional visualization approach to detect network intrusions in telnet traffic [1]. Using tcpdump data from the 1998 data set generated by MIT’s Lincoln Laboratory, telnet sessions are extracted and fed into the Telltale document analysis system, where each session is considered a single document. After a number of sessions have been entered, another session can be used as a query against them to get a similarity score. By using a session with a known attack as the query, the group of previouslyentered sessions can be scanned for other instances of the attack. Atkison et al. do this for multiple groups of sessions, and then visualize the resulting similarity scores using the glyph-based threedimensional SFA visualization system. Three different telnet sessions that included a buffer-overflow attack are used as queries to generate similarity values that are mapped to each of the three dimensions. The farther out from the origin a glyph appears, the more likely the associated group of sessions contains an attack. 3
O UR A PPROACH
We focused on developing a variety of three-dimensional visualizations, each one emphasizing different aspects of the data. We first discuss the types of data used as input and some techniques for data reduction, followed by descriptions of each of the visualization concepts. 3.1
Data Sources
We used two primary sources of data as input for our visualizations, though not all of the visualizations make use of both types of data. NIDS alerts are the first source, representing any suspicious signs of malicious activity as detected by the intrusion detection system. In this case we chose to use the open-source NIDS Snort, due to its popularity in the security community and free availability. The components of an alert that we focused on in the visualizations were the timestamp, priority, source and destination IP addresses, and the
destination port if the alert was associated with TCP or UDP traffic. We used the alert message text to provide additional information for the user in one of our visualizations. Secondly, we incorporated information on raw network activity as another piece of data for visualization. As one of the common criticisms of intrusion detection systems is difficulty in dealing with false alarms, we wanted to add some background information that might help the user of the visualization make a more informed decision on whether a particular alert is in fact serious. We also discovered that some attacks were evident from visualizing the network activity alone. In particular, we decided to focus on TCP and UDP traffic since these transport layer protocols provide the basis for almost all application-level protocols. 3.2
Data Reduction
Given the volume of network traffic on even a medium-sized network, we needed to use some data reduction techniques to make the network traffic data more manageable. The first technique we used was aggregation of statistics about the network traffic over small time periods. As our aim was to provide a fairly high-level picture of activity, we chose a time period of five minutes. The basic unit of information we consider is a tuple of three elements: (source IP address, destination IP address, destination port) Xin [13] calls this tuple an SDP and uses it as a correlation feature in his own work on visualization for network intrusion detection. In each five minute period, we aggregate the following information for each SDP:
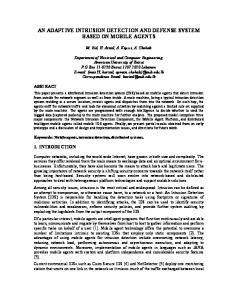
Figure 1: Island screenshot
3.3
We came up with three visual concepts, each one creating a different picture for the user. Each visualization does not necessarily use all pieces of information from the packet aggregation process or the IDS alerts, but each piece of information is used by at least one concept. A brief description of each idea follows, along with sample screenshots. 3.3.1
• Size of payload in bytes • Number of packets seen We utilized a second data-reduction technique to eliminate superfluous SDPs. Consider that when an application on host A sends the first TCP or UDP packet to a listening application on host B, host A must allocate a port from which the packet will be sent. While the operating system has some internal algorithm for allocating these ports, the actual port number chosen does not generally give any useful information to the external observer. If host B then sends a response, it uses the allocated source port on host A as the destination port in each packet. Since our aggregation tool simply looks at the destination port in each packet, it would normally aggregate information about each of these allocated ports separately. Our view is that aggregating data separately for the dynamically allocated ports does not provide enough useful information to the user of our system to warrant the tracking of such statistics. Thus, we give the user the option of aggregating the statistics of traffic destined for these dynamically allocated ports with the statistics of traffic destined for the associated privileged port. This option helps the user avoid being overwhelmed with less useful information in the visualizations. If neither port in a connection is privileged (less than or equal to 1024), the statistics are aggregated for each destination port separately. The only potentially useful information we lose by doing this reduction concerns the number of connections made from one host to another. With regard to intrusion detection, this could be useful as an indicator of a malicious activity like password-guessing (an attacker makes multiple telnet or ssh connections, guessing a different password each time). A solution to address this would be to incorporate a count of the number of source ports associated with each SDP. Adding this feature into the visualizations may provide an extra piece of useful information.
Visual Concepts
Island
The Island concept (figure 1) takes an iconic approach to visualization using a tree metaphor, somewhat similar to the twodimensional EventShrubs Teoh et al. created to characterize Internet routing data [11]. Our approach differs in that we use a threedimensional tree structure capable of representing a larger number of attributes, and we are visualizing TCP and UDP traffic rather than routing data. We use only the aggregated packet information in this visualization to create a port-centric view. As the SDP data is processed each record is sorted into a data structure, first by the time period it falls into and secondly by destination port. We use a five minute time period granularity, which is the same as the data reduction tool. For each of these (time period, port) records, we maintain lists of associated source IP addresses and destination IP addresses, as well as the number of bytes of payload transferred. The island idea works as follows: positions on the surface of the island represent the full port range, 1 to 65535, and tree figures are placed on these positions to represent active destination ports during a time range. The privileged ports, 1 to 1024, are given positions on three invisible concentric rings at the outer edge of the island. Ports 1025 through 65535 are positioned on the inside of these outer rings. Starting a little further towards the middle of the island, these ports are given positions which spiral inwards toward the middle as their port numbers increase. By arranging ports in this circular fashion, we maintain some visual grouping of ports that are numerically close to one another, which may prove useful in detecting some types of attacks like small-scale sequential port scans. While there are a number of services that have assigned port numbers above 1024, they are not as many as those in the privileged range, and the majority of port numbers above 1024 are used for dynamic allocation as source ports. Given this, we are not concerned that a user would find it difficult to predict where on the island a port with a high number would appear, since most of these port numbers have no intrinsic meaning.
115
The trees on the island are thus drawn at positions based on destination ports. We make use of the additional information accumulated for each port by drawing a number of features based on that information. First of all, multiple branches are drawn perpendicular to a tree’s trunk to represent the associated destination IP addresses. We split the address into its four octet components and use the individual octets to affect how the branch is drawn. The first, mostsignificant octet determines at what angle about the trunk’s axis the branch will be positioned. The second octet determines the height at which the branch is attached to the tree. The third octet is used to determine how far out on the branch to draw a smaller twig, and the fourth octet determines the angle about the branch’s axis to position the twig. Thus each of the four components of an IP address affects a different property of the corresponding branch. Similar to the branch idea, we draw leaves at the top of the tree based on the components of the associated source IP addresses. The first and second octets are used to select a color in the red and green components of RGB color space. The third octet determines the angle about the tree to position the leaf, and the fourth octet affects how far the leaf extends out from the tree. Finally we make use of the number of bytes transferred by drawing a purple sphere at the top of each tree, which could be thought of as a piece of fruit. The size of the fruit is logarithmically related to the number of bytes, and the fruit is not drawn if no bytes of payload were transferred. The user can move through the time domain in this visualization using keyboard input. As the time period changes, the state of trees and their features change to reflect each period’s aggregated statistics. Some services will cause trees to be visible for almost every time period, such as high-traffic web servers and domain name service daemons. Other services may appear much less frequently, and in the case of some malicious activity maybe only once. Consider a trojan application that an attacker manages to get installed on a target system. If the application is designed to open a backdoor remote login service on a high port at a certain time, the attacker may only make use of it once for a short period of time. While our visualization should render a tree associated with this activity, if the user is scrolling through the time dimension quickly they may miss it as it would only be a blip. To address this we added one more feature, which may be toggled while the visualization is running. After rendering the trees for the current time period, if this feature is enabled, trees for each of the previous five time periods will be rendered simultaneously. Each of the previous time periods is rendered with increasing transparency as they go farther back in time, allowing the user to still focus on the opaque trees of the current time period while having some sense of the recent history. 3.3.2
Alert Plot
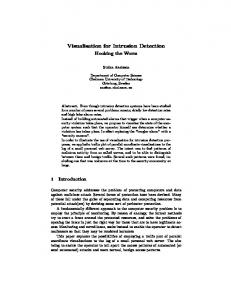
For this visualization (figure 2) we focus on the NIDS alerts instead of the packet aggregation information. Though individual elements of this visualization are essentially two-dimensional, the three dimensional environment allows us to easily arrange the elements in arbitrary planes, making creative use of screen space, and the camera interaction provides a means of zooming in on the rendered data. A rectangle with three panels is drawn in the foreground. The horizontal axis of the panels represents the time domain, while the vertical axis represents port numbers. We provide different levels of view of the time domain by using a different scale in each panel. The rightmost panel represents one hour of time, the middle panel represents the previous twenty four hours, and the leftmost panel represents the previous week. For each NIDS alert that falls into the time range currently in view, we draw a small cube at the position corresponding to its time of detection and associated destination port (or 0 for ICMP packets). The cubes are color-coded by the priority of the associated alert, which ranges from highest priority (1, red) to lowest priority (5, blue). User input shifts the current period of time in view.
116
Figure 2: Alert Plot screenshot
We first tried plotting alerts vertically based on port numbers using a linear scale, but this proved unsatisfactory as it was very difficult to distinguish between port numbers in the lower, privileged range (1-1024). We next tried using a logarithmic scale to give more space to the privileged ports, but this had the side-effect of compressing the many alerts associated with higher port numbers into a very small space; we had essentially the same problem as before. Our current solution uses a hybrid scale. The lower half of the vertical axis represents ports 0 through 1024, where 0 is used for alerts associated with ICMP traffic. The upper half is split into 1024 positions, and the rest of the port range is mapped to these positions by taking the port number modulo 1024. This technique provides better spacing between ports while also allowing for interesting clusters of alerts to appear, such as those that might be associated with a port scan. As Koike and Ohno note [6], alerts that are identical in all properties except time may often occur repeatedly. Our experience corroborates this as well, and in fact, during our evaluation phase, there were some portions of the evaluation data set that produced so many alerts as to cause a major decrease in the responsiveness of this visualization. We needed to draw fewer alerts in these cases, and our solution borrows from that of Koike and Ohno. We render the first alert in such a series as a cube, and then draw a horizontal line to the position that the last alert in the series would have occupied had it been rendered. This grouping of alerts is done as the visualization processes the incoming alert data. It remembers the most recent time it saw each alert, and as each new alert is processed we check if one of the same type, with the same destination port and associated IP addresses, has been seen before. If it has been seen, and the new alert occurred within a predefined window of time after the previous one, we group the new alert with the old one instead of creating a new record. The grouping is done simply by maintaining two timestamps for each alert: the timestamp of the first alert in the group and the timestamp of the last alert in the group. If the two timestamps match, then the ”group” actually represents a single alert. In addition to the foreground panels, we also draw two more panels farther in the background, above the alert panels and slightly angled. The left of these two panels represents internal IP addresses associated with alerts, where the vertical axis represents the third octet and the horizontal axis represents the fourth octet. The panel on the right represents external IP addresses associated with alerts, where the vertical axis represents the first octet and the horizontal axis represents the second octet. Thus, each panel is a 256 by 256
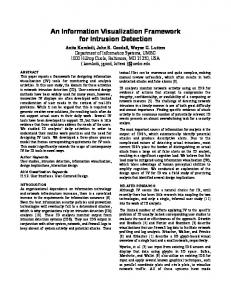
Figure 3: Trends screenshot
grid of points. The grid of the left panel provides positions for each host of a class B network, and the grid of the right panel provides positions for each class B network. When an alert is drawn in the rightmost panel of the rectangle in the foreground (i.e., when it is in the hour-long panel), lines are drawn up to either or both of the IP address panels to indicate which addresses are associated with that alert. The lines are color-coded to indicate whether the destination and source addresses are internal or external. Some alerts may be associated with two internal addresses or two external addresses, while others involve traffic between an inside host and an outside host. The technique used here is similar to that of parallel coordinates [4], except instead of using parallel axes in two dimensions, we are using ”parallel” planes in three dimensions. The planes in this visualization are not truly parallel, of course, but the idea of representing multi-dimensional data is similar. Alerts may be toggled on or off by priority so that if, for example, there are many alerts of priority two on screen, we can disable them to see if they were covering any alerts of priority one. Additionally, the user may use the mouse to click on a cube in order to display the textual details of the corresponding alert.
ically probed a small number of times during a short time span from a single source. Activity from a web server, however, would likely include numerous connections from a variety of sources over many time periods and would easily pass the threshold for inclusion. As the name implies, we also wanted to visualize longer-term trends in the network traffic along with the actual measured traffic for each time period. We accomplish this by first computing average values of traffic amounts as the aggregated packet data is read in. The average values computed for each time period are based on a predetermined length of time preceding that time period. For example, for this work, we configured the visualization to calculate the average amount of traffic per hour, based on the previous twelve hours of data. We then visually represent both the average value for a given time period, as well as the actual value. The average value is represented by a transparent red bar, and the actual value is represented by an opaque blue bar which has a slightly smaller footprint, thus fitting inside the footprint of the red bar. By rendering the opaque bar inside the transparent bar, we assist the user in comparing what is actually happening at that time period with the average for that time period based on recent history. For example, this may help a user see that a service which normally sees a constant, significant amount of traffic, like a web server, has suddenly dropped off to nothing, possibly indicating a compromised system, or simply a normal maintenance issue. In addition to aggregated packet data, we also represent alerts by drawing color-coded spheres above each location on the grid. The spheres are drawn in relation to the bars, so the bars will not occlude them. As in the other visualizations, here to the user can travel through the time dimension using keyboard input. 4
To evaluate the visualizations we used the 1999 data set from the well-known DARPA Intrusion Detection Evaluation project at MIT’s Lincoln Laboratory [7]. In addition to aggregating information from the raw network data, we also processed the tcpdump files with Snort [10] to generate the NIDS alerts used in some of the visualizations. We used Snort’s default rule configuration. 4.1
3.3.3
Trends
Finally, the Trends visualization (figure 3) is an attempt to visualize both the packet aggregation information and the NIDS alerts. The layout is a grid in the x-z plane whose dimensions represent time and port numbers. The port axis does not have a position for every port, but rather it is dynamically modified as the aggregated data is read in, such that a position is created for each port seen in the data. These positions on the axis are sorted from low to high and labeled in the visualization. At each point on the grid, then, if there exists data for that time period and port number, we draw a bar along the y-axis representing the associated amount of data. The measurement of data can be toggled between number of packets and number of bytes. Because we are giving much more space to each port in this visualization, compared to Island, we discovered that we needed to be careful about which ports we decided to put on the port axis. If an attacker runs a port scan, for example, we might have a thousand or more destination ports that have seen activity. If we include all these ports on the port axis the display grows much too large. We addressed this by requiring each port to be seen a small number of times, either in distinct time periods or associated with different IP addresses, before it is included in the display. This way we exclude the activity from port scans, where each port on a single host is typ-
R ESULTS
Data reduction results
The reduction of the amount of data achieved with our aggregation tool was significant. The 1999 data set contained roughly 8.6 GB of tcpdump data, and our tool initially reduced that to 24 MB of aggregated statistics. Using the superfluous SDP reduction option, that data is further reduced to 3.6 MB. It should be noted that while the original tcpdump data includes many types of traffic, our tool only aggregates statistics using TCP and UDP packets. Certainly a large majority of the data in the tcpdump files would consist of TCP or UDP traffic, however, as these are the transport layer protocols widely used for most network applications. 4.2
Visualizations results
In the following sections we describe the results for each of the visualizations. We discuss some specific attacks that are visible and how they are manifested in the particular visualization. For the visualizations that make use of aggregated network statistics, we used the data produced by our aggregation tool with the superfluous SDP reduction option enabled. Note that specific information describing the attacks in the 1999 Lincoln Labs data sets is taken from Kris Kendall’s MIT Master’s thesis [5]. All times are given in 24-hour format for the United States Eastern timezone, which is the timezone in which the data set was originally created.
117
4.2.1
Island
One attack that produces some noticeable visual clues in this visualization is httptunnel. This attack involves a multistep process where the attacker must first gain access to a target machine and install an HTTP client program. The client is set up to periodically connect to a predetermined HTTP server which is controlled by the attacker. After the client is set up, possibly using the system’s scheduling facilities to run it at a certain time each day, the attacker can log off of the target machine. Each time the client connects to the attacker’s HTTP server, the server may send a cookie to the client with instructions embedded in it for the client to carry out. For example, the cookie may tell the client to send the contents of the password file back to the server. While the first step in the attack of installing the HTTP client is not visible, the second and more interesting step occurs during both weeks of test data; four instances from the second week, starting on April 5th, are highlighted in the series of screenshots in figure 4. The client is actually installed at 9:00 on March 30th, the Tuesday of the first week, and the first automatic connection by the client to the attacker’s HTTP server occurs shortly after 12:00. It is this second type of activity that is visible in the Island visualization. Leading up to this time period the middle of the island, representing port numbers greater than 1024, is fairly empty. A few lone trees appear in the middle area from time to time, representing, for example, the client end of an Internet Relay Chat (IRC) connection. Since IRC daemons typically use port 6667, which is greater than 1024, the data reduction technique described in the previous chapter does not aggregate the statistics of traffic leaving the IRC server in with the statistics of traffic destined for the server. Thus, a few spurious trees appearing in the middle of the island are not necessarily cause for alarm. What should draw the attention of the viewer, however, is the row of trees that appears just after 12:05 on March 30th (very similar to those seen in the figure). Representing packets with destination port numbers 32991, 32992, 32993, 32994, 32998, 32999, 33000, 33001, 33002, 33004, this row of trees seems out of place compared to the activity on the island during the previous day. Moving through the time periods before and after this occurrence the user would notice that these ports are only in use during this one five minute period the entire day. If these ports were associated with some typical resource usage, one would assume they would appear multiple times in a day, or at least in similar patterns. While viewing the traffic for the following day, the user would likely notice that in fact a similar pattern does occur, in a different location. Again, just after 12:05, on March 31st, a row of trees appears briefly, representing a similar, but not identical, set of ports (32928, 32929, 32930, 32931, 32932, 32933, 32935, 32936, 32937, 32938). We provided a keyboard shortcut in this visualization to skip exactly 24 hours forward or backward from the current moment on display, and making use of this one can quickly see that this pattern of trees appears a total of four times during the first week of test data, at the exact same time range on each of March 30th, 31st, April 1st, and April 2nd. If the user continues to check this time period in the second week of test data, they will see that the patterns appear again every weekday, April 5th through April 9th. What makes the appearances in the second week more interesting than those in the first week is the fact that on two of the days, April 6th and April 8th, fruit are drawn above one of the trees in the group (highlighted by the blue arrows in the figure), indicating that some amount of data transfer occurred. During the first week no fruit are drawn, meaning that while connection attempts were made, none of the network packets had any payload. The other features of the trees indicate that in each case it is likely that the same source and destination IP addresses are involved. The leaves at the top of each tree in these groups appear to have the same tone of color, the same angle of rotation about
118
Figure 4: Island visualization: httptunnel attack
the tree trunk, and the same length. Thus the source IP address is very likely the same. Similarly, the branches all appear to have the same angle of rotation about the tree trunk, the same height from the ground, and the twigs appear to be at the same distance on the branch and in the same orientation as well. Thus the destination IP address is also very likely the same. There is the possibility that two source or destination addresses might differ by one in the most significant octet, for example 1.2.3.4 and 2.2.3.4. In this case the addresses most likely belong to completely different networks, but they would appear very similar as presented in the visualization. The exact addresses would be uncovered, however, when the user decides to investigate further through whatever means are available. This could include future implementation work in this visualization to provide drill-down features for getting at the data, or utilization of an external network logging facility. Regarding the discovery of the httptunnel attack based on the activity in the visualization, the precise periodical nature of the group of trees during four days in week one and five days in week two would suggest something like a scheduled or long-running process. Since the destination port numbers vary from day to day, one might assume these are dynamically allocated source ports used by the mystery program to connect to some service on the destination host. At this point a curious or concerned security administrator could check the local host in question and try to find some trace of the program by looking at the scheduling system configuration or the list of running processes. If the ports continue to show up each day, it would be relatively simple to temporarily log which processes on that host are making network connections during that time period. 4.2.2
Alert Plot
An example of malicious activity that is visible in the Alert Plot visual is the dictionary attack (Figure 5). This is a Remote to Local attack in which the adversary tries to guess a user’s password on a particular host by repeatedly making connections to user services like telnet and FTP, guessing different passwords each time. The particular dictionary attack that occurs at 16:32 on April 5th, 1999 produces over 80 telnet connections during a period of roughly 16 minutes. The associated alerts produced by Snort are clustered together because of the short time span and the destination port numbers falling close together. In this case, however, it is interesting that the destination port numbers appear to be the dynamically allocated source ports on the connecting host of the attacker, rather than port 23 on the telnet server. This is because Snort detects the failed password guesses in the payload of the telnet packets headed back
Figure 5: Alert Plot visualization: dictionary attack
to the attacker, typically containing a message like Login failed. Since the attacker keeps making connections, the allocated source port on his or her machine is continually being incremented. This attack is quite hard to miss in the visualization as it passes through the right-most segment of the alerts grid. The lines drawn from alerts to IP addresses form dense fan shapes which stand out against the other less frequent alerts and associated lines. Additionally, this attack should cause the administrator further concern due to the fact that the related network traffic is both destined for and originating from the local network. This is a strong indicator that either a trusted employee is trying to break into a system they are not authorized to access, or else an attacker has already broken into one local system and is using it as a stepping stone to attempt to break into another. 4.2.3
Trends
The main attack we noticed using the Trends visualization was the udpstorm Denial of Service attack. This attack occurs twice during the testing period, first on April 5th, 1999 at 20:00:07, and second on April 7th, 1999 at 05:30:38. A udpstorm attack causes a large amount of network traffic with the intent of causing congestion and slowing the network down. The basic idea is to link two UDP services on two hosts such that they each cause the other to produce output in a continuous fashion. In the two instances in the Lincoln Labs data set, a spoofed UDP packet forged to look like it originated from the echo port (port 7) of one internal host is sent to the echo port of another host on the same network. Because the echo service simply replies to any data it receives with a copy of that data, the effect is a sudden burst of network activity between the affected hosts. The activity does not cease until the echo services on the hosts are restarted. This burst of network activity shows up quite clearly in the Trends visualization (Figure 6). As seen in the screenshot, the activity on the echo port in the very first row is nonexistent until the time period of the first attack, which occurs about halfway down that row. The visualization was configured to display the average network activity per hour based on the accumulated activity from the previous twelve hours. Recall that the time label for each column indicates that the bars in that column represent activity that occurred over the previous hour of time. Thus, the network activity of the first udpstorm attack, which occurred during the 20th hour of that day, shows up in the column labeled Mon Apr 5 21:00:00 1999. The height of the bar indicates that over one million bytes were seen in that hour, and with knowledge of the echo service’s
Figure 6: Trends visualization: udpstorm attack
intended function as a debugging tool, this activity should draw the user’s attention. 5
C ONCLUSION
As we developed and evaluated these visualizations, we gained a number of insights regarding our successes and failures, the kinds of attacks that can be visualized, and the advantages of using threedimensional graphics. One insight relates to the three-dimensional nature of our visualizations. While it may be obvious, we feel that it warrants explicit mention as we have not seen much research using similar techniques. The insight is that, by implementing each of our visual concepts in true 3D space, we gained a built-in drill-down of sorts from the basic camera transformations we implemented: zoom, rotation, and pan. For each of our three concepts, this ability proved quite valuable. In the Island and Trends visuals, orbiting the camera about the central elements was key to finding the best perspective to investigate a particular time period or portion of the display. Because we visualized data in three-dimensional space, some graphical elements would occlude others, especially in the Trends visual, and camera manipulation was necessary to fully investigate many scenes. Zooming and panning were also useful. In the Island visual one can get a feel for which ports are being used with the camera at a distance such that the entire island is in view; after noticing suspicious port activity, the user is able to move the camera in close to the particular tree and look at the leaves and branches to get an idea of the source and destination IP addresses involved. In the Alert Plot visualization, the panning and zooming functionality aids the user in examining clusters of alerts up close, as well as making it easier to more precisely select individual alerts to get their textual description. Admittedly, the camera transformations may add to the learning curve of using the visualizations, especially for those who are used to more static displays, but we believe the benefits of full three-dimensional exploration make the extra effort worth it. From our initial experience with these visualizations, there appear to be two visual characteristics that cause an attack to stand out: it either generates a noticeable pattern or it does not fit in with the surrounding data or the user’s expectations. More difficult to detect, however, is an attack that requires only a few small transfers of data. Many buffer-overflow exploits would fall into this category, and the attacks that hit services which normally see high amounts of traffic would be particularly difficult to notice. While the httptunnel backdoor-type attack is not an exploit, it does show up despite the
119
relatively little amount of data involved. It is noticeable because, for whatever reason, the installed HTTP client tries 11 connections in rapid succession to port 8000 on an external host, which causes 11 nearly consecutive source ports to be used on the client side. Since 8000 falls above the threshold for SDP reduction in our aggregation tool, each of the source ports is recorded in a distinct SDP when the server sends its responses back to the client, and they are thus displayed as a cluster in the Island visualization. Add to this the fact that the clusters of ports appear nine out of ten days during the exact same time period, and this traffic stands out as being suspicious. Finally, when moving through the time domain in a visual like Island, where one time period scene replaces the previous, one sees some port activity flash on and off in brief spurts. By watching the visual as a whole, one can in some cases match up source and destination ports by noticing which ports seem to be synchronized. This was noticeable with 6667, the IRC service port, and the high source ports of a few clients making connections. One would also be able to notice, if paying close attention, that port 8000 seemed to see traffic at the same time as the range of source ports involved in the httptunnel attack. 6
F UTURE W ORK
One obvious area for future work is that of drill-down and interaction techniques. Rendering our visualizations as polygonal models in true three-dimensional space provided a simple built-in drilldown ability using a camera model. More useful, however, would be functionality such as automatically rendering more detailed textual information as the camera closes in on a few individual elements of the visualization, or responding to user input on the mouse or keyboard by switching to a different, related visualization that provides finer-grained detail of an element from the previous scene. We started exploring three-dimensional visualization to see what kinds of patterns show up that would attract the user’s attention, and there is plenty of room for work in what to do after the attention has been obtained. Another area of work involves figuring out what features, when visualized, would help reveal the difficult-to-detect attacks. These are the ones that need little time or data to succeed, such as buffer overflow exploits. One way to think about such attacks may be to visually characterize the payload content of each packet. If one could generate some kind of visual signature based on the payload in a manner that makes legitimate traffic on a port look homogeneous in some way, then the payload associated with a buffer overflow attack might be different enough to create a noticeable visual anomaly. The downside to this is that more processing time would be needed to capture and analyze the full payload of each packet. With regard to data storage, another useful area for future work would be determining how to best store collected data to be visualized. We used the network traffic aggregation tool to reduce large amounts of raw network traffic to more manageable pieces of information, but we did not consider how to best store the reduced information, especially for use in an actual deployment where network information and NIDS alerts would be produced on a continual basis. A major challenge with respect to interactive visualization is making the data available to the visualization program in a timely manner so as to avoid affecting its responsiveness. With larger amounts of data we cannot simply read it all at once from disk into main memory. Finally, the creative area of developing visualization concepts always has room for new ideas. We barely scratched the surface with the three concepts developed in this work, but we hope they will serve as some kind of inspiration, or a potential starting point, for others. Just as the minds of the most skilled attackers are both sharp and creative, so too must be the minds of those working to
120
provide a balance through tools and techniques. R EFERENCES [1] Travis Atkison, Kathleen Pensy, Charles Nicholas, David Ebert, Rebekah Atkison, and Chris Morris. Case study: Visualization and information retrieval techniques for network intrusion detection. In Proceedings of the Joint Eurographics-IEEE TCVG Symposium on Visualization (VisSym01), 2001. [2] Stefan Axelsson. The base-rate fallacy and its implications for the difficulty of intrusion detection. In Proceedings of the 6th ACM Conference on Computer and Communications Security, pages 1–7. ACM Press, 1999. [3] Robert F. Erbacher. Visual behavior characterization for intrusion detection in large scale systems. In Proceedings of the IASTED International Conference on Visualization, Imaging and Image Processing (VIIP 2001), pages 54–59. ACTA Press, 2001. [4] Alfred Inselberg. N-Dimensional graphics, part I – lines and hyperplanes. Technical report, Los Angeles Scientific Center, IBM, 1981. [5] Kris Kendall. A database of computer attacks for the evaluation of intrusion detection systems. Master’s thesis, Massachusetts Institute of Technology, 1998. [6] Hideki Koike and Kazuhiro Ohno. SnortView: Visualization system of snort logs. In Proceedings of the 2004 ACM Workshop on Visualization and Data Mining for Computer Security, pages 143–147. ACM Press, 2004. [7] Richard Lippmann, Joshua W. Haines, David J. Fried, Jonathan Korba, and Kumar Das. The 1999 DARPA off-line intrusion detection evaluation. Computer Networks, 34(4):579–595, 2000. [8] Jonathan McPherson, Kwan-Liu Ma, Paul Krystosk, Tony Bartoletti, and Marvin Christensen. PortVis: A tool for port-based detection of security events. In Proceedings of the 2004 ACM Workshop on Visualization and Data Mining for Computer Security, pages 73–85. ACM Press, 2004. [9] Samuel Patton, William Yurcik, and David Doss. An achilles’ heel in signature-based IDS: Squealing false positives in SNORT. In RAID 2001 Program, 2001. http://www.raidsymposium.org/raid2001/program.html, accessed April 2005. [10] Martin Roesch. Snort–lightweight intrusion detection for networks. In Proceedings of LISA ’99: 13th Systems Administration Conference, pages 229–238, 1999. [11] Soon Tee Teoh, Kwan-Liu Ma, and S. Felix Wu. A visual exploration process for the analysis of internet routing data. In Proceedings of IEEE Visualization, 2003, pages 523–530, 2003. [12] Greg Vert, Deborah A. Frincke, and Jesse C. McConnell. A visual mathematical model for intrusion detection. In Proceedings of the 21st NIST-NCSC National Information Systems Security Conference, pages 329–337, 1998. [13] Jianqiang Xin. Feature selection and visualization techniques for network anomaly detector. Master’s thesis, Iowa State University, 2003.