Statistics & Operations Research Transactions SORT 40 (1) January-June 2016, 139-152 ISSN: 1696-2281 eISSN: 2013-8830 www.idescat.cat/sort/
Statistics & Operations Research © Institut d’Estad´ıstica de Catalunya Transactions
[email protected]
Exploring Bayesian models to evaluate control procedures for plant disease Danilo Alvares1 , Carmen Armero1 , Anabel Forte1 and Luis Rubio2
Abstract Tigernut tubers are the main ingredient in the production of orxata in Valencia, a white soft sweet popular drink. In recent years, the appearance of black spots in the skin of tigernuts has led to important economic losses in orxata production because severely diseased tubers must be discarded. In this paper, we discuss three complementary statistical models to assess the disease incidence of harvested tubers from selected or treated seeds, and propose a measure of effectiveness for different treatments against the disease based on the probability of germination and the incidence of the disease. Statistical methods for these studies are approached from Bayesian reasoning and include mixed-effects models, Dirichlet-multinomial inferential processes and mixed-effects logistic regression models. Statistical analyses provide relevant information to carry out measures to palliate the black spot disease and achieve a high-quality production. For instance, the study shows that avoiding affected seeds increases the probability of harvesting asymptomatic tubers. It is also revealed that the best chemical treatment, when prioritizing germination, is disinfection with hydrochloric acid while sodium hypochlorite performs better if the priority is to have a reduced disease incidence. The reduction of the incidence of the black spots syndrome by disinfection with chemical agents supports the hypothesis that the causal agent is a pathogenic organism.
MSC: 62C10, 62F15, 62J12, 62K15, 62P12, 92B15. Keywords: Dirichlet-multinomial model, logistic regression, measures of effectiveness, tigernuts tubers.
1. Introduction Tigernuts growing has become an important sector of agribusiness in Valencia (Spain). Tigernut tubers are mostly used for the production of orxata, a white soft sweet drink
1 University
of Valencia, Spain.
[email protected],
[email protected],
[email protected] Institute for Agricultural Research, Spain.
[email protected] Received: November 2015 Accepted: April 2016
2 Valencian
140
Exploring Bayesian models to evaluate control procedures for plant disease
highly appreciated in Spain (Morell and Barber, 1983). The trade around orxata has expanded over the past few years but it has been also strongly affected by the appearance of black spots in the skin of tigernuts, making it crucial to figure out how to palliate its negative effects. Epidemiological data and some greenhouse experiments (unpublished) suggest that the syndrome of black spots could be a disease caused by an unidentified pathogenic organism, which prevent to devise specific strategies to eradicate or control the disease. This lack of information and the difficulties in identifying the aetiology of the disease suggest assaying several general methods of disease control based on selecting pathogen-free seeds or removing the pathogens from seeds by thermal or chemical treatments which have been successfully applied to known pathogenic species of viruses, bacteria and fungi and different crops (Shepard and Claftin, 1975; Sauer and Burroughs, 1986; Grondeau et al., 1994), including tigernuts (Garc´ıa-Jim´enez et al., 2004). Moreover, the possible adverse effects in humans are not known so severely diseased tubers are automatically discarded, and only asymptomatic and mildly affected tubers are marketable. Chemical or thermal treatments can have a detrimental effect on seed germination, which causes yield reduction. Thus, the effectiveness of these methods must be assessed not only by considering the effect on the disease incidence but also on the germination. We evaluated two methods of disease control: i) selection of non-infected tubers used as seeds, and ii) chemical or/and thermal treatments (alone or combined) of infected seeds in order to remove or kill the pathogen. However, for method i), since the pathogen cannot be properly identified and it is not possible to detect pathogen-free seeds, the selection is based on the use of asymptomatic (without black spots) tubers. These seeds could contain the pathogen, although in lower quantities than those severely affected (with black spots covering the whole surface). The aim of this paper is to gain insight into the transmission of the disease from the tubers used as seed to the progeny of tubers, as well as the procedures for disease control. To the best of our knowledge, this is the first paper devoted to study the black spot disease in tigernuts from a statistical point of view. The structure of this paper is as follows. Section 2 presents two experimental studies specifically designed for the problem. Section 3 discusses the statistical modelling of the data. In particular, Subsections 3.1 and 3.2 analyse the weight of tubers harvested from symptomatic and asymptomatic seeds, and the disease transmission through a mixed-effects model based on the lognormal distribution and the Dirichlet-multinomial inferential process, respectively. Subsection 3.3 deals with effectiveness of different treatments against disease in terms of mixed-effects logistic regression models and a measure of effectiveness which takes into account the germination process and the level of affection of the disease. Conclusions and further remarks are given in Section 4.
Danilo Alvares, Carmen Armero, Anabel Forte and Luis Rubio
141
2. Experiments and data Two different greenhouse experiments were designed and carried out with the objective of learning about the black spot disease in tigernuts. Experiment 1 was aimed at studying the transmission of the disease from seed to the harvested tubers, and Experiment 2 at analysing the consequences of different treatments against disease.
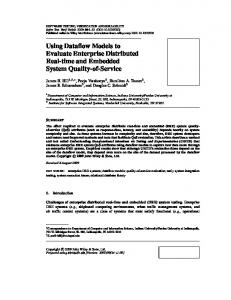
Experiment 1: Asymptomatic and severely affected seeds were selected and sowed in seven separated pots with five seeds per pot. Five months later, sowing tubers were harvested. The average weight of a tuber (in grams) and the number of asymptomatic tubers (no black spots), with mild symptoms (few small black spots), and severe symptoms (tuber almost completely covered by black spots) in each pot were recorded (see Figure 1). Experiment 2: Chemical and thermal treatments were applied to severely affected seeds following a balanced two-factor factorial design. The specific combination of both types of treatments is denoted by Tqt , where subscripts q and t represent chemical and thermal treatment, respectively. Chemical treatments tested were: no treatment (q = 1); disinfection with sodium hypochlorite (q = 2); disinfection with hydrochloric acid (q = 3); treatment with trifloxystrobin, an active fungicide against a wide range of fungal plant pathogens (q = 4); application of a plant defence activator (q = 5); and disinfection with trisodium phosphate (q = 6). In the case of thermal treatments: no treatment (t = 1); incubation in water at 55◦ C for 30 min (t = 2); and 60◦ C for 30 min (t = 3). Eight pots were sowed with five seeds each for every Tqt treatment. Germination rate was estimated from the number of seedlings emerged in each pot during the next two weeks. About five months later tubers were harvested and the number of marketable (asymptomatic and mildly diseased) and severely diseased tubers in each pot were registered. Table 1 summarizes the data from Experiment 1 together with those from Experiment 2 corresponding to the absence of chemical and thermal treatment. We joined the data from both experiments because they were independent and shared a common scenario. There seems to be no great differences in the mean and standard deviation of the unit weight of tubers of both groups. However, there are considerable differences in the proportion of tubers in each level of disease infection. It is important to emphasise the strong relationship between tubers and seeds severely affected.
Figure 1: Tigernuts tubers with different levels of symptoms: asymptomatic, mild, and severe.
142
Exploring Bayesian models to evaluate control procedures for plant disease
Table 1: Mean and standard deviation of the unit weight of tubers (in grams) and proportion of asymptomatic tubers, with mild and severe symptoms from asymptomatic and severely affected seeds. Seeds
Asymptomatic Severe
Unit-weight Mean
Sd
0.424 0.409
0.0846 0.0689
Tubers Asymptomatic Mild Proportion 0.698 0.003
0.228 0.176
Severe 0.074 0.821
Table 2 shows the proportion of marketable tubers harvested and of germinated seeds with regard to each particular chemical and thermal treatment. The thermal treatment at 60◦ C for 30 min, independently of the chemical treatment, dramatically reduced the germination rate. Notice that no data were collected for T33 since no seeds germinated. Table 2: Proportion of marketable harvested tubers and of germinated seeds (in brackets) for each treatment. Chemical treatment No treatment No treatment Disinf. with sodium hypochlorite Disinf. hydrochloric acid Fungicide Activator plant defense Disinf. with trisodium phosphate
0.151 (0.425) 0.403 (0.450) 0.228 (0.625) 0.209 (0.475) 0.388 (0.375) 0.257 (0.325)
Thermal treatment 55◦ C for 30 min 60◦ C for 30 min 0.423 (0.275) 0.373 (0.275) 0.136 (0.225) 0.148 (0.275) 0.359 (0.375) 0.404 (0.150)
0.474 (0.025) 0.552 (0.075) — 0.552 (0.050) 0.191 (0.025) 0.123 (0.050)
3. Statistical modelling Bayesian inference always expresses uncertainty about the quantities of interest and experimental results in probabilistic terms. Bayes’ theorem combines the prior distribution and the likelihood function of the data to obtain the posterior distribution, which contains all relevant information of the problem. This distribution was not analytical in all studies of the paper except for the analysis in Subsection 3.2. In those studies the subsequent posterior distribution was approximated by Markov chain Monte Carlo (MCMC) methods (Gelman et al., 2013) using the software WinBUGS (Lunn et al., 2000). In all these inferences, the MCMC algorithm was run for three Markov chains with 100 000 iterations each after a burn-in period of 1 000. The chains were thinned by only storing every 5th iteration in order to reduce auto-correlation in the saved sample. Trace plots of the simulated values of the three chains always appeared overlapping one another indicating stabilization. Convergence of the chains to the posterior distribution was assessed trough the potential scale reduction factor, Rhat, and the effective sample size, neff (Kass et al., 1998). In all cases, the Rhat values were equal to or near 1 and neff > 100, thus indicating that the distributions of the simulated values between and within
Danilo Alvares, Carmen Armero, Anabel Forte and Luis Rubio
143
the three chains were practically identical, and also that sufficient MCMC samples had been obtained, respectively.
3.1. Weight of tubers The average unit-weight, in grams, of tubers harvested in each pot from asymptomatic and from severely affected seeds is a positive and continuous variable. It would be better for the statistical analysis to have known the individual weight of each tuber of each pot, but this information was not recorded in the experiment. That variable (Y from now on) can be approached by several simple models (Ntzoufras, 2009) which share the common structure (Y | θ ) ∼ fy (θ ), where fy can vary among different distributions – chi-squared, exponential, gamma, inverse-gamma, lognormal, and Weibull – with parametric vector θ that may depend on both covariates or factors, as for example the treatment group in our study, and random effects for assessing the specific pot individual effect. We used the deviance information criterion (DIC) for selecting the most appropriate model, the smaller the DIC the better the fit. Table 3 shows the DIC value for each model pointing out the lognormal (LN) model as slightly better than the rest. Table 3: Deviance information criterion values of various models for the mean tuber-weight. Model
Chi-squared
Exponential
Gamma
Inverse-Gamma
Lognormal
Weibull
DIC
36.49
12.22
−48.19
23.45
−50.83
−49.40
The selected mixed-effects model was (Yi j | µi j , σ 2 ) ∼ LN(µi j , σ 2 ), defined as Yi j = exp (µi j + σ Zi j ) , i = 1, . . . , 7 µi j = α + β ISD (i) + bi j Zi j ∼ N(0, 1),
(1)
where Yi j is the average unit-weight of the tubers harvested in pot i of the seed group j, where j = 1 stands for asymptomatic seeds and j = 2 for severe diseased seeds; α is the common term in µi j corresponding to asymptomatic seeds and β the additional effect for severely diseased tubers. The indicator function ISD (i) is 1 when tubers from pot i are harvested from severely diseased seeds, and 0 otherwise. Random effects bi j are conditional i.i.d. random variables normally distributed with mean zero and variance σ 2j , j = 1, 2. To complete the Bayesian model we needed to elicit a prior distribution for the parameters and hyperparameters of the model, (α, β , σ , σ1 , σ2 ). We assumed prior independence among all them as a default scenario, and considered flat prior distributions N(0.0, 10 000) for α and β , where variability in this normal distribution is expressed in terms of the variance, and a gamma distribution, Ga(0.01, 0.01), for σ , as well as the hyperprior distribution for σ j .
144
Exploring Bayesian models to evaluate control procedures for plant disease
0.30
0.60
0.90
mean unit-weight
Figure 2: Posterior distribution for the mean of the average unit-weight of tubers harvested from asymptomatic (blue) and severely diseased seeds (dark gray).
The approximated posterior mean of the regression coefficients α and β are negative, in particular −0.877 and −0.031 respectively, with P(β > 0 | D ) = 0.3701. In addition, the posterior mean for the standard deviations σ , σ1 and σ2 were E(σ | D ) = 0.144, E(σ1 | D ) = 0.194, and E(σ2 | D ) = 0.151, with 95% credible intervals (0.070, 0.238), (0.069, 0.421) and (0.072, 0.273), respectively. Figure 2 shows the posterior distribution for the mean of the average unit-weight, in grams, of tubers harvested from asymptomatic and severely diseased seeds. Notice that a great part of both posterior distributions overlap, which could indicate a non-substantial difference in the weight of the tubers harvested from asymptomatic and affected seeds.
3.2. Seed transmission of the disease We continue with the analysis of the data from Experiment 1 together with the ones from Experiment 2 corresponding to the absence of chemical and thermal treatment. We focused on the probability of obtaining tubers with severe, mild or no symptoms of the disease in each pot with regard to the type of seed, asymptomatic or severely affected, planted. For each type of seed, the response variable was the number of harvested tubers in each level of affection in the different pots harvested, which was modelled in terms of a multinomial distribution. Of course, other modelling would be acceptable, for instance the proportional odds models (Liu and Agresti, 2005) to explore the ordinality of the variable of interest. However, we opted to follow a simplified approach that also captures the experimental goals. The multinomial distribution, Multin(n, θ1 , . . . , θK ) (Agresti, 2013) is the probability distribution of the outcomes from a multinomial experiment based on n independent trials, in which each of them can result in one of K mutually exclusive and exhaustive categories. The probability θk for each category k does not vary with the data
Danilo Alvares, Carmen Armero, Anabel Forte and Luis Rubio
145
P and Kk=1 θk = 1. In the same way that the multinomial distribution is a generalization of the binomial distribution, the conjugate prior distribution for θ = (θ1 , . . . , θK )T is a multivariate generalization of the beta distribution, known as the Dirichlet distribution, Dirichlet(α1 , . . . , αK ), with joint density function f (θ | α ) =
Γ(α1 + . . . + αK ) (α1 −1) (α −1) θ · · · θK K , αk > 0, k = 1, . . . , K, Γ(α1 ) · · · Γ(αK ) 1
(2)
where α = (α1 , . . . , αK )T is the subsequent parametric vector. The combination of a multinomial model and a Dirichlet prior distribution (known as the Dirichlet-multinomial model) was proposed by Lindley (1964) and Good (1965) and results on a Dirichlet posterior distribution for θ with updated hyper-parameters αk + yk , k = 1, . . . , K, where yk is the number of trials in category k. The literature on Bayesian statistics includes various proposals for prior distributions α of with minimum information (Alvares, 2015). Our choice here is αk = 1/K because it has been shown to be an objective prior (Berger et al., 2015) with the reference distance approach (see also Perks, 1947). Figure 3 shows the 95% posterior credible intervals for the probability associated to asymptomatic, mild and severe symptoms tubers depending on the health of the seed from which have grown. Notice that for asymptomatic seeds the probability of harvesting asymptomatic tubers (posterior mean 0.698) is greater than the probabilities of collecting tubers with mild (posterior mean 0.228) or severe symptoms (posterior mean 0.074). However, in the group of diseased seeds the situation is the opposite, and the probability of harvesting tubers with severe symptoms (posterior mean 0.821) is greater than the probabilities corresponding to tubers with mild symptoms (posterior mean 0.176) and no symptoms (posterior mean 0.003). It was clear that the selection asymptomatic seeds s m a seeds with severe symptoms black spots s m a 0.0
0.2
0.4
0.6
0.8
Figure 3: 95% credible interval for the probability associated to asymptomatic (a), mild (m) and severe (s) symptoms tubers harvested from asymptomatic seeds and from seeds with severe symptoms black spots.
146
Exploring Bayesian models to evaluate control procedures for plant disease
of asymptomatic seeds seemed to be beneficial to reduce the prevalence of tubers with black spots. As an alternative modelling, we have also examined the three-stage hierarchical multinomial model proposed by (Nandram, 1998). It added as a new level in the model the assumption that the hyperparameters from the prior distribution are unknown and come from a general Dirichlet hyperdistribution, formulated in terms of a parametrization based on the marginal mean of each probability and a common weight. As results were practically equal as those obtained from the reference distance approach prior distribution (the only relevant differences occurred in the fourth decimal place), the most simple Dirichlet-multinomial model was preferable to its hierarchical modelling counterpart.
3.3. Comparison of treatments We discuss the possible benefits of applying a specific treatment to affected tubers before using them as seeds. We used data from Experiment 2 for analysing the number of marketable tubers harvested and of germinated seeds from each pot through two marginal mixed-effects logistic regression models for each combination of chemical and thermal treatment. Next, we combined both results into a single measure that quantifies the effectiveness of each treatment. 3.3.1. Germination and disease (qt)
Let Y1i the binomial variable that describes for pot i, i = 1, . . . , 8, the number of mar(qt) ketable tubers from a total of N1i collected from severely affected seeds previously (qt) treated with chemical treatment q and thermal treatment t, and represent by θ1 the subsequent binomial probability. This probability is modelled through the mixed-effects logistic regression model (qt)
(qt)
(qt)
Y1i ∼ Bin(N1i , θ1 ), (q) (t) (qt) (qt) logit(θ1i ) = α1 + β1 + λ1 + φ1 + b1i ,
(3)
where parameter α1 indicates the effect of neither chemical nor thermal treatment and (q) (t) (qt) β1 , λ1 , and φ1 include the marginal effect of each treatment, chemical or thermal, and its interaction, respectively. Random effects, b1i , associated to pot i are conditional 2 ). It is worth mentioning that the number i.i.d. random variables, (b1i | σb1 ) ∼ N(0, σ1b of tubers collected in the different pots have a great level of variability: from 8 to 466, mean 201, median 193.5, and standard deviation 77.36 tubers. The probability of germination with regard to each treatment Tqt considered is also analysed through the mixed-effects logistic regression model
Danilo Alvares, Carmen Armero, Anabel Forte and Luis Rubio
(qt)
(qt)
147
(qt)
Y2i ∼ Bin(N2i , θ2 ), (qt) (q) (t) (qt) logit(θ2i ) = α2 + β2 + λ2 + φ2 + b2i , (qt)
(4) (qt)
where now Y2i is the number of germinated seeds in the ith pot from a total N2i = (qt) (q) (t) (qt) 5 sowed, θ2 the probability of germination, parameters α2 , β2 , λ2 and φ2 , and random effects b2i with the same interpretation as in (3) and standard deviation σ2b .
0.8
0.6
0.4
0.2
0.0
T11 T12 T13
T21 T22
T23 T31
T32
T41 T42 T43 T51 T52
T53 T61 T62 T63
T11 T12 T13
T21 T22
T23 T31
T32
T41 T42 T43 T51 T52
T53 T61 T62 T63
0.8
0.6
0.4
0.2
0.0
Figure 4: Posterior mean and 95% credible interval for the probability of harvesting asymptomatic tubers from diseased seeds (on top) and for the probability of germination (below) with regard to the previous seed treatment.
148
Exploring Bayesian models to evaluate control procedures for plant disease
We assume prior independence and non-informative normal distributions for the subsequent marginal priors. In particular, we choose N(0, 10 000) prior distributions for the α’s, β ’s, λ’s, and φ’s, and Ga(0.01, 0.01) as the hyperprior for the standard deviation of the random effects. Posterior mean for the standard deviation of the random effects are 2.845 (model 3) and 0.236 (model 4). Figure 4 shows the posterior mean and a 95% credible interval for the probability of harvesting asymptomatic tubers from severely affected seeds (on top) and for the probability of germination (below). Information in both figures is with regard to the different chemical and thermal treatments considered. Treatments T23 and T43 , both based on a temperature of 60◦ C, achieve the best results with regard to the probability of harvesting asymptomatic tubers. Treatment T31 and, to a lesser extent, T11 , T21 , and T41 achieve the greatest values for the probability of seed germination. None of them included thermal treatment. It is important to note the great difference between the precision of both types of intervals, as a result of the different number of trials in the binomial variables defined in models 3 and 4. Table 4: Posterior mean of the measure of effectiveness θeqt for thermal and chemical treatments and some given values of v (values for the best and worst treatments are in blue and red, respectively). v 1−v
0.2 0.8
0.3 0.7
0.4 0.6
0.5 0.5
0.6 0.4
0.7 0.3
0.8 0.2
T11 T12 T13
0.370 0.309 0.116
0.344 0.327 0.161
0.318 0.344 0.206
0.292 0.362 0.251
0.266 0.379 0.296
0.239 0.397 0.341
0.213 0.414 0.386
T21 T22 T23
0.455 0.300 0.176
0.460 0.314 0.226
0.465 0.328 0.277
0.470 0.341 0.327
0.475 0.355 0.378
0.480 0.369 0.428
0.485 0.382 0.479
T31 T32
0.549 0.205
0.509 0.194
0.470 0.183
0.431 0.172
0.392 0.161
0.352 0.151
0.313 0.140
T41 T42 T43
0.430 0.254 0.156
0.406 0.245 0.208
0.383 0.236 0.261
0.360 0.227 0.313
0.337 0.218 0.366
0.314 0.209 0.418
0.291 0.201 0.471
T51 T52 T53
0.374 0.362 0.059
0.375 0.357 0.075
0.375 0.352 0.092
0.376 0.348 0.108
0.377 0.343 0.125
0.378 0.338 0.141
0.378 0.333 0.158
T61 T62 T63
0.317 0.188 0.087
0.312 0.206 0.105
0.308 0.225 0.123
0.304 0.243 0.142
0.299 0.262 0.160
0.295 0.280 0.178
0.291 0.299 0.196
3.3.2. Dealing with effectiveness
Chemical and thermal treatments provide antagonistic outputs. Thermal treatments produce good results regarding the incidence of the disease in exchange for a considerable reduction of the probability of germination. Chemical results are not so evident. Follow-
Danilo Alvares, Carmen Armero, Anabel Forte and Luis Rubio
149
ing the spirit of mixture models (Marin et al., 2005), we define a measure of effectiveness associated to a given combination of treatments (q,t) that weights the incidence of the (qt) (qt) disease θ1 and the probability of germination θ2 (qt)
θe
(qt)
(qt)
= v θ1 + (1 − v) θ2 ,
(5) (qt)
where v, 0 ≤ v ≤ 1, is the weighting constant. This measure of effectiveness θe is simple, sensible, easy to understand, and apply to take decisions in disease management programs. (qt) Table 4 shows the posterior mean of θe for each treatment and some elicited values of v. When priority is germination (v ≤ 0.5), the most effective treatment is T31 . If priority is achieving a great proportion of asymptomatic tubers (v ≥ 0.5), the best option will be T21 . The worst results (no matter the value of v) are for T53 . Another important information is that thermal treatments, at 55 ◦ C and 60 ◦ C, drastically reduced germination. In the case of a balanced decision (v = 0.5), the best and worst options are treatments T21 and T53 , respectively.
4. Conclusions We have used data from two experimental studies designed to analyse the transmission of black spot disease in tigernuts and the effectiveness of different chemical and thermal treatments to control its incidence. Statistical methods include linear mixed models, Dirichlet-multinomial inferential processes and logistic mixed regression models. The disease seems not to affect the size of the harvested tubers. In addition, it seems practically impossible to harvest asymptomatic tubers from severely affected seeds and highly likely to obtain severely affected tubers. In the case of asymptomatic seeds, about 70% of the tubers remained symptomless, whereas the rest were distributed between mild and severe symptoms with 23% and 7% approximately. It seems important to select asymptomatic seeds to minimize the disease incidence. Germination and transmission of the disease from seeds to tubers have been discussed for several procedures which combine chemical and thermal treatments in seeds before they are sown. We propose a measure of effectiveness for treatments which allow to balance probability of germination and disease incidence. The results indicate the bad performance of thermal treatments for germination. This is probably due to the high temperature levels considered, thus suggesting the need to perform other experiments with a larger range of temperature levels. The study also showed that the best chemical treatments when prioritizing germination is hydrochloric acid while sodium hypochlorite performs better if the priority is to have a reduced disease incidence. The low efficacy of the broad-spectrum fungicide treatment suggests that the causal agent of the black spot disease is not a fungus (al-
150
Exploring Bayesian models to evaluate control procedures for plant disease
though some fungi can be resistant to this fungicide). However, the hypothesis that the syndrome of black spots is caused by a pathogenic organism is supported by the disease incidence reduction after seed disinfection with several chemical agents. This is an interesting result that could address future experimental studies about the subject.
5. Acknowledgments Alvares’s work was supported by Coordination for the Improvement of Higher Level Personnel (BEX: 0047/13–9), Brazil. Armero and Forte’s work was supported by Grant MTM2013–42323–P from the Spanish Ministry of Economy and Competitiveness, and ACOMP/2015/202 from the Generalitat Valenciana. Experimental work was supported by grant 5425 from Valencian Institute for Agricultural Research to L. Rubio. The authors are very grateful to the editor and referees for their valuable suggestions and insights.
References Agresti, A. (2013). Categorical Data Analysis. 3rd edition. John Wiley and Sons. Alvares, D. (2015). Distribuciones previas objetivas para el modelo Dirichlet-multinomial: una aplicaci´on en la agricultura. Master’s thesis, University of Valencia, Spain. Berger, J. O., Bernardo, J. M. and Sun, D. (2015). Overall objective priors. Bayesian Analysis, 10, 189–221. Garc´ıa-Jim´enez, J., Busto, J., Vicent, A. and Armengol, J. (2004). Control of Dematophora necatrix on Cyperus esculentus tubers by hot-water treatment. Crop Protection, 23, 619–623. Gelman, A., Carlin, J., Stern, H., Dunson, D., Vehtari, A. and Rubin, D. (2013). Bayesian Data Analysis. Texts in Statistical Science, 3th edition. Chapman and Hall/CRC. Good, I. (1965). The Estimation of Probabilities: an Essay on Modern Bayesian Methods. 1st edition. MIT Press. Grondeau, C., Samson, R. and Sands, D. (1994). A review of thermotherapy to free plant materials from pathogens, especially seeds from bacteria. Critical Reviews in Plant Sciences, 13, 57–75. Kass, R.E., Carlin, B.P., Gelman, A. and Neal, R.M. (1998). Markov chain Monte Carlo in practice: a roundtable discussion. The American Statistician, 52, 93–100. Lindley, D. (1964). The Bayesian analysis of contingency tables. The Annals of Mathematical Statistics, 35, 1622–1643. Liu, I. and Agresti, A. (2005). The analysis of ordered categorical data: an overview and a survey of recent developments. Test, 14, 1–73. Lunn, D.J., Thomas, A., Best, N. and Spiegelhalter, D. (2000). Winbugs – a Bayesian modelling framework: concepts, structure, and extensibility. Statistics and Computing, 10, 325–337. Marin, J.M., Mengersen, K.L. and Robert, C. (2005). Bayesian Modelling and Inference on Mixtures of Distributions. D. Dey and C. Rao (editors), Handbook of Statistics, volume 25. Elsevier. Morell, J. and Barber, S. (1983). Chufa y horchata: caracter´ısticas f´ısicas, qu´ımicas y nutritivas. Technical report, Institute of Agrochemistry and Food Technology, Valencia, Spain.
Danilo Alvares, Carmen Armero, Anabel Forte and Luis Rubio
151
Nandram, B. (1998). A Bayesian analysis of the three-stage hierarchical multinomial model. Journal of Statistical Computation and Simulation, 61, 97–126. Ntzoufras, I. (2009). Bayesian Modeling using WinBUGS. John Wiley and Sons. Perks, W. (1947). Some observations on inverse probability including a new indifference rule. Journal of the Institute of Actuaries, 73, 285–334. Sauer, D.B. and Burroughs, R. (1986). Disinfection of seeds surfaces with sodium hypochlorite. Phytopathology, 76, 745–749. Shepard, J.F. and Claftin, L.E. (1975). Critical analyses of the principles of seed potato certification. Annual Review of Phytopathology, 13, 271–293.