removal and construction of a Spring Treatment Facility (STF) to collect and treat base spring flow. These actions have achieved significant reductions in fish ...
WEFTEC®.06
USE OF MATHEMATICAL MODELS TO EVALUATE MANAGEMENT OPTIONS FOR REDUCING PCB BIOACCUMULATION BY FISH IN TWO STREAMS AT THE NEAL’S LANDFILL SITE, BLOOMINGTON, IN Kevin T. Russell*, James R. Rhea*, Wen Ku*, David Glaser*, and Russell P. Cepko** *Quantitative Environmental Analysis, LLC 290 Elwood Davis Road Liverpool, NY 13088 **CBS, Inc., Pittsburgh, PA ABSTRACT Neal’s Landfill received PCB-containing wastes that originated from a Westinghouse Plant in Bloomington, IN. PCBs have been transported to the groundwater beneath the site and into two nearby streams: Conard’s Branch and Richland Creek, and consequently, PCBs have impacted the water, sediments, and fish of these streams. Remedial actions conducted at the site have included removal of significant threat material from the landfill, landfill capping, sediment removal and construction of a Spring Treatment Facility (STF) to collect and treat base spring flow. These actions have achieved significant reductions in fish PCB concentrations. Since these remedial actions, CBS, Inc. has been conducting an evaluation of options to achieve additional reductions of PCB levels in fish within these two streams. The evaluation of potential future remedial actions to further reduce PCB levels within the fish of Conard’s Branch and the upper portion of Richland Creek requires a quantitative means of linking fish tissue PCB concentrations with the remaining sources of PCBs to the fish. A mechanistic mathematical model was developed to assess the impact of management options for reducing fish PCB concentrations. The model framework consists of sub-models that simulate hydrodynamics, sediment transport, PCB fate and transport, and PCB bioaccumulation. The submodels were calibrated and validated independently to various data sets from multiple locations, including variations in stream stage height, water column PCB and suspended sediment concentrations during low flow and storm flows, and tissue PCB concentrations of two fish species. The calibrated model provides a quantitative tool to help understand the important PCB fate and transport mechanisms within the system and properly focus the evaluation of remedial alternatives. The model has been used to simulate the long-term response of fish tissue PCB concentrations to remedial strategies consisting of varying levels of increased STF treatment and storage capacity, as well as additional measures to address base flow sources such as bank seepage and in-stream sediments. KEYWORDS PCBs, mathematical modeling, fate and transport, bioaccumulation, Neal’s Landfill
Copyright ©2006 Water Environment Foundation. All Rights Reserved
3875
WEFTEC®.06
INTRODUCTION Background Neal’s Landfill, which is located near Bloomington, IN, received municipal and industrial solid waste that included PCB-containing capacitors and other wastes that originated from the Westinghouse Bloomington Plant (Viacom 2004). Subsequently, PCBs associated with these wastes were transported to the groundwater beneath the site, which is underlain by a limestone formation that is characterized as karst terrain, containing numerous solution cavities, sinkholes, and emerging springs. This geologic setting provides a pathway for PCB-impacted groundwater to be transported to springs that emerge near the landfill and flow into Conard’s Branch, a small stream situated in the northwest corner of the site that flows into another nearby stream, Richland Creek (Figure 1). Due to the discharge of PCBs associated with spring water flowing into Conard’s Branch, PCBs have impacted the water, sediments, and fish of Conard’s Branch and the upper portions of Richland Creek. Figure 1 – Map of Neal’s Landfill, Conard’s Branch, Richland Creek, and Primary
Sampling Locations within the Study Area
Copyright ©2006 Water Environment Foundation. All Rights Reserved
3876
WEFTEC®.06
Extensive remediation has been conducted at the landfill since the 1980s. These actions included removal of PCB contaminated materials from the landfill having PCB levels greater than 500 ppm, consolidating the remaining waste materials to higher ground and capping these materials with a RCRA subtitle C compliant cap, providing run on and run off control of surface water drainage, removing sediments from the Conard’s Branch, and construction of a spring water collection and treatment system that began operating in 1990. This system (the Spring Treatment Facility; STF) was designed to treat 450 gpm of base groundwater flow, and its effluent is discharged into Conard’s Branch. PCB levels in fish have dropped dramatically since the completion of remedial measures at the landfill and in the streams. For example, PCB levels in the Creek Chubs of Conard’s Branch have declined by more than a factor of 20. Additionally, the PCB concentrations in the spring water feeding the stream system, which is indicative of the site groundwater, appear to be steadily declining. Despite these reductions, an evaluation of methods to achieve additional reductions of PCB levels in fish is underway. Remaining sources of PCBs to the fish in these streams include the untreated groundwater/spring flows entering Conard’s Branch, the STF effluent, additional groundwater seeps identified along Conard’s Branch, and the sediments within the streams. The PCBs associated with the untreated groundwater/spring flows include a portion of the base flow that is not captured and conveyed to the STF for treatment, as well as storm water flows. During storm conditions, the flow rates exceed the STF design flow, causing relatively large volumes of untreated spring water to bypass the STF and flow into Conard’s Branch. Project Objectives The evaluation of potential future remedial actions to reduce PCB levels within the fish of Conard’s Branch and the upper portion of Richland Creek requires a quantitative means of linking fish tissue PCB concentrations with the remaining sources of PCBs to the fish. Thus, a mechanistic mathematical model was developed to provide a tool with which to assess the impact of management options for reducing fish PCB concentrations. MODEL DEVELOPMENT Framework The model framework developed for the Neal’s Landfill site consisted of three sub-models: 1. The hydrodynamic sub-model solves the vertically-averaged free-surface (continuity) equation and momentum equations, each with a barotropic term, a bottom friction term, viscous terms, and advective terms (e.g., Ziegler et al. 2000; QEA 1999; Hamrick 1992). A two-dimensional, vertically-averaged configuration was used for this site to compute temporal and spatial variations in flow rate, water depth, current velocity, horizontal dispersion (i.e., mixing), and bed shear stress.
Copyright ©2006 Water Environment Foundation. All Rights Reserved
3877
WEFTEC®.06
2. The sediment and PCB fate and transport sub-model computes advective and dispersive transport of PCBs and suspended sediments within the water column, sediment deposition and erosion at the bed/water interface, partitioning of PCBs between the dissolved and particulate phases, and volatilization of PCBs at the air-water interface (e.g., Ziegler and Lick 1986; Connolly et al. 2000; Imhoff et al. 2003). This sub-model also simulates PCB transport processes within the sediment bed, including molecular diffusion within sediment pore water and particle mixing (i.e., bioturbation). 3. The bioenergetics-based bioaccumulation sub-model computes the transfer of PCBs within the food web to fish species of interest (e.g., Thomann and Connolly 1984; Connolly 1991; Connolly et al. 1992). This sub-model simulates the uptake of PCBs by diffusion across the gill surface and from food sources and PCB loss by diffusion across the gill and the change in concentration due to growth. These sub-models are linked together within an integrated framework; information is passed between them as illustrated by the schematic in Figure 2. Figure 2 – Schematic of Model Framework and Linkages
Copyright ©2006 Water Environment Foundation. All Rights Reserved
3878
WEFTEC®.06
Grid and Calibration Period The spatial extent of the model domain consists of the stretch of Conard’s Branch from the weir located near the landfill to its confluence with Richland Creek, and Richland Creek, from the confluence to the State Route 43 Bridge, a total distance of approximately 3.0 miles (Figure 1). This three-mile stretch of the stream was simulated with a two-dimensional Cartesian grid consisting of approximately 150 longitudinal elements, which allowed for variations in system geometry and gradients in sediment PCB concentrations and bed properties to be captured by the model. The model calibration spans the five year period from January 2001 through December 2005. This period encompasses a significant portion of the more recent sampling data collected at the site, and as such, represents contemporary site conditions with respect to the operation of the spring water collection and treatment system. Parameterization The model framework required specification of several parameters, such as: • • • • • • • • •
bed friction and turbulent mixing coefficients; texture, bulk density, porosity, and initial PCB concentrations (i.e., year 2001) of the bed sediments; sediment deposition and erosion parameters; organic carbon concentrations of the sediments and water column suspended matter; PCB partitioning coefficient; mass transfer coefficients for diffusion and mixing within the sediment bed; food web structure; fish lipid contents and growth rates; and fish and invertebrate bioenergetic parameters (e.g., respiration rates, elimination rates, and assimilation efficiency).
Site-specific data, scientific literature, experience from modeling PCB dynamics in other systems, and finally, calibration formed the basis for the parameter values used to represent this system. A wide variety of site-specific sampling data were used to support the development and calibration of the models. These data included: • • •
Physical data: channel geometry measurements, flow and stage height monitoring, sediment bed thickness mapping, and sediment texture characteristics (i.e., bulk density and moisture content). Chemical data: measurement of total suspended solids (TSS) and PCBs in the water column, measurements of total organic carbon (TOC) and PCBs in the sediments, and measurement of lipid content and PCBs in biota samples. Biological characteristics: classification of fish stomach contents, and measurement of the age, length, and weight of fish samples.
Copyright ©2006 Water Environment Foundation. All Rights Reserved
3879
WEFTEC®.06
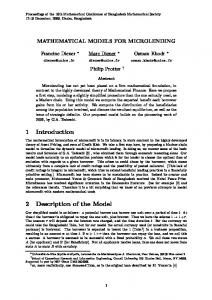
Boundary Conditions For hydrodynamics, inflow rates at the upstream boundary and the tributaries that enter the system were specified on an hourly basis using flow monitoring data collected at four locations within the system (i.e., CBW, CBVP, RCVP, and RC43 – see Figure 1). Boundary conditions during periods for which monitoring data were unavailable were estimated based on relationships between stream water elevations and groundwater elevations within a monitoring well for which a complete record was available. TSS concentrations at the upstream boundary (at CBW – see Figure 1) were specified based on an extensive set of samples collected under base flow and storm flow conditions. A relationship between TSS and flow rate was established to specify concentrations for times in which sampling did not occur. TSS in the tributary inflows (e.g., Richland Creek upstream of Conard’s Branch – see Figure 1) were estimated using the same relationship, on a flow-normalized basis. For PCBs at the upstream boundary, a flow-based statistical relationship that includes a firstorder time decay term to account for the long-term decline in observed spring PCB concentrations was developed for base flow conditions. Under storm conditions, spring flows typically increase to several thousand gallons per minute, which exceeds the 450 gpm capacity of the STF, and as a result, relatively large volumes of untreated spring water enter Conard’s Branch. A unique characteristic in this system is the high variability in PCB concentrations of the spring water entering Conard’s Branch during storm conditions, which is related to the complexities of the subsurface karst terrain. A mathematical function was developed to relate the statistical properties of spring PCB concentrations during storm conditions (i.e., event-mean concentration) to system flow rate and time (Figure 3). Figure 3 – Conard’s Branch Upstream Storm Flow PCB Boundary Condition Mean Storm PCB Conc. (ng/L)
3500 Data Estimated
3000 2500 2000 1500 1000 500 0 0
1000
2000
3000
4000
5000
6000
7000
8000
Mean Storm Flow (gpm)
This function captured the average nature of storm flow PCBs in the system: at relatively lower storm flows, event-mean PCB concentration increases with increasing flow, representing increased mobilization of the contaminated material by the increasing flows. As flow rises further, the relationship produces a decrease in event-mean PCB concentration, which reflects a Copyright ©2006 Water Environment Foundation. All Rights Reserved
3880
WEFTEC®.06
leveling off of the PCB mass that is mobilized, eventually resulting in a PCB load that is relatively independent of flow. Together the base flow statistical function and the storm flow event mean relationship provided a good representation of the variations in PCB concentration of spring water entering Conard’s Branch for the model (Figure 4). Figure 4 - Comparison of Conard’s Branch Upstream Model PCB Boundary Condition with Sampling Data
Additional PCB inputs to the system that were treated as model boundary conditions included the STF effluent and groundwater seeps entering Conard’s Branch in the vicinity of North Spring (see Figure 1), termed the North Spring Bypass (NSB). STF effluent PCB concentrations were specified based upon bi-weekly monitoring data and PCB concentrations for NSB were specified based on a relationship with spring flow rate established based on low flow monitoring data. MODEL CALIBRATION AND VALIDATION RESULTS The sub-models were calibrated and validated independently to a number of data sets spanning a range of temporal and spatial scales. Hydrodynamics The hydrodynamic sub-model was calibrated to data collected during two tracer tests (Figure 5).
Copyright ©2006 Water Environment Foundation. All Rights Reserved
3881
WEFTEC®.06
Figure 5 – Measured (Symbols) and Model Predictions (Lines) of Dye Concentrations in Conard’s Branch (CB) and Richland Creek (RC)
The results indicate that the hydrodynamic sub-model provided a good match to the travel times, the amount of dilution from Richland Creek upstream of Conard’s Branch, and longitudinal dispersion indicated by the data. The hydrodynamic sub-model was validated against a two-year record of hourly water surface elevation data from three locations (Figure 6). Figure 6 – Measured (Symbols) and Model Predictions (Lines) of Stream Stage Height in Conard’s Branch (CB) and Richland Creek (RC)
Copyright ©2006 Water Environment Foundation. All Rights Reserved
3882
WEFTEC®.06
These results indicated good agreement between the measured stage heights and those predicted by the hydrodynamic sub-model at these two locations. The ability to predict the increases in stage height during elevated flow conditions indicated that the channel slope, mean water depths, and bottom friction were properly represented in the hydrodynamic sub-model. Sediment Transport and PCB Fate The sediment and PCB fate and transport sub-model was calibrated and validated over multiple time scales and flow conditions to match TSS and PCB concentrations in both Conard’s Branch and Richland Creek. Model-predicted concentrations of TSS and PCBs compared well with high frequency data collected at multiple locations over storm events having peak flows ranging from 500 to 10,000 gpm (e.g., Figure 7), indicating the model captured the deposition/erosion patterns within the system. Figure 7 – Comparison of Model Predictions (Lines) and Measurements (Symbols) of Water Column TSS and PCB Concentrations at Three Locations on Conard’s Branch (CB) and Richland Creek (RC) during a January 2005 High Flow Event
The sediment and PCB fate and transport sub-model reproduced the spatial pattern in PCB concentrations within the streams at low flow conditions (Figure 8). This demonstrates that the model captured the increase in PCBs from the additional remaining sources along Conard’s
Copyright ©2006 Water Environment Foundation. All Rights Reserved
3883
WEFTEC®.06
Branch (i.e., sediments, STF effluent, and the North Spring Bypass), as well as the decreases in PCBs caused by settling of particulate matter, volatilization, and dilution from Richland Creek. Figure 8 – Comparison of the Average Spatial Profile of Model Predictions (Lines) and Measurements (Symbols) of Low Flow Water Column PCB Concentrations within Conard’s Branch (Miles 0 to 0.8) and Richland Creek (Miles 0.8 to 3) (Number of Observations Posted Above Error Bars)
Over the five-year calibration period, the sediment and PCB fate and transport sub-model generally provided a good match to the observed PCB concentrations throughout the system at both base flows and storm conditions (Figure 9). The model also captured the dominant feature in the water column PCB data: the substantial decrease caused by dilution.
Copyright ©2006 Water Environment Foundation. All Rights Reserved
3884
WEFTEC®.06
Figure 9 – Comparison of Model Predictions (Lines) and Measurements (Symbols) of Water column PCB Concentrations within Conard’s Branch and Richland Creek over the Five-Year Calibration Period (Non-Detects Plotted as Open Symbols at the Detection Limit) Conard’s Branch at Vernal Pike
Richland Creek at Vernal Pike
note: different scale
Bioaccumulation The bioaccumulation sub-model predicts the concentrations of PCBs in fish tissue based upon the water and sediment PCB concentrations predicted by the PCB fate and transport sub-model, and the feeding preferences (i.e., benthic vs. pelagic) of two simulated fish species: creek chub and longear sunfish. The bioaccumulation sub-model provided a good match for the temporal trend in PCB concentrations of creek chubs in Conard’s Branch (Figure 10).
Copyright ©2006 Water Environment Foundation. All Rights Reserved
3885
WEFTEC®.06
Figure 10 – Comparison of Model Predictions (Lines) and Measurements (Symbols) of PCB Concentrations of Creek Chubs within Conard’s Branch over the Five-Year Calibration Period (Mean ± 2 Standard Errors Plotted for the Data)
The bioaccumulation sub-model captured two important features of the long-term data set. First, the decrease in concentrations over time, in response to reductions in spring PCB concentrations and improvements in spring capture, was reproduced by the model. Second, the model simulated the seasonal changes in PCB concentrations, which are related to variations in fish lipid content. The bioaccumulation sub-model also matched the temporal pattern, as well as the much lower concentration range, of the PCB data from longear sunfish in Richland Creek (Figure 11). Figure 11 – Comparison of Model Predictions (Lines) and Measurements (Symbols) of PCB Concentrations of Longear Sunfish within Richland Creek over the Five-Year Calibration Period (Mean ± 2 Standard Errors Plotted for the Data)
MODEL APPLICATIONS The calibrated model provides a quantitative tool to evaluate the site, under both current and projected future conditions. Mass balances and sensitivity simulations were conducted with the Copyright ©2006 Water Environment Foundation. All Rights Reserved
3886
WEFTEC®.06
model to quantify the relative importance of the various PCB sources to fish (i.e., base and storm flows from the springs, STF discharges, in-stream sediments, and groundwater seeps along Conard’s Branch). Such model source assessments provide important insights into the PCB sources, sinks, and processes that drive site dynamics. For example, these analyses indicated that while springs from upstream account for almost 90% of the annual PCB load to Conard’s Branch (which is dominated by storm flows), they account for less than 25% of the PCBs bioaccumulated by creek chubs in that stream (Table 1). Table 1 – Results from Model Mass Balances and Sensitivity Analyses to Quantify PCB Loads to Conard’s Branch and the Relative Amount of PCB Uptake by Fish Associated with Various Sources Source
% Contribution to Average Annual PCB Load Entering Conard’s Branch
% Contribution to Average PCB Uptake by Creek Chubs in Conard’s Branch
Spring water entering Conard’s Branch from upstream
89%
24%
4%
11%
6%
37%
1%
27%
STF effluent North Spring and nearby groundwater seepage Sediments
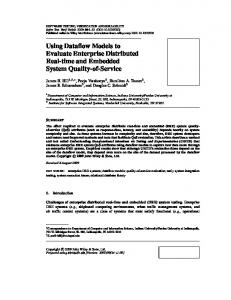
These analyses also indicate that although sediments contribute little to the annual PCB load to the Conard’s Branch water column, they are important to fish uptake, both directly through feeding in the benthic food web and indirectly through diffusive flux of PCBs to the water column. Results from such source assessments were used to properly focus remedial strategies assessed with the model. The relative effectiveness of various management alternatives for reducing PCB concentrations in fish tissue was assessed through 10-year future projections with the model. The model was configured to represent a range of potential remedial strategies, consisting of varying levels of increased STF treatment and storage capacity as well as additional source control measures. An example of the results from such model simulations is provided by Figure 12.
Copyright ©2006 Water Environment Foundation. All Rights Reserved
3887
WEFTEC®.06
% Reduction in Conard's Branch Creek Chub PCBs after 10 years
Figure 12 – Model Simulations of Potential Remedial Scenarios: Percent Reduction in Conard’s Branch Creek Chub PCB Concentrations, 10 Years into the Future 90% 80% 70% 60% 50% 40% 30% 20% 10% 0% No Further Action
Source Control Measures
Source Control / Increased STF Capacity
Source Control / Increased STF Capacity, Storage & Settling Basin Added
The future projections indicate that, at the current rate of decline in spring PCBs, fish tissue PCB concentrations in Conard’s Branch creek chubs will decrease by approximately 30% over 10 years. The model indicates that instituting additional source control measures, which include collection and treatment of the North Spring bypass groundwater seepage as well as remediation of sediment and bank soils within Conard’s Branch, will achieve an additional 30% reduction in fish PCB concentrations. Finally, the model results indicate that expanding the STF capacity from 450 gpm to 2000 gpm and installing a 5 million gallon storage/settling basin for increased treatment of PCBs during storm conditions provides less incremental benefit beyond the source control measures (10% for the STF expansion, and an additional 5% for the settling basin). Large increases in spring treatment capacity provide relatively less benefit than the source control measures because the additional capacity largely addresses storm flows, and, as shown by the model sensitivity results (Table 1), PCBs entering from Conard’s Branch during storms account for less of the PCB uptake by fish than do the base flow sources, which are addressed by the source control measures.
Copyright ©2006 Water Environment Foundation. All Rights Reserved
3888
WEFTEC®.06
REFERENCES Connolly, J.P., H.A. Zahakos, J. Benaman, C.K. Ziegler, J. Rhea, and K. Russell, 2000. A model of PCB fate in the Upper Hudson River. Environ. Sci. Technol. 34(19):4076-4087. Hamrick, J.M., 1992. A Three-Dimensional Environmental Fluid Dynamics Computer Code: Theoretical and Computational Aspects. The College of William and Mary, Virginia Institute of Marine Science. Special Report 317. Imhoff, J.C., A. Stoddard, and E.M. Buchak, 2003. Evaluation of Contaminated Sediment Fate and Transport Models. Final Report, U.S. EPA, National Exposure Research Laboratory, Athens, GA. Quantitative Environmental Analysis, LLC, 1999. PCBs in the Upper Hudson River, Volume 2, A Model of PCB Fate, Transport and Bioaccumulation. Prepared for General Electric Company, May 1999. Viacom Inc., 2004. Final Report for the Groundwater Investigation at Neal’s Landfill. QAPjP Volume XXX. July 2004. Ziegler, C., P. Israelsson, and J. Connolly, 2000. Modeling Sediment Transport Dynamics in Thompson Island Pool, Upper Hudson River. Water Quality and Ecosystem Modeling 1:193-222. Ziegler, C.K. and W. Lick, 1986. A numerical model of the resuspension, deposition, and transport of fine-grained sediments in shallow water. UCSB Report ME-86-3.
Copyright ©2006 Water Environment Foundation. All Rights Reserved
3889