Exploring Complex Networks through Random Walks Luciano da Fontoura Costa
arXiv:physics/0604193v1 [physics.soc-ph] 24 Apr 2006
Instituto de F´ısica de S˜ ao Carlos. Universidade de S˜ ao Paulo, S˜ ao Carlos, SP, PO Box 369, 13560-970, phone +55 16 3373 9858, FAX +55 16 3371 3616, Brazil,
[email protected] (Dated: 12th April 2006) Most real complex networks – such as protein interactions, social contacts, the internet – are only partially known and available to us. While the process of exploring such networks in many cases resembles a random walk, it becomes a key issue to investigate and characterize how effectively the nodes and edges of such networks can be covered by different strategies. At the same time, it is critically important to infer how well can topological measurements such as the average node degree and average clustering coefficient be estimated during such network explorations. The present article addresses these problems by considering random and Barab´ asi-Albert (BA) network models with varying connectivity explored by three types of random walks: traditional, preferential to untracked edges, and preferential to unvisited nodes. A series of relevant results are obtained, including the fact that random and BA models with the same size and average node degree allow similar node and edge coverage efficiency, the identification of linear scaling with the size of the network of the random walk step at which a given percentage of the nodes/edges is covered, and the critical result that the estimation of the averaged node degree and clustering coefficient by random walks on BA networks often leads to heavily biased results. Many are the theoretical and practical implications of such results. PACS numbers: 05.40.Fb,89.75.Hc,07.05.Mh
The crew of the caravel ‘Nina’ also saw signs of land, and a small branch covered with berries. Everyone breathed afresh and rejoiced at these signs. (Christopher Columbus)
I.
INTRODUCTION
Despite its relatively young age, the area of investigation going by the name of complex networks [1, 2, 3, 4, 5] has established itself as a worthy relative – or perhaps inheritor – of graph theory and statistical physics. Such a success has been a direct consequence of the emphasis which has been given to structured interconnectivity, statistical formulations, interest in applications and, as in more recent developments (e.g. [3, 4]), the all-important paradigm relating structure and dynamics. Yet, almost invariably, the analyzed networks are assumed to be completely known and accessible to us. Indeed, while so many important problems involving completely described networks – such as community finding (e.g. [6]) – remain as challenges in this area, why should one bother to consider incompletely specified networks? Perhaps a good way to start making sense of this question is by considering our future. To what restaurant are we going tomorrow? What article will we read next? Which mirrors will ever see our faces again? Would not each such situation be describable as a node, while the flow of decisions among the possibilities would define a most extraordinary personal random walking a most complex network? Although such a dynamic network is undoubtedly out there (or in here), we are allowed to explore just a small portion of it at a time. And, with
basis on whatever knowledge we can draw from such a small sample, we have to decide about critical next steps. However, the situations involving incomplete or sampled networks extend much further than this extreme example. For instance, the steps along any game or maze is but a sample of a much larger network of possibilies. Explorations of land, sea and space also correspond to small samplings of a universe of possibilities, not to mention more ‘classical’ large networks such as those obtained for protein interaction, social contacts and the Internet. Last but not least, the own exploratory activities of science are but a most complex random walk on the intricate and infinite web of knowledge [7]. In all such cases, the success of the whole enterprise is critically connected to the quality and accuracy of the information we can infer about the properties of the whole network while judging from just a small sample of it. Little doubt can be raised about the importance of such a problem, which has received little attention, except for the investigations by Serrano et al. on the effects of sampling the WWW through crawlers [8]. The literature about random walks in complex networks include [9, 10, 11, 12].
The current article is about incomplete and sampled networks and some related fundamental questions. We start with the basic mathematical concepts, identifying some of the most interesting related questions and perspectives, and proceed by illustrating what can be learnt about random and Barab´ asi-Albert networks while sampling them locally in random fashion or through three types of random walks — traditional (uniform decision probability) and preferential to untracked edges and preferential to untracked nodes).
2 II.
BASIC CONCEPTS AND SOME FUNDAMENTAL ISSUES
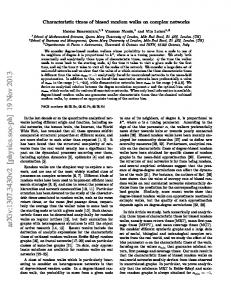
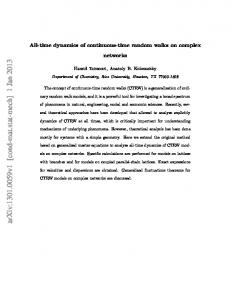
An undirected [13] complex network Γ = (Ω, E), involving a set of N nodes Ω and a set V of E connections between such nodes, can be completely specified in terms of its N × N adjacency matrix K, such that the existence of a connection between nodes i and j implies K(i, j) = K(j, i) = 1 (zero is assigned otherwise). The degree ki of node i is defined as corresponding to the number of edges connected to that node, and the clustering coefficient cci of that node is calculated as the number of edges between the neighbors of i and the maximum possible number of interconnections between these neighbors(e.g. [3]). An incompletely specified complex network is henceforth understood as any subnetwork G of Γ such that G 6= Γ. In this work we will restrict our attention to incomplete complex networks defined by sets of nodes and adjacent edges identified during random walks. Such networks can be represented as G = ((i1 , V1 ); (i2 , V2 ), . . . , (iM , VM )), where ip are nodes sampled during the random walk through the respective list of adjacent nodes. Note that necessarily ip+1 ∈ Vp and that (i1 , i2 , . . . , iM ) corresponds to a path along Γ. It is also interesting to consider more substantial samples of Γ, for instance by considering not only the adjacent edges, but also the interconnections between the neighboring nodes of each node. Therefore, the case above becomes G = ((i1 , V1 , E1 ); (i2 , V2 , E2 ), . . . , (iM , VM , EM )), where Ep is the set containing the edges between the nodes in Vp . Figure 1 illustrates a complex network (a) and respective examples of incompletely specified networks obtained by random walks considering neighboring nodes (b) and the latter plus the edges between neighboring nodes (c). Given an incomplete specified complex network G, a natural question which arises is: to what accuracy the properties of the whole network Γ can be inferred from the available sampled information? Because the estimation of global properties of Γ such as shortest paths and diameter constitutes a bigger challenge to the moving agent, we concentrate our attention on local topological properties, more specifically the node degree and clustering coefficient averaged over the network. Three types of random walks are considered in the present work: (i) ‘traditional’: the next edge is chosen with uniform probability among the adjacent edges; (ii) preferential to untracked edges: the next edge is chosen among the untracked adjacent edges and, in case no such edges exist, uniformly among all the adjacent edges; and (iii) preferential to unvisited nodes: the next edge is chosen among those adjacent edges leading to unvisited nodes and, in case no such edges exist, uniformly among all the adjacent edges. Note that the plausibility of the preferential schemes depends on each modeled system. For instance, the preference to untracked nodes implies that the moving agent knows whether each edge leads to
(a)
(b)
(c)
FIG. 1: A simple network (a) and two incompletely specified networks obtained by a random walk considering neighboring nodes and (b) and the latter plus the edges between adjacent nodes (c). The gray nodes correspond to those sampled during the random walk
a still unvisited node, though it may not know exactly which one. It is interesting to note that the process of sampling an existing network through a random walk can be interpreted as a mechanism for ‘growing’ a network.
III.
NODE AND EDGE COVERAGE
First we consider networks growth according to one of the following two complex network models: (a) random networks, where each pair of nodes has a probability λ of being connected; and (b) Barab´ asi-Albert networks (BA), built by using the preferential attachment scheme described in [1]. More specifically, new nodes with m edges each are progressively incorporated into the growing network, with each of the m edges being attached to previous nodes with probability proportional to their respective node degrees. The network starts with m0 = m nodes. Complex networks with number of nodes N equal to 100, 200, . . . , 900 and m = 3, 4, . . . , 8 have been considered. An equivalent average degree and number of edges was imposed onto the random networks as in [7]. A total of 200 realizations of each configuration, for the three types of random walks, were performed experimentally. Figure 2 illustrates the ratio of tracked edges in terms
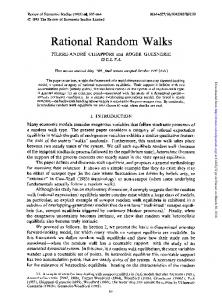
3 of the steps t for N = 100 and N = 300 considering m = 3, 4, . . . , 8 and the BA network model. It is clear from the obtained results that, as expected, the higher the value of m, the smaller the ratio of visited edges. Note that the increase of N also contributes to less efficient coverage of the edges, as expressed by the respective smaller ratios of visited edges obtained for N = 300. For large enough total number of steps, all curves exhibited an almost linear initial region followed by saturation near the full ratio of visited edges (i.e. 1).
work. Note that the three types of random walks resulted slightly more effective for node coverage in the case of the random model than in the BA counterparts. Further characterization of the dynamics of node coverage can be obtained by considering the scaling of the slopes of the curves of ratios of visited nodes in terms of several values of m. Remarkably, the slopes obtained by least mean square fitting for the two types of preferential random walks were verified not to vary with m, being fixed at 0.31 and 0.25, respectively, for the BA model and 0.285 and 0.25 for the random networks. Figure 4 shows the log-log representation of the slopes in terms of m obtained for the traditional random walk on BA and random networks for m = 3, 4, . . . , 8. It is clear from this figure that, though the slopes tend to scale in similar (almost linear) fashion for the two types of considered networks, the ratios of node coverage increase substantially faster for the random networks.
IV. ESTIMATION OF AVERAGE NODE DEGREE AND CLUSTERING COEFFICIENT
FIG. 2: The ratio of tracked edges in terms of the steps t for N = 100 and N = 300 considering the values of m as presented in the legend.
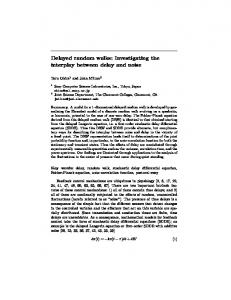
Figure 3(a) shows the ‘quarter-lives’ h of the percentage of visited nodes in terms of the network size N with respect to the BA network model with m = 5. This measurement corresponds to the average number of steps at which the random walk has covered a quarter of the total number of network nodes. Similar results have been obtained for other critical fractions (e.g. half-life). Note that, as m is fixed at 5, the average degree hki of all networks in this figure remains equal to 10 [14], being therefore constant with N , while the average number of edges grows as hEi = N hki /2 = 5N . Interestingly, linear dependence between the quarter-lives and N are obtained in all cases. It is also clear from these results that the most effective coverage of the nodes is obtained by the random walk preferential to unvisited nodes, with the random walk preferential to untracked edges presenting the next best performance. Figure 3(b) shows the quarter-lives of the percentage of visited nodes for random networks. The random walks with preference to unvisited nodes again resulted in the most effective covering strategy. The quarter-lives for the percentage of tracked edges are shown in Figures 3(c,d) respectively to BA (c) and random (d) network models. The best ratios of covered edges were obtained for the random walk preferential to untracked edges, with the random walk preferential to unvisited edges presented the next best performance. The traditional random walk resulted the least efficient strategy in all situations considered in this
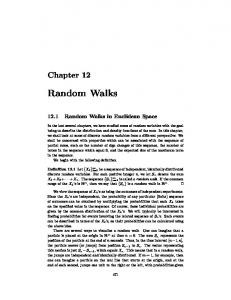
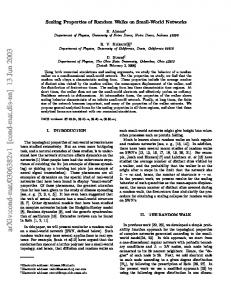
So far we have investigated the dynamics of node and edge coverage in random and BA models while considering the three types of random walks. In practice, as the size of the network being explored through the random walks is typically unknown, the number of visited nodes or tracked edges by themselves provide little information about the topological properties or nature of the networks. The remainder of the present work addresses the estimation of measurements of the local connectivity of networks, namely the average node degree and average clustering coefficient, obtalined along the random walks. For generality’s sake, the estimations are henceforth presented in relative terms, i.e. as the ratio between the current estimation (e.g. (k(t)) and the real value (e.g. hki). Figure 5 illustrates the curve defined by the estimations (k(t), cc(t)) obtained by traditional random walks along a BA network with N = 800 and m = 5. Interestingly, this curve is indeed a kind of random walk with convergent limit. Such curves have been found to converge to limiting ratios (kL , ccL ) which can or not correspond to the ideal ratios (1, 1). In the case of the curve in Figure 5, we have (kL = 1.62, ccL = 0.88), i.e. the average node degree has been over-estimated while the average clustering coefficient has been under-estimated. Through extensive simulations, we have observed that the estimations of average node degree tended to be about twice as much as the real value while the average clustering coefficient resulted about 0.9 of the real value, irrespectively of N , m or random walk type. Contrariwise, the estimation of these two topological features for random networks tended to produce stable and accurate estimation of the average clustering coefficient, while the obtained average node degree presented very small variation around the optimal value. The substantial biases implied by the random walk over BA networks is a direct consequence
4
(a)
FIG. 4: Loglog (Neper) representation of the slopes of the ratios of visited nodes obtained for traditional random walks for m = 3, 4, . . . , 8 considering BA (‘×’) and random (‘⊕’) network models.
(b)
(c)
of the larger variability of node degree exhibited by this model. Therefore, nodes with higher degree will tend to be visited more frequently [15], implying over-estimation of the average node degree and a slighted bias on the clustering coefficient. Provided the moving agent can store all the information obtained from the network as it is being explored, yielding a partial map of the so far sampled structure, it is possible to obtain more accurate (i.e. unbiased) estimates of the average node degree and clustering coefficient during any of the considered random walks in any type of networks by performing the measurements without node repetition. However, an agent moving along a BA network without resource to such an up to dated partial map will have to rely on averages of the measurements calculated at each step. This will cause the impression of inhabiting a network much more complex (in the sense of having higher average node degree) than it is indeed the case. Going back to the motivation at the beginning of this article, it is difficult to avoid speculating whether our impression of living in a world with so many possibilities and complexities could not be in some way related to the above characterized effects.
V.
(d)
FIG. 3: The quarter-life of the percentage of visited nodes for BA (a) and random (b), and the quarter-life of the percentage of visited edges for BA (c) and random (d) models, for traditional (‘+’), preferential to untracked edges (‘×’) and preferential to unvisited nodes (‘⊕’) random walk strategies.
CONCLUDING REMARKS
The fact that most real complex networks are only partially available to us as a consequence of their sheer size and complexity, it becomes of critical importance to understand how well these structures can be investigated by using sampling strategies such as different types of random walks. The present work has addressed this issue considering random and BA network models with varying connectivity and sizes being sampled by three types of random walks. A series of important results have been obtained which bear several theoretical and practical im-
5
FIG. 5: Curve (actually a kind of random walk) defined by the estimations (k(t), cc(t)), through traditional random walk, of the average node degree k(t) and average clustering coefficient cc(t) in a BA network with N = 800 and m = 5. The curve converges to the incorrect estimations ratios (1.62, 0.88) instead of (1, 1).
plications. Particularly surprising is the fact that random and BA networks are similarly accessible as far as node and edge exploration is concerned. Actually, random networks tend to have their nodes and edges explored in a slightly more effective way. Also important is the characterization of linear scaling with the network size of the quarter-life of the ratio of covered nodes and edges, and the identification substantial biases in estimations of the average node degree and clustering coefficient in several situations. In particular, the average node degree tend to be estimated as being approximately twice as large as the real value. Additional insights about the non-trivial dynamics of complex network exploration through random walks can be achieved by considering other network models as well as more global topological measurements such as shortest paths, diameters, hierarchical measurements and betweeness centrality.
Luciano da F. Costa is grateful to CNPq (308231/03-1) for financial support.
[1] R. Albert and A. L. Barab´ asi, Rev. Mod. Phys. 74, 47 (2002). [2] S. N. Dorogovtsev and J. F. F. Mendes, Advances in Physics 51, 1079 (2002), cond-mat/0106144. [3] M. E. J. Newman, SIAM Review 45, 167 (2003), condmat/0303516. [4] S. Boccaletti, V. Latora, Y. Moreno, M. Chaves, and D. U. Hwang, Physics Reports (2005), in press. [5] L. da F. Costa, F. A. Rodrigues, G. Travieso, and P. V. Boas (2005), cond-mat/0505185. [6] M. E. J. Newman, Eur. Phys. J. B 38 (2004). [7] L. da F. Costa, physics/0601118 (2006). [8] M. A. Serrano, A. Maguitman, M. Boguna, S. Fortunato, and A. Vespignani, cs.NI/0511035 (2005).
[9] B. Tadic, Eur. Phys. J. B 23, 221 (2001). [10] B. Tadic, cond-mat/0310014 (2003). [11] E. M. Bollt and D. ben Avraham, cond-mat/0409465 (2004). [12] J. D. Noh and H. Rieger, cond-mat/0310344 (2004). [13] The results in this article are immediately extended to more general networks, including directed and weighted models. [14] In the BA model, the average degree is equal to 2m. [15] Actually the rate of visits to the nodes of an undirected complex network, at thermodynamical equilibrium, can be verified to be proportional to the node degree.