Proceedings of the 15th International Conference on Auditory Display, Copenhagen, Denmark May 18 - 22, 2009
EXPLORING CONCURRENT AUDITORY ICON RECOGNITION Eoin Brazil, Mikael Fernstr¨om
John Bowers
Interaction Design Centre University of Limerick Limerick, Ireland
[email protected],
[email protected]
Department of Design Goldsmiths, University of London London SE14 6NW, England
[email protected]
ABSTRACT This poster explores and deepens existing studies into the identification of concurrently presented auditory icons. The motivation for this work was to gain a better understanding of auditory icons where several are played together simultaneously. A set of descriptors for everyday sounds were collected from participants and classified into action and object categories. The exploration considered the hypothesis that when auditory icons did not have the same object or action descriptors that the identifications of the auditory icons would improve. This was studied in conditions where three, six, and nine sounds were simultaneously presented. These conditions had two distinct sub-categories, the first category used a prior classification of sounds to ensure no sound pair in the condition had the same action or object properties. The second subcategory used random selection of the sounds meaning that similar sound could exist within the particular condition. A onset-to-onset gap of 300 ms between sounds being presented was used. The results supports earlier findings and showed that distinguishing between object and action properties of auditory icons did improve their identification accuracy. It was found that prior classification allows listeners to achieve close to a 10% identification improvement in accuracy. 1. INTRODUCTION Auditory icons were defined by [1] as ”everyday sounds mapped to computer events by analogy with everyday sound producing events”. The sounds used in this exploration are auditory icons based on everyday sound, and do not typically fit into the categories of music or speech. The definition of an everyday sound is taken from Vanderveer [2] who defined it as: “Any possible audible acoustic event which is caused by motions in the ordinary human environment. ... Besides having real events as their sources ... [everyday sounds] are usually more complex than laboratory sinusoids, ... [everyday sounds] are meaningful, in the sense that they specify events in the environment. ... The sounds to be considered are not part of a communication system, or communication sounds, they are taken in their literal rather than signal or symbolic interpretation.” [2, p. 16-17] Prior work in auditory display has often concentrated on situations where a single event or message, sometimes complex, is being conveyed but with increasingly more complex interoperating systems there is a growing need for the ability to convey multiple events or messages simultaneously. The lack of guidelines and research in the area of conveying multiple events or messages using auditory icons led us to our investigation of concurrently presented auditory icons. This work uses the definition of concurrent auditory icons as the playing of several auditory icons together and
simultaneously, to build more complex and compound auditory icons. This is inspired by how real sounds work in the world and by previous research on concurrent audio presentation [3, 4, 5, 6]. Concurrent audio presentation offers advantages such as increased bandwidth and faster presentation but can suffer from disadvantages such as the sounds can interfere with each other, confused interpretations, or perceptual masking. This can occur even where sounds are played in a sequence as Moore et al. [7, p. 331] points out that the segregation of the sounds is based on the “degree of perceptual difference” between them. He remarks that even a small perceptual difference “may be sufficient to improve performance” for tasks requiring some degree of sound segregation.They [7, p. 331] further suggests a larger perceptual differences could produce “obligatory stream segregation”. If auditory icons are to be used in auditory displays as the communication mechanism it needs to be able to keep pace with the interactions occuring. This can be problematic if only sequential sounds are used as the interface may have to wait for a sound to finish before playing the next sound or may end up playing the sound for a just completed interaction, either of the situations will not provide any advantages to a user. This work investigates if object and action properties can be used to classify sounds prior to their use and if this is effective in clearly communicating auditory icons in the numbers necessary for auditory displays. The previous work in earcons [3, 4, 5] found the limit of identification for earcons was most positively influenced by using staggered onsets between the earcons and designing multi-timbre earcons to enhance their identification or ability to ‘stand out’. McGookin et al. [5] explored up to four concurrent earcons and found in many conditions only two of the four could be easily identified, however for certain mappings, three of the four earcons were identifiable. These results suggest at most three concurrent earcons can be used and opens the question about how many can be used for concurrent presentation if instead of earcons, auditory icons are used. The relative low number of concurrent earcons that can be uniquely identified is somewhat in contrast to the numbers of everyday sounds that we as listeners can identify throughout our daily activities. This was a motivating factor for conducting this exploration. The second motivation for this research was for designers of auditory displays, especially novice designers, who may make na¨ıve psychological assumptions about what sounds were being listened to in their auditory display. Experienced designers often make educated guesses based upon their skill but even they may be wrong. These wrong choices can result in an auditory display communicating information in a manner that is demanding or confusing for listeners. The aim of this exploration was to present a method to select and validated auditory icons when used for concurrent presentation. The sounds used in this exploration had been classified with particular focus on two categories, the object category of the sound and the action category of the sound. Fernstr¨om et al [8] have
ICAD09-1
Proceedings of the 15th International Conference on Auditory Display, Copenhagen, Denmark May 18 - 22, 2009
previously described this classification. Previous research [8, 6] found that actions of sounds are better identified than the objects involved in a sound. The choice of these categories was also informed by soundscape classification studies [9], which found participants included both source (object) and actions in 100% of their descriptions of a soundscape and were the most salient items used by listeners to describe a soundscape. Research from Ballas and Howard [10] found the semantic context in sound interpretation is an important factor and listener’s auditory perception is directed towards awareness of the sources of sounds i.e. the events producing sounds. They also stated the function of auditory perception is to recognise events rather than processing acoustic patterns. Events are defined for this study to consist of actions, objects and context. Our study explored action and object properties in the context of the identification accuracy of concurrently presented auditory icons. 2. EXPLORING THREE, SIX, AND NINE CONCURRENT AUDITORY ICONS In a similar fashion to previous studies [2, 6], a listening test approach was used to study the recorded sounds used in the exploration. The sound were presented to participants using headphones, who responded in free-text format to what they thought each sound was. These text descriptions were often highly descriptive and accurate. In this particular study, the number of concurrent auditory icons being presented varied from three to six to nine in two conditions, one where the stimuli was limited to no overlapping action or object descriptors (constrained) and the second condition allowed random selection of stimuli from a pool with no conditions. This study used three stimuli pools where each pool consisting of 63 stimuli.
2.3. Training The focus of this training phase was to familiarise the participants with the concurrent presentation of auditory icons. A number of sets of concurrent auditory icons were presented to the listener using a standard media player. The stimuli used in the training phase were not used in the later tests. The participants spent five minutes listening to the stimuli and were then introduced to the platform used for the study. Users had headphones to listen to the sounds (in mono) while interacting with the system 2.4. Design of Study Using a within-subjects design, the stimuli were presented in random order within each condition and the task order was counterbalanced for the conditions (three, six, and nine concurrent auditory icons). Each set of stimuli whilst presented randomly were presented as a single block for the particular condition. Stimuli were selected from two of the three pools randomly selected for each participant. One of the pools was used for the constrained sounds (non-overlapping action or object descriptors) and the second pool was used for the randomly selected sounds. 2.4.1. Procedure The participants listened to the recorded sounds (mono) in random order using headphones, responding in free-text format to what each sound was. The conditions varied from three to six to nine sounds being concurrently presented. Non-directive instructional guidelines [2] were used and participants were asked to describe the sounds in their own words. A 300 ms onset-to-onset gap [5] was used to improve identifiability. This start-to-start gap between two concurrent or almost concurrent sounds can prevent merging of the two sounds into a single stream.
2.1. Participants
2.4.2. Results
26 participants were recruited from the wider community of postgraduates and staff at the University of Limerick. All participants reported normal hearing and had normal or corrected to normal vision. Written consent was obtained prior to the study from all participants.
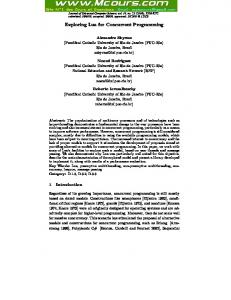
The set of participant responses to the presented sounds were sorted and categorized, as well as evaluated for correctness. The sorting and categorisation was similar to Marcell’s [17] equivalence judgement method and to Vanderveer’s [2] heuristic for correct response method, both of which were used in classification of free text descriptors from listeners in a similar type of a task. The num2.2. Stimuli ber of auditory icons correctly identified by participants was determined by analysis the participant’s responses. This used a two Three different sets (pools A,B, and C) of 63 high-quality monostage classification process [8], in the first stage the criteria did phonic sounds (44.1 Kilohertz 16-bit) everyday sounds (durations not have to be kept consistent. In the second stage, the criteria between 1.0 and 5.0 seconds) were used. These sounds were sewere generalised and then grouped to reduce the number of crilected from the BBC sound effects CD collection [11], the online teria while maintaining consistency to the internal measures used. 1 creative-commons Freesound [12], a local sound collection , and Examples of the second stage categories for objects include vea commercial sound effects CD collection [13]. The sound were hicle, metal, fabric/cloth and for actions include hitting, rubbing, chosen to represent complex, dynamic and informational events opening/closing. Synonyms were related to the most relevant catwith different temporal patterns [14] and edited to a duration alegory or used to create a new category. This was done in a similar lowing for the “sound event” or “sound object” [15] to appear to manner to previous researchers [?]. For each set of (three, six, occur naturally [16]. or nine) concurrently presented auditory icons, the set of auditory icons presented and the set of participant responses to those auditory icons were compared. If the description of an auditory icon 2.2.0.1. Stimuli Classification from a participant’s response matched an auditory icon in the set The sounds selected were classified with particular focus on two presented, and if the auditory icon has not already been identified categories, the object category of the sound and the action category and matched with a previous description, the number of correctly of the sound. The analysis concentrated on the properties of the identified auditory icon was increased by one, and the auditory events, the actions, the objects, and the context of the events. The icon description was marked as allocated. set of descriptions for the sounds provided by the participants usThe overall identification results are shown in Figure 1 and ing their free text responses were also collected. Full descriptions showed the sounds in conditions with prior classification had on of the sound are available online as described in Section 4. average, a 9 – 10% identification accuracy performance improve1 Everday sound Collection - http://www.idc.ul.ie/mikael/sounds/ecosound.zip ment when compared to those with no prior classification. These
ICAD09-2
Proceedings of the 15th International Conference on Auditory Display, Copenhagen, Denmark May 18 - 22, 2009
Figure 1: Graph showing the average proportion of auditory icons identified for the three, six, and nine auditory icon conditions.
results have shown in situations of nine concurrent auditory icons without classification the soundscape is becoming a cacophony as listeners can only identify 39% for the sounds. The prior classification condition with nine concurrent auditory icons showed a slightly better identification accuracy performance from listeners with an average identification rate of approximately 47%. The results for the identification accuracy with 9 (48%), 6 (60%), and 3 (83%) prior classified concurrent auditory icons indicates that this type of classification is effective technique for sound selection. These results indicate that designers should limit the number of concurrent auditory icons to range of between three and six concurrent auditory icons with prior classification. A possible explanation for the difference between the results and earlier studies may be due to the lower numbers of stimuli overlapping in the conditions as shown in Table 1. The random selection of stimuli from the three larger pools did not seek to increase the degree of overlap in either the action or object categories. Further large scale studies with highly overlapping action and object categories is necessary to clarify this confusion. 2.4.2.1. Average proportion of correctly identified auditory icons Examining the results for correct identification with prior and with no prior classification shows auditory icons identification growing more difficult as the number presented is increased when using prior classification however this was not as severe as the difficulties encountered in the conditions where no classification of auditory icons was used. The distribution was not normally distributed and required the use of Kruskal Wallis and Dunn multiple comparison tests [18] to determine if any of the differences were statistically significant. The results matched with common sense finding with more sounds presented, each individual sound is more difficult to identify. The findings did not support the hypothesis that prior classification would improve identification. 2.4.2.2. Post study participant debriefing As part of this study, a post study debriefing was used to collect data from the participants. Participants highlighted the particular difficulties they found in the more dense 6 and 9 auditory icon conditions. One participant stated that they were “starting to question their sanity” due to the odd combinations of sounds. This highlights the need to further consider the ecological combinations of auditory icons, in the case of the particular participant a number
Participant Random Random Random Random Random Random Average Act 3 Obj 3 Act 6 Obj 6 Act 9 Obj 9 overlap 1 0% 0% 33% 33% 22% 44% 22% 2 0% 0% 33% 33% 89% 67% 37% 3 0% 67% 50% 67% 0% 67% 42% 4 0% 0% 50% 50% 44% 44% 31% 5 0% 67% 50% 67% 0% 67% 42% 6 0% 0% 67% 67% 22% 44% 33% 7 67% 0% 0% 33% 44% 56% 33% 8 67% 0% 0% 33% 22% 44% 28% 9 67% 0% 33% 0% 33% 67% 33% 10 67% 0% 83% 33% 44% 56% 47% 11 100% 0% 67% 33% 22% 67% 48% 12 67% 67% 67% 83% 89% 67% 73% 13 0% 67% 67% 50% 78% 44% 51% 14 0% 0% 0% 33% 44% 56% 22% 15 0% 0% 67% 67% 56% 78% 44% 16 0% 0% 67% 67% 22% 44% 33% 17 67% 0% 33% 33% 22% 44% 33% 18 67% 67% 67% 83% 44% 78% 68% 19 0% 67% 67% 33% 67% 44% 46% 20 67% 0% 0% 0% 22% 22% 19% 21 0% 67% 83% 67% 22% 44% 47% 22 67% 0% 0% 33% 33% 56% 31% 23 100% 0% 83% 67% 56% 78% 64% 24 0% 0% 83% 33% 44% 22% 31% 25 0% 0% 50% 33% 67% 78% 38% 26 100% 0% 83% 67% 56% 78% 64% Average overlap 35% 18% 49% 46% 41% 56% 41%
Table 1: Percent of overlapping sound categories within the 3, 6, and 9 concurrent auditory presentation conditions in the third study. Conditions NonOverlap3 vs. NonOverlap6 NonOverlap3 vs. NonOverlap9 Over3 vs. Over6 Over3 vs. Over9
Mean Rank Difference −50.58 −73.46 −39.69 −55.15
P-value p