In Visualization '91, pages 17â24, 1991. [3] Hayward C. Listening to the earth sing. In Greg Kramer, editor, Auditory Display: Sonification, Audification, and Au-.
Exploring Geo-Scientific Data in Virtual Environments Bernd Fr¨ohlich
Stephen Barrass
Bj¨orn Zehner
John Plate
Martin G¨obel
GMD German National Research Center for Information Technology
Abstract This paper describes tools and techniques for the exploration of geo-scientific data from the oil and gas domain in stereoscopic virtual environments. The two main sources of data in the exploration task are seismic volumes and multivariate well logs of physical properties down a bore hole. We have developed a props-based interaction device called the cubic mouse to allow more direct and intuitive interaction with a cubic seismic volume. This device effectively places the seismic cube in the user’s hand. Geologists who have tried this device have been enthusiastic about the ease of use, and were adept only a few moments after picking it up. We have also developed a multi-modal visualisation and sonification technique for the dense, multivariate well log data. The visualisation can show two well log variables mapped along the well geometry in a bivariate colour scheme, and another variable on a sliding lens. A sonification probe is attached to the lens so that other variables can be heard. The sonification is based on a Geigercounter metaphor that is widely understood and which makes it easy to explain. The data is sonified at higher or lower resolutions depending on the speed of the lens. Sweeps can be made at slower rates and over smaller intervals to home in on peaks, boundaries or other features in the full resolution data set.
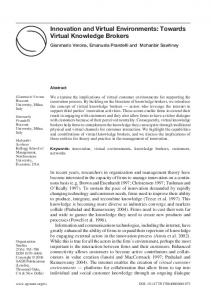
Figure 1: Controlling a geo-scientific scenario with the cubic mouse.
1 Introduction
tion, and sonification techniques developed for these highly interactive virtual environments.
The oil and gas industry acquires enormous amounts of data for the exploration of potential new reservoirs. The two main sources of data are seismic surveys and multivariate measurements of physical properties down a bore hole. Experts sight and interpret the data to discover subsurface structures where the precious oil and gas is likely to be found. The exploration and interpretation process is mostly performed with sophisticated software systems on desktop computer workstations. However the small display size and the conventional desktop interface is in stark contrast to the complicated three-dimensional subsurface structures and well topologies that need to be understood and discussed in interdisciplinary teams. We developed a system that allows experts from the oil and gas industry to explore their data in stereoscopic virtual environments like Caves [5] and Responsive Workbenches [11]. The large display size of these systems supports collaborative work and the stereoscopic projection facilitates the understanding of data in three dimensions. In this paper we focus on novel interaction, visualiza-
In oil and gas exploration the central data structure for most tasks is the seismic cube, a scalar volumetric grid produced by processing the raw data from seismic surveys. The cubic mouse, shown in Figure 1, is a cube-shaped, tracked input device, which literally puts the seismic cube into the user’s hand and allows very intuitive control of viewing parameters. The cubic mouse has also three sliding rods which pass through its center and are used to position three orthogonal seismic sections. The other important source of information for interpreters is well log data which they use to determine the stratigraphy and characterise the petrophysics down a drill-hole. We have developed a multi-sensory sonification and visualisation tool for exploring well log data. Two attributes can be mapped to the colours in the visualization, and additional attributes can be mapped to the sounds of a Geiger-counter. The system has been well received by the geologists and geophysicists we have been working with in our development process. This is despite the fact that it contains only a fraction of the functionality of commercial geo-scientific systems. During evaluation sessions, the experts from the oil and gas industry indicated that the cubic mouse is a major step towards more intuitive interaction with their data. Even from their first experience, some geologists predicted that the cubic mouse will become a standard for their application domain within the next years. The combined visualization and sonification seems to help the perception of information for dense, multivariate well logs. This is a first step in the direction of multi-sensory data exploration and we are encouraged to continue investigations in this direction.
0-7803-5897-X/99/$10.00 Copyright 1999 IEEE
169
2 Related Work There are a variety of interactive VR visualisations systems e.g. [2], [1], [7]. These systems focus on different domains like engineering, biology, medicine and so on. For the oil and gas domain there are only a few systems, which are developed for interactive virtual environments. Loftin et al. at the VETL in Houston [6] are among the pioneers for virtual environments visualisation in the oil and gas domain and have developed a variety of tools to support the exploration and interpretation process. One of the most interesting approaches to interaction with geo-scientific data was done by Stevenson et al. [10] at the CSIRO in Canberra where they integrated the Phantom haptic force-feedback device with a virtual workbench system. Their geo-seismic demonstrator allows you to feel for three dimensional structure in a hand-sized stereoscopic view of a seismic cube. Hinckley et al. [8] describe the use of interface props in a neurosurgical visualisation task. In their system, users hold a small rubber sphere with an embedded tracker. The rubber sphere is held in one hand and used to control the orientation of a head model on the screen. The other hand holds a second prop which is used to position a cutting plane relative to the head prop. Sounds have proven effective as a way to represent multi-variate data in studies with botanical classification [15], monitoring a patient during surgery [16], the analysis of sociological data [13], atmospheric chemistry [4], and debugging parallel computer programs [12]. The potential for real-time interactive sonification in virtual environments was demonstrated with chaotic data at the NCSA [9]. A systematic approach to the sonification of seismic tasks and data proposed by Hayward [3] is doubly interesting because of both the seismic domain and the step beyond ad-hoc approaches it presents. The interactive sonification in our system is based on a design method that draws on that systematic approach together with principles of perceptual mapping drawn from scientific visualisation [14].
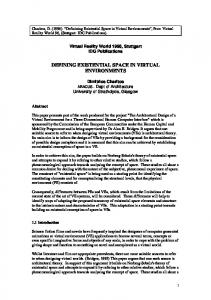
Figure 2: A typical oil exploration data set containing subsurface structures, wells, and seismic slices. The subsurface model consists of two main structures: horizons and faults. Horizons separate two earth layers, and faults are breaks in the rocks, where one side is moved relative to the other. Horizons are typically horizontal while faults are inclined. Three orthogonal slicing planes are used to visualise the seismic volume. The inline-slice is typically perpendicular to the main fault direction. The time-slice is horizontal and the crossline-slice is perpendicular to both.
3 Geo Science Data for Oil and Gas Oil and gas exploration relies on geo-science data from two main sources - seismic surveys and well logs. While seismic provides a broad view of large structures in a subsurface volume, well logs provide details at sample sites down a drill hole. Seismic surveys are carried out by sending acoustic shock waves into the ground where they are reflected and refracted, following the physical principles of wave-motion in layered media. The amplitude and travel time of acoustic waves returning to the surface are measured and processed into regular three-dimensional scalar grids. Strong coherent reflectors and other structures can be analysed from these data volumes, which represent a block of the earth subsurface that may be kilometres on a side. Well log data is gathered by lowering instruments down an existing drill-hole to measure physical properties such as gamma radiation, neutron density, bulk density, electrical conductivity and many others. Measurements can be made at centimetre intervals over hundreds of metres, so well log data is high resolution, dense and multi-variate. Subsequent processing can be done to produce vector data (e.g. stress field and dip-direction) and data representing surfaces along the drilling path (e.g. sedimentary layering). Interpreters roam through the seismic data and identify regions of interest which they match against well logs to gain insight into the stratigraphy and petro-physical properties in a region. Based on this information they model subsurface structures such as rock layers and boundaries between materials (Figure 2). The whole process is more complicated than this, but we have concentrated on the interpretation phase because it is very important and is repeated many times.
4 Seismic Data The seismic cube is the central data structure for most exploration and interpretation tasks. Subsurface structures like horizons and faults are defined relative to the seismic cube and typically displayed as polygonal models. The traditional way of representing the seismic volume is through three orthogonal slices called crossline, inline and time slice (Figure 2). We developed the cubic mouse for navigating in the seismic volume and for positioning the three slices. This cube-shaped, tracked input device, shown in Figure 3, mimics the shape of the seismic cube. The cubic mouse is tracked with a 6 DOF sensor and the orientation of the seismic cube follows in sync, effectively placing the seismic cube in your hand. Rotating the cubic mouse rotates the seismic cube. Since the other structures like horizons, faults, and wells are defined relative to the seismic cube, they move with it. As you can see in Figure 3 the cubic mouse has three sliding rods passing through it. Each of these rods positions one of the traditional seismic slices. The slices are aligned with the faces of the cubic mouse and keep in sync as it moves, so the rods stay always perpendicular to the slices. The cubic mouse has three buttons on the top. Two buttons are for scaling the seismic cube up or down. When both of these buttons are pressed at the same time the centre
170
5 Well Log Data As mentioned earlier the well logs present a challenging visualisation problem due to the dense multi-attribute data. We have taken a multi-sensory approach by visualising two variables with a bivariate colour scheme and allowing additional variables to be heard with a Geiger-counter sonification. The visualisation shows drill holes as tubes with the well log data colour mapped onto them (Figure 5). For example, colouring neutron porosity blue and bulk density yellow will colour the well log in a similar manner to the traditional method in which interesting regions appear as strong blue and yellow stripes next to each other. The well log visualisation can also show vector data (e.g. stress-field and dip-direction) and planes/surfaces (e.g. structural dip, sedimentary layers) as icons at points down the drill-hole. A magnifying lens can be slid over interesting regions such as a blue/yellow striping signature. One or two additional variables may be visualised with a secondary panel that also slides along the drill-hole. A graphic line-plot of the variables can also be activated on the panel. The sonification is attached to the lens to provide access to other data variables that are not shown visually. The sonification is based on the Geiger-counter device for detecting and measuring radiation that is familiar to most geo-physicists. A Geiger-counter makes a clicking sound that increases in rate with the number of radioactive particles passing through its sensor. The widespread use of the Geiger-counter indicates that the sounds are widely and correctly understood. The virtual Geiger-counter responds to measured gamma radiation in a similar manner to a real Geiger-counter. Clicks are generated by a granular synthesis algorithm. The click rate is perceptually scaled by fractionation to give 10 equal steps in auditory difference as the data goes from 0.0 to 1.0. The virtual Geiger-counter has the advantage that it can sense other well log variables such as neutron density, bulk density, electrical conductivity etc. and several variables can be sensed at the same time. There is a separate synthesiser for each active field and the outputs are mixed together. Correlation is heard as a single texture, while a de-correlation is heard as two or more distinctly separate rhythm streams in the sound. As you move the probe up and down the well log you can listen for answers to questions such as ”where is the data?”, ”are there any outliers?”, and ”how does the well log relate to other data?”. For example you can listen to the gamma radiation while looking at striped regions on the well log visualisation, or listen at points where the drill-hole passes through an interpreted surface, or in the vicinity of structures in the surrounding seismic cube. The Geiger-probe is attached to the lens that is controlled by a manual slider potentiometer attached to the wand. The speed of the lens varies in a continuous manner with the distance of the slider from the middle position. Positioning the slider close to the middle causes the lens to stay stationary, toward the top moves it upward, and towards the bottom moves it downward. The speed of the probe causes the data to be accessed at 3 levels of resolution. At high speeds the low resolution data set is sonified, while at low speeds the high resolution data is heard. The slider can be used to scan the well log at high speed for regions of interest. Sweeps can be made at slower rates over smaller intervals to home in on peaks or boundaries or other features.
Figure 3: The first prototype of the cubic mouse device
of rotation and scaling of the seismic cube is set to a new point at the intersection of the three slices. This is important when you want to scale up a certain feature. Set the new centre of rotation and scaling to be at the feature and scale up. The feature gets scaled around the new centre and now rotating the cubic mouse lets you look at the feature from different directions. The third button is the clutch which disengages the connection between the cubic mouse and the seismic cube. By de-clutching you can put the cubic mouse down while leaving the seismic cube in some fixed position. In addition to the three standard orthogonal seismic slices we provide an unconstrained seismic slice combined with a slightly offset clipping plane. The slice can be attached to the hand and moved through the data set like a wiper. Due to the slight offset of the clipping plane the horizons and faults pierce through the seismic slice which allows verification of their alignment with the seismic data. As an alternative to two-dimensional seismic sections we implemented a volume rendering lens shown in Figure 4. Semi-transparent volume rendering is performed inside a cubic lens, which can be attached to the user’s hand. Moving the lens through the volume allows the user to view and follow subsurface structures in arbitrary directions in three dimensional space.
6 Experiences and Discussion The initial prototype of our system used a conventional virtual tools based approach for interaction. Users had to pick up different tools for each task, e.g. a zoom tool, a rotation tool, and so on. To drag around a seismic slice, the user had to pick up a drag tool with a tracked wand, point to the slice, press the button on the wand, and move the slice by moving the wand. This version was demonstrated to experts from the oil and gas industry in June 1998. It was imme-
Figure 4: The volume rendering lens
171
evaluated this version with a geologist for three days, then presented the system for four hours to 20 experts from a consortium of oil and gas companies. After the presentation we continued with another evaluation session with three geologists from those companies. It was generally agreed that the cubic mouse made most common tasks immediately available and easy to perform, and the other virtual tools were only needed occasionally. Fine adjustments to the slice positions is easier with the rods than with virtual tools because frictional force gives some extra feedback and control that is not there when moving your hand in thin air. Because the seismic cube is always in sync with the cubic mouse the rods that move the seismic slices are always perpendicular to the slicing planes, making it intuitive to find the desired rod without looking at the device. During our evaluation sessions some geologists predicted that the cubic mouse will become a standard for their application domain within the next years. In the case of the sonification the Geiger-counter metaphor makes it much easier to explain to people who have not experienced the use of sound to represent data before. Many people are rather wary of a sonification but during demonstrations the people we showed it to did not hesitate to try it out. One expert interpreter played with it for half an hour and used it to verify the expected change in the sonic velocity of the well log where an interpreted horizon had been constructed to pass through it. The possibility to listen to more than one variable at the same time takes longer to explain, and the more complex sound seems more difficult to understand. A comment was ”why not use a different sound for each different variable so you can tell which one is playing ?”. This could be an effective way to hear the separate variables, but will require training to learn meanings. The user-interface to the lens raised many issues of interaction in virtual environments. The well logs are quite small compared to other structures in the interface and can be difficult to hit with a virtual tool which works by intersecting a ray with the geometry. Moving the lens along the well log with the virtual tool is difficult and takes some practice because the ray moves with 6 degrees-offreedom, and acts as a lever which amplifies unsteady hand movements. The dextrous resolution of the user’s hand also limits access to the data to a level that was often much less than the data available. As a result of these observations we attached a manual slider-potentiometer as an alternative means to move the lens up and down the well log. The manual slider feels more natural and is much easier to control because the one-dimensional input device matches the one-dimensional positioning task along the well log. In our initial trial we used an absolute mapping from the slider position to the lens position along the well log, so the top of the slider was the top of the well log, the bottom of the slider was the bottom of the well log. We found problems with this absolute positioning scheme because noise from the slider potentiometer caused the lens to jump around erratically, and access to the data was limited by the 8 bit resolution of the analog-digital converter. These problems were overcome with a relative positioning scheme that maps the position of the slider to the velocity of the lens. Positioning the slider to the top causes the lens to move quickly upwards, positioning it to the bottom causes it to move quickly downwards, and in a region near the mid-point it remains stationary. This scheme allows the sonification to vary the resolution depending on the speed of the lens/Geiger-probe, so that at low speeds the data-set can be heard at full resolution.
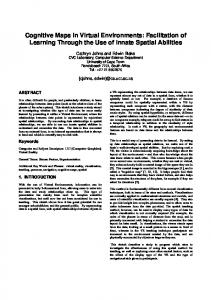
Figure 5: A short section of a well as it is visualised by our system. The neutron porosity is assigned the yellow value, the bulk density of the rock the blue value. As it can be seen, the neutron porosity is high in the upper part, while the bulk density is low for this section. In the lower part it is inverse. The panel next to the well in the upper part shows the natural gamma radiation as a greyscale-map on one side and as a graph on the other. The lower part shows the magnifying lens.
diately clear that the integration of the seismic survey, the well logs and the interpreted surfaces all in the same three-dimensional display was a major advantage, making it much easier to understand and verify relations between the different data types. In particular the direct interaction techniques made our system really different from a conventional desktop system and were greatly appreciated. For example, users could just reach into the environment, pick up a horizon, take a closer look at it or move it out of the way if necessary. Some problems they identified included the need to more finely position slices through the seismic cube, the need to be able to see structures in the cube as three-dimensional elements rather than by two-dimensional slices, the need to access multi-attribute data in the well log visualisations, and the need for more resolution on the interpreted surfaces. Sometimes the slices were hard to find when they were hidden behind faults or horizons. During the second round of development we built the cubic mouse to address the problems of interacting with the seismic data, the volume lens for visualizing three-dimensional structures, and the multi-modal visualisation and sonification of well logs. We
7 Summary and Future Work In this paper we presented new ideas for the exploration of data from the oil and gas industry in interactive stereoscopic virtual environments. The two most interesting results of our work are the development of a novel input device, which greatly facilitates the
172
interaction, and the development of a multi-sensory visualisation and sonification tool for well logs. Our system has been evaluated by experts from the oil and gas industry as well as from software vendors for this application domain and there are already some indications that some of our ideas are going to be adopted by commercial geo-scientific systems. Often oil companies have their experts working in different places all over the world. We are currently extending our system to support a collaborative exploration and interpretation process for these distributed settings. There is a variety of interesting issues to resolve, for example how to deal with huge data sets and how to support the successful concept of props for the distributed case? The cubic mouse has potential to be of benefit in other domains with similar tasks. One example is medical visualisation, where three orthogonal slicing planes are used to view human cross sections from volumetric CT, MRI, and PET data sets. Another example is engineering which uses three orthogonal clipping planes to perform so called chair cuts for removing a quadrant from an engineering model. We will follow up the suggestion to add different timbres to the Geiger-counter so that different attributes of the well log sound different. Spatialisation of the sound may prove helpful for displaying directional data in the well logs. The Geiger-counter can also be used to listen to seismic data. This could involve extending the point sensor to be a plane or volume. From our experience in this project we are encouraged to continue our work in the largely unexplored area of multi-modal interfaces.
[6] Bowen Loftin et al. Immersive data visualization in the geosciences. In Proceedings of the International Immersive Projection Technology Workshop ’99, pages 41–50. SpringerVerlag, 10,11 May 1999. [7] Anton Fuhrmann and Eduard Groeller. Real-time techniques for 3d flow visualization. In Visualization ’98, pages 305–312, 1998. [8] Ken Hinckley, Randy Pausch, John C. Goble, and Neal F. Kassell. Passive real-world interface props for neurosurgical visualization. In Gavriel Salvendy, editor, Proceedings of ACM CHI’94 Conference on Human Factors in Computing Systems, pages 452–458, 1994. [9] Choi I. Sound synthesis and composition applying time scaling to observing chaotic systems. In Greg Kramer, editor, Auditory Display: Sonification, Audification, and Auditory Interfaces. MA: Addison Wesley, 1994. [10] Stevenson D. S. Smith K. A. McLaughlin J. Gunn C. Veldkamp J. and Dixon M. Haptic workbench: A multi-sensory virtual environment. In Proceedings of the SPIE Conference on Stereoscopic Display and Virtual Reality Systems IV Vol. No. 3295, San Jose, January 1999. [11] Wolfgang Kr¨uger and Bernd Fr¨ohlich. The Responsive Workbench. IEEE Computer Graphics and Applications, pages 12– 15, May 1994. [12] Francioni J.F. Albright L. and Jackson J.A. Debugging parallel programs using sound. In Proceedings of the ACM/ONR Workshop on Parallel and Distributed Debugging. MA: ACM Press/Addison Wesley, 1991.
8 Acknowledgements This work was supported by the VRGeo consortium. We would like to thank the members of the consortium for their valuable feedback during consortium meetings. BHP, Statoil, Landmark, and Mobil supplied data for this project. Special thanks to Keith Nesbitt for his assistance in the initial phase, Trond Bergø for his advice and expertise, Mark Dobin, Andres Callegari, and Doug Whitman for their input. Thanks also to Michael Tirtasana for integrating the volume data sets, and to rest of the VE group at GMD for their support.
[13] Smith S. Bergeron R.D. and Grinstein G. Stereophonic and surface sound generation for exploratory data analysis. In Proceedings of CHI ’90. ACM Press, 1990. [14] Barrass S. Auditory Information Design. Doctoral dissertation, Australian National University, 1998. [15] Bly S. Sound and Computer Information Presentation. Doctoral dissertation, University of California, Davis, 1982.
References
[16] Fitch T. and Kramer G. Sonifying the body electric: Superiority of an auditory over a visual display in a complex, multivariate system. In Kramer G., editor, Auditory Display: Sonification, Audification, and Auditory Interfaces. MA: Addison Wesley, 1994.
[1] Wesche G. Kraemer-Fuhrmann O. Froehlich B. and Klimetzek F. Highly interactive visualization of fluid dynamics in a virtual environment. In Proceedings ISATA 1997, 1997. [2] Steve Bryson and Creon Levitt. The virtual windtunnel: An environment for the exploration of three-dimensional unsteady flows. In Visualization ’91, pages 17–24, 1991. [3] Hayward C. Listening to the earth sing. In Greg Kramer, editor, Auditory Display: Sonification, Audification, and Auditory Interfaces. MA: Addison Wesley, 1994. [4] Scaletti C. and Craig A.B. Using sound to extract meaning from complex data. In Farrel E.J., editor, Extracting Meaning from Complex Data: Processing, Display, Interaction, Vol. 1259, 147, pages 147–153. SPIE, 1990. [5] Carolina Cruz-Neira, Daniel J. Sandin, and Thomas A. DeFanti. Surround-screen Projection-based Virtual Reality: The Design and Implementation of the CAVE. In James T. Kajiya, editor, Computer Graphics (SIGGRAPH ’93 Proceedings), volume 27, pages 135–142, August 1993.
173