Exploring Internet Activities Using Geo-visualization Technique Fang Ren and Mei-Po Kwan Department of Geography, The Ohio State University, Columbus, OH, 43202 Email:
[email protected],
[email protected]
Abstract Recent studies have examined the interaction between people’s Internet use and their activity-travel patterns from both quantitative and qualitative perspectives. Although empirical studies have made great progress on generalizing the impact of the Internet on people’s daily activity-travel patterns, very few studies have successfully investigated why and how the observed patterns are generated. One reason for this is that the traditional space-time prism cannot accommodate important activity attributes besides space and time, such as activity types and location types. In addition, it is inappropriate to simplify Internet users’space-time paths as single lines in that they can be “present”at different spatial scales simultaneously. Based upon previous theoretical frameworks, this study attempts to employ geo-visualization technique to explore the processes underlying people’s hybrid activity-travel patterns. An activity-Internet diary data set collected in Columbus (Ohio, USA) is used in the study. The data set provides information about respondents’activities and trips in the physical world as well as their Internet activities. The research results enhance our understanding of the function of the Internet in people’s daily life, and consequently will be beneficial to future quantitative modeling of hybrid activity-travel patterns. 1. Introduction The rapid spread of information and communication technologies (ICT), especially the Internet, in recent years has not only played an important role in the fields of industry and business, but has also greatly affected people’s daily lives as it provides a virtual space (cyberspace hereafter) where people can conduct various activities. Due to its remarkable influence, ICT related research has drawn much attention and different studies have been conducted with various foci. One such focus is on illustrating how the Internet might change people’s activity-travel patterns. To date, most related studies address the issue from two perspectives: 1) constructing conceptual frameworks to accommodate cyberspace in the traditional analytical framework or developing new conceptual frameworks (Hanson, 2000; Kwan, 2001, Dijst, 2003); and 2) generalizing the interrelation between Internet use and activity-travel patterns with empirical data (Mokhtarian and Meenakshisundaram, 1999; Senbil and Kitamura, 2003; Scrinivasan and Athuru, 2004; Kim and Goulias, 2004; Choo and Mokhtarian, 2004). While the existing results are yet inconclusive, all studies indicated that the impacts of the Internet on activity-travel patterns are very complex. However, very few insights were gained from these studies on how and why the observed patterns are generated. This is due to the lack of the appropriate data and effective tools to explore the data.
Another important dimension of activity-travel research is to examine whether different subgroups have the same activity-travel behaviors. Based upon the time geography view, recent studies have found that women experience more space-time constraints than men because of their traditional gender role (Kwan, 1999a, 1999b, 2000a ). Compared with men, women, especially non-employed housewives, take more household related responsibilities/activities that are highly spatially/temporally fixed. As such, women’s spatial movements and access to urban opportunities are greatly limited. However, with the Internet entering people’s daily lives, will the gender division of domestic labor still persist in cyberspace or will the Internet make men participate in more housework? To answer the above research questions, a powerful data exploration tool is needed. Activity-travel research is usually conducted with a travel diary data, which contains a large volume of information. Without an effective data exploration tool, it is impossible to have a better understanding of activity-travel behaviors either at the individual level or at aggregate level. Among the data exploration tools, the utility of geo-visualization technique is recognized. By utilizing the power of human vision, researchers are able to interactively explore data and construct knowledge to support decision-makings, in addition to present data in different ways (MacEachren, 1997). Therefore, geovisualization of human activity has gone far beyond a process of “seeing”data; it is indeed an effective means for detecting hidden patterns and building new knowledge by interacting with spatial and non-spatial data in a dynamic visualization environment. With an Internet-Activity diary data collected in Columbus (OH), this study develops a new geo-visualization approach to accommodate cyberspace in traditional space-time paths. It aims to explore how cyberspace interacts with physical space, why people prefer the Internet, and whether gender difference exists in cyberspace. The paper is organized as following: a brief literature review will be provided in section 2, which is followed by data modeling in section 3. The geo-visualizing structure will be illustrated in section 4. Analysis of results will be elaborated on in section 5 and finally conclusions and future research work will be summarized in section 6. 2. Geo-visualization of Human Activity Recently, with the availability of geo-referenced individual activity-travel data and advanced GIS techniques, the usefulness of geo-visualization techniques have gained greater recognition and have been tested. In doing so, researchers have already increased new insight into behavioral characteristics by presenting and exploring their data in different ways. Drawing upon the “space-time prism”concept (Lenntorp, 1976), people’s spatial trajectories can be portrayed as space-time paths in a 3D GIS environment (Kwan, 2000b; Kwan and Lee, 2004; Yu 2004). The 3D geographic environment includes both geographic and temporal dimensions, with the XY plane representing activity locations and the Z-axis covering 24 hours in a day. In such a coordinate system, any physical activity can be represented by a vertical line and the length of the line is the duration of the activity. Connecting all vertical lines according to the time sequence will form space-
time paths, showing spatial/temporal characteristics of activities. In addition, activity density surfaces were also generated in Kwan’s research to aggregate activity patterns of a large number of profiles. The activity density surface of a subgroup shows the intensity of a type of activity along the time line and the corresponding travel distance. Comparing the activity density surfaces of different subgroups, differences in activity-travel patterns will be identified. With the emergence of ICT, the geo-visualization tool has also been applied to explore human activity behaviors over the Internet. For instance, Kwan (2000c) developed a multi-scale 3D GIS representation to display human extensibility diagram with the impact of the Internet. By depicting a woman’s space-time trajectory in a multi-scale reference system, we can clearly see how the Internet relaxes her space-time constraints and extends her activity spatial extent to larger scales. Forer and Huisman (2000) perceived the space-time “aquarium”as a cellular framework. With the Boolean operations on the cells, it is easy to aggregate individual’s accessibility and conduct spatial-temporal queries. However, one limitation of the space-time approach is that it fails to maintain the semantic richness of travel diary data. Besides the space-time approach, Adam (2000) built an individual extensibility diagram using CAD with data that contained the details of five individuals’activities and communications in a day. Adam’s (2000) work incorporated semantic meanings of human communications and displayed activities at different scales. Unfortunately, he did not explicitly display the geographic locations of where the activities took place. Even if detailed longitudinal and latitudinal information is not very important for virtual activities, people’s activity-travel patterns cannot fully be disclosed without the spatial dimension because spatial patterns of activities cannot be detected. Another visualization technique, called parallel coordinate plot (PCP), was also adopted to interpret the concept of “fragmentation of activity”(Couclelis, 2004). This theoretical perspective emphasizes the importance of multiple activity attributes besides the spatial and temporal elements, which implies that visual representation of multi-dimensional attribute space is necessary. However, the maximum number of dimensions that can be visually represented is limited to three, and therefore it is needed to transform a multipledimensional space into a 3D or a 2D space. PCP is the technique that can represent multiple-dimensional information in a 2D plane, with parallel axes representing different dimensions. Hence, a person’s activity is shown as a polyline connecting the corresponding vertices on the axes. Additionally, this technique is also capable of visualizing activity participation for a large number of profiles. Similar to Adam’s approach, the geographic information of individual’s spatial movements is missing because X and Y geographical axes are distorted as two parallel axes, and the duration of each activity and people’s sequential movements cannot be visualized. Given these limitations, the most challenging task in geo-visualizing human hybrid activities is to effectively organize and represent multi-dimensional information contained in travel diary data, involving spatial, temporal, as well as multi-dimensional activity attributes. The task becomes especially complicated when the Internet is included.
Although different approaches like multi-scale geo-visualization and PCP have been experimented with, the current ways of accommodating Internet activities are not satisfactory; in particular, visualizing the interaction between cyberspace and physical space remains unknown. Based upon the time geography point of view, this study contributes to the existing literature by developing a new geo-visualization approach to accommodate cyberspace and to visualize how and why the Internet affects the physical world. Both spatial/temporal and other important activity attributes will be represented to assist data exploration. Secondly, this study also comes up with a conceptual data model using an object-oriented design methodology in order to handle multi-dimensional travel diary data. A clear conceptual data model can help us extract necessary data dimensions and organize the associations among these dimensions; especially its graphic expression which is very powerful in expressing geo-visualization structures. Without a solid conceptual data model, complex travel diary data sets cannot be fully examined. 3. Conceptualizing Human Activity-Travel Behaviors Modeling dynamic spatial/temporal processes has been a major task in GIS research since the late 1980s due to the static nature of traditional GIS (Langran, 1992; Renolen, 2000; Peuquet, 2001). Similar to dynamic spatial objects such as changing land use cover, an individual’s daily spatial movements can also be regarded as a dynamic spatial/temporal phenomenon that we can observe throughout a 24 hour period. Therefore, modeling human spatial activities can draw upon past temporal GIS database research. In general, there are two major data models that have been used to model spatial/temporal information in the discipline of GIS: entity-relational data models (or extended entityrelational data model: EER) (Langran and Chrisman 1988; Peuquet and Duan, 1995; Yuan, 1994; Nadi and Delavar, 2003) and objected-oriented (OO) data models (Worboys, 1994; Raper and Livingstone; Wachowicz and Healey, 1994; 1995; Fihida et.al, 2002). Compared with EER, OO models are advantageous in conceptualizing spatial/temporal objects (Renolen, 2000). For example, the object-oriented concept of encapsulation permits attributes and methods to be inherently together in a class, which allows us to conceive independent objects, and thus the performance of a query will become more efficient (Rex and Risch, 1996). Especially, in the context of modeling human activitytravel behaviors, the OO approach is more suitable because the major research targets are highly structured objects that have their own attributes and behaviors. For example, a person has his/her own socio-economic status thus each person has different behaviors such as undertaking different activities and traveling in the physical world. Hence, the object-oriented modeling approach provides a more intuitive representation of complex reality and maintains and builds a “close-to-reality”activity-based model for travel behavior research (Fihida et.al., 2002). Using the OO modeling approach, Fihida et.al (2002) implemented an object-oriented spatio-temporal data model and an OO database prototype to serve transportation demand forecasting needs. However, Internet activities were not considered in Fihida’s model and individual’s complete travel history cannot be
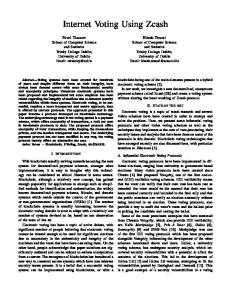
explicitly exhibited. Therefore, a new OO data model is required in order to model human hybrid activity travel behaviors. Figure 1 drawn in the Unified Modeling Language shows the OO diagram developed in this study. It presents the major objects and their associations. ‘Person’, the central compound object, is able to memorize the history of what he/she did, where he/she visited, and when he/she performed the activities by retrieving his/her space-time paths that accommodate the use of the Internet. Differing from the ‘Physical Activity’object, the ‘Internet Activity’object has its own unique attributes that enable us to disclose why and how the Internet is used in different situations. The ‘Time Window’object allows temporal queries for both activities and trips.
Activity Wind. Time Window Trip Window Household
Schedule Trip
Person
Activity
Act. Place
Physical Act. Internet Act.
Generalization Aggregation Association Figure 1: OO Diagram of Hybrid Activity-Travel Behaviors In spite of the strengths of OO models, implementing an OO model with an OO database is not flexible because most OO databases do not support a standard query language such as SQL (Raza and Kainz, 2002) and OO databases are not as widely spread as relational databases. Therefore, a practical solution is to combine a logic models based upon OO concepts with object-relational databases such as a geodatabase supported by ArcGIS. In doing so, any RDBMS can be used and the powerful functionality of RDBMS, SQL in particular, can be utilized or advanced without losing the advantages of the OO design
methodology. Hence, this approach is adopted in this study. The proposed OO data model in which human hybrid activity travel behaviors are modeled is implemented with the object-relational geodatabase using ArcObjects in an ArcGIS platform. 4. Geo-visualization Design The geo-visualization system developed in this study consists of two parts: a representation of 3D space-time paths that accommodates cyberspace and a representation of 2D space-time paths with a focus on exploring the interactions between cyberspace and physical space. 4.1 3D space-time Paths and Information Cubes Traditionally, most geographic notations, including the construct of a “space-time aquarium”, are related to distance, because distance plays a very important role in physical space as stated in Tobler’s first law of geography. Compared with physical space, the interactions in cyberspace dramatically differ in that they have little to do with the physical separation among locations. In the physical world, the greater the distance, the larger the cost associated with overcoming this physical obstacle. In contrast, there is no need to conquer the impedance of distance in cyberspace. Given this difference, Euclidean distance fails to measure travel on “information highways”in cyberspace. Moreover, the current geo-visualization approach of space-time paths depicts a physical activity as a single line segment, which is not appropriate for portraying an Internet activity since people can visit multiple websites during the activity’s duration without physical movement. Therefore, it is necessary to modify traditional space-time paths in order to accommodate Internet activities. Past studies on space-time measures for individual accessibility indicate that individual daily accessibility and activity space are relevant to how far a person can travel and how many opportunities he/she can obtain during a given amount of time. Drawing upon the existing accessibility and activity space concepts, the cyber-accessibility and the size of information space of an Internet user also depend on how much time he/she spends on the Internet, how quickly he/she can get to the intended websites, and how many cyberopportunities he/she is able to have access to. Although it appears that distance and physical locations of hyperlinks are not crucial in cyberspace, this does not mean that people can have access to any intended websites without any barriers. In the context of the Internet, bad Internet network performance becomes the friction that prevents people from launching some websites. Particularly, the Internet connection speed is the most important indicator of the Internet network performance, because Internet activities are much more sensitive to latency (Kwan, 2001). Controlling for other factors, high-speed Internet facilitates people to visit more websites and to obtain more diverse information, consequently increasing the size of information space. As such, the Internet connection speed should be taken as one essential measure to evaluate individual cyber-accessibility and information space. Besides Internet connection speed, the amount of time spent online is also a factor influencing cyber-
accessibility. Obviously, the amount of time spent on the Internet is positively related to cyber-accessibility. Meanwhile, the amount of time available for Internet activities is largely determined by individual space-time constraints. Even if given the same amount of time and same Internet service, different individuals will have dissimilar cyber-accessibility because they will have access to different cyberopportunities. Highly skilled Internet users are usually able to have access to more cyberopportunities to satisfy their needs, just as a local person knows how to locate more urban opportunities than a newcomer. Additionally the number of cyber-opportunities that an Internet user normally reaches is affected by the person’s online habits. Eventually, how many cyber-opportunities are visited in a period of time can be reflected by how much diverse information is obtained over the Internet. Therefore, the number of websites visited can be regarded as an approximate indicator of cyber-opportunities, with the assumption being that every website contains the same amount information. Put differently, all websites are assumed to be equally weighed cyber-opportunities. The more websites a person visited in a given amount of time, the greater their cyberaccessibility. Based on time, the Internet connection mode, and the number of websites visited, information cubes were constructed (as shown in Figure 2), replacing the conventional space-time line segments which represent information space. It is evident that the size of information space is the volume of the corresponding information cube, which is determined by the above three factors. The volume of all information cubes for a daily space-time path is the measure of an individual’s cyber-accessibility of a particular day.
Figure 2: Modified 3D Space-Time Path With modified space-time paths, we will be able to investigate Internet activity patterns of subgroups. Firstly, aggregating information cubes along the time line will allow us to compare how information spaces of subgroups change in a day. Secondly, it is also feasible to aggregate information cubes based on activity purposes. In doing so, we will gain more insights into what people do over the Internet and what their cyberaccessibility is for different purposes, and detect whether any differences exist among subgroups.
4.2 Interactions of the Internet and Physical Space In order to have a better understanding of people’s Internet activity behavior, the examination on what and when people pursue Internet activities is not enough. It is also necessary to explore why people utilize the Internet and how cyberspace interacts with physical space. To fulfill this research objective, a 2D geo-visualization structure was designed in this study. As shown in Figure 3, two 2D coordinate systems are linked together by sharing a temporal axis: one representing physical space and the other cyberspace. In the physical coordinate system, the X axis is the distance between home and out-of-home activities, which designates the spatial extent of people’s movements. Similar to 3D space-time paths, people’s spatial activities including Internet activities can be represented with 2D line segments with the distance from home representing the spatial dimension. In the cyberspace coordinate system, the design methodology of PCP technique is employed since PCP permits transforming a multi-dimensional space into a 2D space. Basically, there are four parallel axes in the cyberspace reference system which represents different dimensions of information, including Internet use, an individual’s reasons for choosing the Internet, the interactions with physical space, and the time use comparison. For any Internet activity, by linking the values on the parallel axes and the corresponding line segment in physical space, we will be able to immediately know where and when the Internet activity took place, what type of Internet activity it was, why the individual preferred the Internet to complete the activity, how the Internet influenced the physical world, and if the Internet was a time-efficient tool in this particular case. Further, aggregating 2D space-time will also enable us to identify activity patterns for a large number profiles. For example, the aggregation in physical space will allow us to examine inter-group difference in the spatial extent of activities; and in cyberspace, it facilitates the study of correlations so that we will have a clear perception of how the Internet affects the physical world and in what situations people are more likely to utilize the Internet. More analyses will be illustrated in the next section. 5. Geo-visualization Implementation and Analysis Results 5.1 Study Area and Data An activity-Internet survey was conducted in Columbus (Ohio, USA), which is a midsized metropolitan area with a population of about 1.62 million in 2000. Besides the collecting information on participants’households, individual information, and general use of the Internet, the survey instrument also included a two-day travel diary . The diary collected in-depth data about participants’physical and Internet activities. The survey instrument not only collected traditional activity-travel information, but also detailed information about Internet use for each Internet activity, for example, why an individual chose to use the Internet to complete the activity, how he/she would undertake the activity in the physical world if it was possible, and hypothetically how long it would
take to complete the activity in the physical world. This information helps us further our exploration of Internet activity behavior. The activity-Internet survey was conducted in late 2003 and 2004. Since the number of non-Internet users was very small in the sample, we only focused on the behavior of Internet users. A total of 420 usable surveys from a population of 472 individuals were obtained. The sample includes 272 women and 148 men, among these Internet users. Most of these individuals are white (93%) and highly educated (80% are college or graduate degree holders). Also, 42% of households in the survey have annual household income greater than $80,000 and only 14% of households earn less than $40,000 per year. Additionally, the Franklin County street network data was used in the study to calculate the shortest paths and is also used as a geographic environment for geo-visualizing spacetime paths. 5.2 Mapping OO Diagram to GeoDatabase The geodatabase supported by ArcGIS is a repository of geographic data based on objectrelational technology. According to the scale of the geodatabase, it can be classified as either a personal geodatabase for small-scale applications or a multi-user geodatabase that can be accessed by multiple users. Because ESRI uses the Microsoft Component Object Model (COM) to create the ArcGIS platform, upon which ArcObjects is built, the entire system is potentially open to customization down to a low level. Put differently, end users are allowed to reuse and extend the existing ArcObjects objects without accessing to their source codes, and customized objects created by any COM-compliant development language can be plugged seamlessly into an ArcGIS environment. In the context of customizing a geodatabase, it is feasible to establish a user-defined geodatabase by using ArcObjects to customize features of their own types. Table 1: Mapping the OO Diagram to Geodatabase Objects in the OO diagram
Tables/feature classes in the geodatabase
Person, Household, Activity Place
Tables
Scheduling, Time Window
Tables
Physical Activity, Trip
3D and 2D Polyline Feature Class 3D Multipatch Feature Class 2D Polyline Feature Class
Internet Activity
A personal geodatabase was applied in this study, which uses the Microsoft Jet Engine database (such as an Access database) file structure to store GIS data. In a geodatabase, both non-spatial objects and spatial objects are stored in the form of tables, but spatial objects are called features because they have a special column to store their geometric shape. In our case, physical activity, Internet activity, and trip objects are features. Since the proposed geo-visualization system consists of both 2D and 3D frameworks, it is
necessary to build 2D and 3D feature classes for physical activity, Internet activity, and trip objects respectively. Table 1 summarizes how the objects defined in the OO diagram were mapped into the personal geodatabase. 5.3 Individual and Aggregate 3D Space-Time Paths Both 3D and 2D space-time paths were developed within a build-in customization environment (VBA scripts) in ArcScene and ArcMap. Figure 4 shows the toolbar customized for visualizing 3D space-time paths and the 3D space-time path of a selected woman. The toolbar contains the customized functionality for visualizing a 3D spacetime path. Loading data is to make the system have access to the built geodatabase and load person IDs for future selection. With any selected person, the system will ask for the day for which the data is collected and then exhibits the space-time path for the required day and person. In addition, the system also generates aggregate space-time paths for different subgroups, including men and women working full time, part-time employed women, and non-employed women. This paper will only focus on gender difference. Future studies will investigate the difference in employment status.
select a person
show 3D ST path
show aggregate result
Figure 4: The 3D space-time path of a selected woman
As shown in Figure 4, the 3D polylines and multpatches with different colors convey the information about where, when, and for what purpose the activity was undertaken. The activity purposes in this study are classified into five categories: for work, household needs, personal needs, recreational needs, and social activities. Meanwhile, 3D labels are attached to 3D space-time paths in order to identify activity places besides the geographic locations. By viewing the 3D space-time path of the selected woman, we can immediately grasp her day’s spatial trajectory, including working activity at the office, having lunch at Heavenly Ham, working at the Microsoft store, running errands between home and the stores Staples and Petsmart. In addition to these physical activities, there were four Internet activities: two of them highlighted in red were for work both in the morning and afternoon, one in brown was conducted for personal needs at the office at noon, and the last one in green was performed at home for household needs around 6pm. Therefore, the 3D polylines and multpatches are not merely geometric shapes; instead they maintain the semantic meanings of what they represent.
Figure 5: Aggregate Information Cubes for Women (brown cubes for personal needs, green cubes for household needs, and blue cubes for recreational needs) Figure 5 and Figure 6 demonstrate the aggregated information cubes of men and women for non-employment purposes. Taking a closer look at Figure 5 and 6, we find that the green information cubes, representing online household related activities, can be easily identified for women. However, because the two groups do not have an equal number of samples, it is hard to compare simply by viewing them. Thus, we broke down the information cubes into different categories and further extracted full-time employed men
and women as comparison groups for employment status could greatly influence their daily activity participation. As shown in Figure 7 through 9, the X axis represents time starting from 3am through 3am of the next day and the Y axis stands for the volume of information cubes normalized by the number of samples in each subgroup.
Figure 6: Aggregate Information Cubes for Women (brown cubes for personal needs, green cubes for household needs, and blue cubes for recreational needs) Figure 7 shows the overall information space of full-time employed men and women for non-employment activities along the time line. Generally, both men and women have a larger information space in the evening because they are relaxed from working responsibilities and have more free time in the evening to perform non-employment activities. However, men seem to engage in much more non-employment activities in cyberspace than women around 9am and 9pm, implying that men are more likely to spend about one hour during the morning office hours to complete non-employment activities online. Later on, we discuss what they usually do in these two periods of time. The information space of men and women for household related activities is shown in Figure 8. It is quite obvious that women participate in much more household work in cyberspace than men, which indicates that traditional gender division of domestic labor still persists in cyberspace to a large extent. The reason that women are more likely to use the Internet to meet their household needs might be due to the flexible scheduling of Internet activities and eliminating travels, as for instance shopping and banking could be
Information Space for Non-Employment Activities
performed in the evening without going out of the home. We will further discuss this issue later on. 300
250
Men
200
150
100
Women 50
0 1
180
359
538
717
896
1075
1254
Time (minutes)
Figure 7: Information space of full-time employed men and women for non-Employment activities
30
Men
Information Space for HH
25
Women
20 15 10 5 0 1
180
359
538
717
896
1075
1254
1433
Time (minutes)
Figure 8: Information space of full-time employed men and women for household related activities
1433
Figure 9 displays the gender difference in recreational information space. Not surprisingly, compared with women, men are more likely to take advantage of the Internet to perform recreational activities; especially given that men’s recreational information space peaks at 9am and 9pm. This finding suggests that the Internet competes for men’s evening time to a larger extent than for women, and men are more likely to spend the time for recreational activities. However, we cannot draw a conclusion that men spend more time on recreational activities after they adopt the Internet, because the Internet may just substitute physical recreational activities without increasing them. To answer this question, further studies are required to examine the relationships of the use of the Internet and changes of activity participations.
Information Space for Recreational Activities
140 120
100
Men 80
60 40
Women
20 0 1
180
359
538
717
896
1075
1254
1433
Time(minutes)
Figure 9: Information space of full-time employed men and women for recreational activities Further, Figure 10 and 11 compare different types of information spaces within the same group. It can be drawn from these two figures that the Internet still helps with the household work the least for both men and women, though women comparatively engage in more online household work. This finding is understandable because most of household chores have to be undertaken in the physical world such as cooking and cleaning. Therefore, the Internet seems to hardly release women from their traditional gender role directly. However, the Internet might indirectly reduce the time spent on the household work because it facilitates women to perform activities for personal needs like email and for recreational needs such as gaming, which will finally result in reassigning time to different activities.
140
Different Types of Information Space
120
Household
100
80
Personal
60
Recreational 40
Social
20
0 1
180
359
538
717
896
1075
1254
1433
Time(minutes)
Figure 10: Different Types of Information Spaces for Full-Time Men
Different Types of Information Space
100
80
Household 60
Personal 40
Recreational 20
Social 0 1
180
359
538
717
896
1075
1254
1433
Time(minutes)
Figure 11: Different Types of Information Spaces for Full-Time Men
5.4 Individual and Aggregate 2D Space-Time Paths As described in section 4, PCP design methodology was applied to visualize cyberspace. There are four parallel axes in the cyberspace reference system. The first one is the use of the Internet. According to the survey, Internet use is classified into ten categories: working, email, web surfing/gathering information, online purchasing, online
banking/paying bills, online auction, borrowing books from library, maintaining personal blog/editing photos, and other. The second axis pertains to the reasons that people chose the Internet, which has five categories including more information, saving time, saving money, eliminating travel, and other. The third axis is concerned with how the activity could possibly be completed in the physical world. Participants reported four major means: 1) it could not be performed in the physical world, indicating that the Internet enlarges people’s accessibility by providing new opportunities; 2) by other media such as TV/magazines/fax, indicating the Internet substitutes physical one-way communications; 3) by traveling, showing the Internet reduces physical travels; 4) by face-to-face meeting/phone, implying the Internet replaces physical two-way communications. The last parallel axis contains the information about whether the Internet saves time for any Internet activity. The piece of information can be obtained by comparing the Internet activity duration with the amount of time needed if it was performed in the physical world. In the physical reference system, distance to home is calculated by generating shortest paths with the Franklin County street network.
Figure 12: 2D Space-Time Path Similar to the toolbar of 3D space-time paths, a 2D space-time toolbar was also implemented in ArcMap platform to facilitate exploring the diary data. Besides the function of displaying individual and aggregate 2D space-time paths, it also contains a function of returning the socio-economic attributes of the selected person as shown in Figure 12. In doing so, we understand who’s profile we are examining. For example, the person selected in Figure 12 is a 45-year old full-time working single mother with one child. She is a skillful Internet users with ten years experience in using the Internet and her average online time per week is four hours. During her diary day, she conducted one Internet activity in the morning at office and one in the evening at home. At the office, she went online for 5 minutes to check her balance thus the Internet saved her time and
eliminated travel to the bank. If she were to perform this activity in the physical world, she would have to physically travel which would take more time. Therefore, in this particular case, the finding implies that the Internet can act as a substitute for travel and cause the rescheduling of activities. In the evening, the woman checked her email at home for about half an hour. She could perform this activity with other media such as mailing in the physical world which would take a longer time, however she chose the Internet for more information is available in cyberspace. In addition, we also find out that the spatial extent of her movement is rather small. She traveled less than five miles to her office, and there were no recreational activities for her in that day. Therefore, the physical 2D space-time path shows that she was highly constrained by work and household responsibilities.
Figure 13: Internet use and reasons of adopting the Internet Besides exploring the impact of the Internet on individual’s behaviors, it is also necessary to have a generalized pattern of how the Internet influences the physical world. In order to have a more clear view of aggregate results, the aggregation was broken down to three groups: Internet use and reasons, Internet use and interactions, Internet use and time comparison. Figures 13 to 15 show the aggregate results of all participants. It is clear that people mainly utilize the Internet for sending email, gathering information, and completing job tasks, because the Internet can supply more information and save time. Following these three major Internet uses are online buying and banking/paying bills. It appears that saving time is also the major reason for people to conduct online banking/paying bills and online buying. Moreover, another important reason for online buying is that people can gain much more information in cyberspace to compare products and prices than in local stores. Figure 14 also further demonstrates that the Internet is used as a time-efficient tool in most situations, because it takes people more time if people conduct the same activity in the physical world.
Figure 14: Internet use and time comparison with physical space
Figure 15: Internet use and how the Internet interacts with physical space As far as how the Internet interacts with physical space is concerned, complementing current physical space and substituting physical activities are the two major ways of affecting physical space. Firstly, without the Internet, people would not maintain some of their interpersonal communications because traditional mailing service or phone calls are not as flexible as emails. Also, people would not gain as much information since physical medias like television or newspapers contain much less information than the Internet. For
employment purposes, the Internet enables working from home, which was impossible in the past. Therefore, the Internet actually expands the scope of people’s daily activity space and enhances their daily accessibility. One response to the added-on activities is the change in time use, because the Internet competes for usable time, which may cause further geographic consequences. In other word, when people adopt the Internet for new activities, it may alter both spatial and temporal characteristics of their activity-travel patterns due to the effect of space-time displacement. Secondly, the Internet directly substitutes physical travels. Among the different Internet uses, email and online banking/paying bills services are more likely to reduce physical travel required for meeting people or visiting local bank branches as shown in Figure 15. Some work-related travels and face-to-face meetings today can also be eliminated by the Internet. Even though the Internet replaces some physical travel, it does not mean that the spatial extent of people’s movement will shrink, since new trips for other purposes might be generated. Therefore, the consequence of substituting physical travel is the modification of people’s travel behavior. 6. Conclusion This study employs 2D and 3D GIS to explore people’s hybrid activity-travel behaviors. Drawing upon the traditional space-time paths, information cubes were developed to replace line segments on traditional space-time representations and to represent cyberspace. Unlike physical space, the notion of cyber-accessibility is not relevant to distance; therefore, three new factors were counted for measuring cyber-accessibility and information space. The aggregate results suggest gender difference in cyberspace. Not only do men generally have greater information space, but also they are more likely to use the Internet to pursue recreational activities; while women still keep their traditional gender role in cyberspace as they take on more online household related work. In the meantime, we also found that the Internet does not help with household related work; rather it allows individuals to more effectively meet personal and recreational needs. Additionally, the interactions between physical space and cyberspace were also visualized to facilitate exploring why and how the Internet is utilized in people’s daily lives. Compared with physical space, cyberspace contains much more information to assist people’s routine tasks and it would costs less time to conduct the same activity. The aggregate results also suggest that the Internet mainly affects people’s activity-travel patterns in two ways: expanding the scope of previous activity space and substituting physical activities and travel. As a result, people’s activity-travel patterns will be modified due to the effect of space-time displacement. Since this study is based upon ongoing research, the current results cannot fully reveal what, why, and how the Internet impacts people’s activity-travel behavior. More studies will be conducted in future; particularly employment status will be taken into account as it plays an important role in shaping activity-travel behavior and influencing activity scheduling. Overall, the research will eventually enhance our understanding of the function of the Internet in people’s daily lives, and consequently it will be beneficial to future quantitative modeling of hybrid activity-travel patterns.
Reference Adams, P. 2000. Application of a CAD-based Accessiblity Model. In Janelle, D.G. and Hodge, D.C (eds) Information, Place, and Cyberspace: Issues in Accessibility. Berlin. Springer. 217-239. Choo, S. and Mokhtarian, P. 2004. Telecommunications and travel demand and supply: aggregates structural equation models for the US. In digital proceedings of 83rd Transportation Research Board Meeting, Washington D.C. January 11-15. Couclelis, H. 2004. Rethinking time geography in the age of ICT. At the International Specialist Meeting on ICT: Mobilizing Persons, Places and Spaces: Everyday Life and Urban Change, Doorn, The Netherlands, Nov.4-7 Dijst, M. 2003. ICTs and Accessiblity: an Action Space Perspective on the Impact of New Information and Communication Technologies. In Beathe, M, Himanen, V, and Reggiani, A (eds) Transport Developments and Innovations in an Evolving World. Berlin: Springer. Forer, P and Huisman, O. 2000. Space, Time and Sequencing: Substitution at the Physical / Virtual Interface. In Janelle, D.G. and Hodge, D.C (eds) Information, Place, and Cyberspace: Issues in Accessibility. Berlin: Springer. 73-90. Frihida, A., Danielle J. Marceau, and Marius Theriault, 2002. Spatio-Temporal ObjectOriented Data Model for Disaggregated Travel Behavior, Transactions in GIS 6(3), 277-294. Hanson, S. 2000. Reconceptualizing Accessibility. In Janelle, D.G. and Hodge, D.C (eds) Information, Place, and Cyberspace: Issues in Accessibility. Berlin, Springer. 267278. Kim, T.-G and Goulias, K. 2004. Cross sectional and longitudinal relationships among information and telecommunication technologies, daily time allocation to activity and travel, and modal split using structural equation modeling. At 83rd Transportation Research Board Meeting, Washington D.C. January 11-15. Kwan, M.-P. 1999a: Gender and individual access to urban opportunities: a study using space-time measures. Professional Geographer 51, 210-27. Kwan, M.-P. 1999b: Gender, the home-work link, and space-time patterns of nonemployment activities. Economic Geography 75, 370-94. Kwan, M.-P. 2000a: Gender differences in space-time constraints. Area 32, 145-56. Kwan, M.-P. 2000b: Interactive geovisualization of activity-travel patterns using threedimensional geographical information systems: a methodological exploration with a large data set. Transportation Research C 8, 185-203. Kwan, M.-P. 2000c: Human extensibility and individual hybrid-accessibility in spacetime: a multi-scale representation using GIS. In Janelle, D.G. and Hodge, D.C., editors, Information, place and cyberspace: issues in accessibility, Berlin: Springer-Verlag, 241-56. Kwan, M.-P. 2001: Cyberspatial cognition and individual access to information: the behavioral foundation of cybergeography. Environment and Planning B 28, 21-37. Kwan, M.-P. and Lee, J. 2004. Geovisualization of Human Activity Patterns Using 3D GIS: A Time-Geographic Approach. In Michael F. Goodchild and Donald G. Janelle (eds). Spatially Integrated Social Science, 48-66, New York: Oxford University Press.
Langran, G. Time in Geographic Information Systems. Taylor & Francis: 1992 Langran, G and Chrisman, R. 1988. A framework for temporal geographic information. Cartographica 25, 1-4. Peuquet, D and Duan, N. 1995. An event-based spatio-temporal data model (ESTDM) for temporal analysis of geographic data. International Journal of Geographical Information Science 9, 7-24 Lenntorp, B. 1976. Paths in Space-Time Environments: A Time-geographic Study of Movement Possibilities of Individuals. Department of Geography, The Royal University of Lund, Sweden MacEachren, A. M. and M.-J. Kraak 1997. Exploratory cartographic visualization: advancing the agenda. Computers & Geosciences 23(4), 335–-343. Mokhtarian, P.L. and Meenakshisundaram, R. 1999: Beyond tele-substitution: disaggregate longitudinal structural equations modeling of communication impacts. Transportation Research C 7, 33-52. Nadi, S. Delavar, MR. 2003 Spatio-Temporal Modeling of Dynamic Phenomena in GIS. In proceedings of ScanGIS, Espoo, Finland, June 4-6 Peuquet, D.J. (2001). "Making Space for Time: Issues in Space-Time Representation," Geoinformatica, 5(1): 11-32. Raper, J and Livingstone, D. 1995. Development of geomorphological spatial model using object-oriented analysis. International Journal of Geographical Information Scienece 9, 359-83. Raza, A. and Kainz, W. 2002. An object-oriented approach for modeling urban land use changes. Journal of the Urban and Regional Information Systems Association 14, 37-55. Renolen, A. 2000. Modeling the real world: Conceptual modeling in spatiotemporal information system design. Transactions in GIS 4, 23-42. Rex, R. and Risch, J. 1996. Animation Query Language for the Visualization of Temporal Data. In proceedings of Third International Conference/Workshop on Integrating GIS and Environmental Modeling. Santa Fe, New Mexico, January 2125, 1996. Scrinivasan, K. K. and Athuru, S. R. 2004. Modeling the interaction between internet communication and travel activities –evidence from bay area survey 2000. In digital proceedings of of 83rd Transportation Research Board Meeting, Washington D.C. January 11-15. Senbil, M. and Kitamura, R. 2003. Simultaneous Relationships between telecommunications and activities. In digital proceedings of 10thth International Conference on Travel Behaviour Research, Lucerne, August 10-15. Worboys, M.F. 1994. Object-oriented approaches to geo-referenced information. International Journal of Geographical Information Scienece 8, 385-99. Wachowitcz, M. and Healey, R.G. 1994. Towards temporality in GIS. IN Worboys, M.F (ed) Innovations in GIS. London, Taylor and Francis, 105-15. Yu, H. 2005. Spatial-temporal GIS design for exploring interactions of human activities. In digital proceedings of UCGIS Summer Assembly, Jackson Hole, Wyoming, June 28-July 1, Yuan, M. 1994. Wildfire conceptual modeling for building GIS space-time models. In proceedings of GIS/LIS, Phoenix, 1994