Sanjay K. Pandey James L. Garnett Rutgers University, Campus at Camden
Organizational Performance
Exploring Public Sector Communication Performance: Testing a Model and Drawing Implications
Sanjay K. Pandey is an assistant professor of public policy and administration at Rutgers University, Campus at Camden. His research has been published in PAR, the Journal of Public Administration Research and Theory, the Journal of Policy Analysis and Management, Administration & Society, the Review of Public Personnel Administration, the Journal of Aging and Social Policy, and Social Science and Medicine. He directed the National Administrative Studies Project (NASP-II), a survey of state health and human service agency managers. E-mail:
[email protected].
Despite its importance to agency effectiveness, communication performance is an understudied topic. This is partly attributable to the “performance predicament,” which arises because costs of communication are easier to measure than its benefits. In this study, we develop and test an exploratory model of public sector communication performance that is synthesized from the literature on public–private differences and organizational communication. This model is statistically significant and explains the variation in interpersonal, external, and internal communication performance. This is perhaps the largest empirical study on public sector communication to date. Our findings have two key implications for public managers. First, the constraints of red tape on communication performance can be overcome if key performance-enhancing conditions—goal clarity without rigidity and a culture that supports communication—are in place. Second, external communication poses more challenges and may require additional effort.
James L. Garnett is a professor of public policy and administration at Rutgers University, Campus at Camden. His research interests include administrative communication, reform, and reorganization; crisis management and communication; and strategic management. His books include Reorganizing State Government: The Executive Branch, Communicating for Results in Government: A Strategic Approach for Public Managers, The Handbook of Administrative Communication, and Internships for Dummies. Other articles have appeared in Administration & Society and Strategic Change. E-mail:
[email protected].
A
long-standing assumption within administrative and organization theory is that sound communication leads to sound performance. In his classic work The Functions of the Executive, Chester Barnard pronounced, “The first executive function is to develop and maintain a system of communication” (1938, 226). For Barnard, communication is not just an executive function—it is the first, primary function. In another classic, Simon, Smithburg, and Thompson acknowledged the crucial nature of communication to government performance: “Blockages in the communication system constitute one of the most serious problems in public administration” (1950, 229). Indeed, similar assertions about the salience of communication have been made in diverse literatures, including policy analysis (Durning and Campbell 1997; Majone 1989; Meltsner 1976), innovation (Lame 1997; Rogers and Shoemaker 1971), public leadership (Gardner 1990; Guy 1992; Korac-Kakabadse and Kouzmin 1997), and crisis management (Pijnenberg and van Duin 1991). Despite the focus on and attention paid to communication in a number of domains, few studies have
directly examined communication performance. This is partly the result of what Garnett (1997) calls the “performance predicament,” which he defines thus: “The costs of government communication are generally easier to measure than are its benefits, making it difficult to demonstrate a favorable performance ratio” (10). Certainly, there are exceptions to the performance predicament—major disasters, for example—in which the benefits of averting a disaster are easily demonstrated in retrospect, powerfully bring home the importance of communication performance. It has been shown that unreceived (or unheeded) warnings blocked or filtered through upward channels were instrumental to the 1986 Chernobyl radiation release (Lowernhardt and van den Berg 1989; Medvedev 1991; Wilson 1996), the 1986 Challenger space shuttle explosion (Charles 1989; Garnett 1992; Romzek and Dubnick 1987), and the 2001 World Trade Center and Pentagon attacks (Garnett and Kouzmin 2003; Kettl 2004). Other performance failures, such as the 1992 Los Angeles riots (Cannon 1997; Miller 2001) and the Anthrax attacks of 2002 (Brown 2002; Garnett and Kouzmin 2003; Siegel 2002), were exacerbated because of faulty interorganizational communication. Although crises forcefully demonstrate the benefits of effective communication performance, communication performance is just as important for day-to-day operations. Yet the extant literature on communication performance—specifically, communication performance in the public sector—is scant. The goal of this study is to develop and test an exploratory model of communication performance in the public sector. After elaborating this model, we provide a description of data collection and measurement, followed by our findings and discussion. We conclude by discussing the implications of this research for advancing knowledge and practice in public administration. An Exploratory Model of Communication Performance Organizational communication as a field of study does not have an overarching unitary paradigm (Huseman and Miles 1988; Jablin 1987; McPhee and
Exploring Public Sector Communication Performance
37
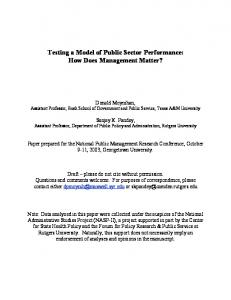
Poole 2000); instead, it is fertile ground for an array of middle-range theories (McPhee and Poole 2000; McPhee and Zaug 2001; Redding 1979). Middlerange theories have the modest goal of going one step beyond proposing minor testable hypotheses, seeking to provide an integrative framework for a circumscribed aspect of the phenomenon of interest (Merton 1968). Our purpose is to develop and test an exploratory middle-range theory of communication performance in the public sector. We define communication performance as performance along three key dimensions: interpersonal communication, internal (primarily formal) communication, and external communication. What should be the starting point of a middle-range theory of public sector communication performance? Given our exploratory purpose, it is possible to pursue several options. A natural starting point, in light of our interest in the public sector, pertains to the distinctive characteristics of public organizations. Leading public administration theorists have mounted persuasive arguments about the distinctive characteristics of public organizations (Bozeman 1987; Dahl and Lindblom 1953; Perry and Rainey 1988; Rainey and Bozeman 2000; Rainey, Backoff, and Levine 1976). Bozeman (1987) argues that although both public and private organizations are subject to political authority, public organizations face significantly higher levels of political authority. The increased accountability demanded by the political system has a profound impact on the structure and processes in public organizations (Bozeman 1987; Dahl and Lindblom 1953). The most comprehensive and current list of assertions about distinctive aspects of public organizations is presented by Rainey (2003, 75–76). Rainey is careful to mention that the evidentiary basis for these assertions is uneven and mixed. Rather than use the entire list of differences enumerated by Rainey, we focus on two that have been the subject of continuing research in public administration, namely, goal clarity and red tape. Additionally, based on our review of the organizational communications literature (Grunig 1997; Huseman and Miles 1988; Jablin and Putnam 2000; Jablin et al. 1987), we added organizational culture and size to the model (see figure 1). Organizational size is included in the model as a control variable. We sequentially discuss the effect of each of these variables on communication performance. Goal Clarity and Communication Performance Goal ambiguity, the converse of goal clarity, is one of the more widely asserted characteristics of public organizations. Although we use the term “goal ambiguity” in the singular, organizations almost always pursue a multiplicity of goals (Simon 1964). By 38
Public Administration Review • January | February 2006
Communication Performance Goal clarity Red tape
Interpersonal communication External communication
Organizational culture
Internal communication
Size
Figure 1 A Model of Public Sector Communication Performance overcoming the bounded rationality of an individual human being, organizations make the pursuit of multiple goals possible (McPhee and Zaug 2001). This organizational advantage, however, comes at a price— in the absence of a clear hierarchy of preferences, multiple goals lead to goal conflict. Thus, goal ambiguity (or lack of goal clarity) is characterized by a multiplicity of, conflict among, and vagueness of organizational goals (Rainey 1993). Excellent overviews of the literature on goal ambiguity are available (Chun and Rainey 2003; Rainey 1993); therefore, no attempt to survey this literature is made here. Despite some long-standing controversies (such as public– private differences in goal clarity), this literature does affirm the importance of goal clarity in determining key outcomes in public management. Goal clarity has an influence on attitudes about work (Bozeman and Kingsley 1998; Bozeman and Rainey 1998; Buchanan 1975; Wright 2004) and organizational performance (de Lancer Julnes and Holzer 2001; Holzer 1992; Meyers, Riccucci, and Lurie 2001; Pandey, Coursey, and Moynihan 2004). Indeed, fostering goal clarity has emerged as a key prescription for enhancing the effectiveness of public organizations (Rainey 2003, 134). The widespread awareness and popularity of this prescription is, perhaps to a large extent, a result of the call for “missiondriven” government issued in Osborne and Gaebler’s (1992) best-selling book. Clarifying agency mission was among the most widely implemented reforms at different levels of government during the 1990s (Brudney, Hebert, and Wright 1999; Thompson and Riccucci 1998). Why do agencies invest such energy in increasing goal clarity? As Nutt and Backoff point out, “[ambiguous] goals make it difficult to identify current and future directions” (1992, 45). Nutt and Backoff argue that although goal clarification is not easy in public organizations, it is a central task in the strategic management of public organizations and can be addressed through creative strategies such as “issue tension.” Confronting issues that involve tension between legitimate values rather than opposing ones requiring either/or choices helps the organization define goals in a manner that is likely to benefit all stakeholders. Goal clarification conducted in this
manner can mitigate conflicts and improve the quality of communication, measured by communication accuracy and consistency, among different stakeholder groups (Garnett 1992; Gold 1982; Wilson 1989). The mitigation of conflict and improvements in accuracy provide compounded benefits for other key aspects of the communication process, such as information sharing, influencing attitudes, promoting understanding, and persuading people to act or not act in certain ways (Garnett 1992; Cheney and Christensen 2000). Therefore, we hypothesize: H1: Goal clarity is positively related to communication performance. Red Tape and Communication Performance Buchanan (1975) set off a storm by providing evidence that indicated public organizations have lower levels of red tape than private organizations. Subsequent work using a variety of operational definitions and heterogeneous samples has conclusively rebutted this finding (e.g., Baldwin 1990; Bozeman, Reed, and Scott 1992; Pandey and Kingsley 2000). Therefore, our working assumption about red tape as a distinctive characteristic of public organizations is supported by both theory and evidence (Bozeman 2000; Pandey 1995; Rainey 2003; Rainey, Backoff, and Levine 1976). Given that red tape’s use as a social scientific construct is of recent vintage, we briefly review the red tape concept and then explore the relationship between red tape and communication performance. The red tape concept used in this study draws on Bozeman, who defines red tape as “[r]ules, regulations, and procedures that remain in force and entail a compliance burden but do not serve the legitimate purposes the rules were intended to serve” (1993, 283). He argues that benefits arising from procedural requirements should be counted merely as benefits and not attributed to “beneficial red tape”—the concept of beneficial red tape contradicts common usage and therefore creates unnecessary confusion. In yet another formative contribution, Bozeman draws a distinction between organizational red tape and stakeholder red tape; organizational red tape imposes costs on the organization as a whole, whereas stakeholder red tape has an impact on only a specific stakeholder group (Bozeman 1993). Our focus in this study is on organizational red tape. Although the definition of organizational red tape offered by Bozeman is useful, it fails to clearly define the term operationally. More recent work simplifies the task of specifying an operational definition (Pandey and Scott 2002). Pandey and Kingsley define red tape as “impressions on the part of managers that formalization (in the form of burdensome rules and regulations) is detrimental to the organization” (2000,
782). Pandey and Scott describe the salience of the modifications thus: It avoids the necessity of a detailed case study of every rule for determining the organizational/ social significance of the rule’s functional object…and, rather than leaving the determination of organizational/social significance as an open matter, it provides a clear guideline. Simply put, red tape exists when managers view formalization as burdensome and detrimental to organizational purposes. (2002, 565) In using the red tape concept, one more consideration is important: How specific should an organizational referent be to specify red tape? Two of the more commonly employed referents in studies on organizational red tape are the organization at-large and the personnel system in the organization (Baldwin 1990; Bozeman, Reed, and Scott 1992; Pandey and Scott 2002). In this study, we consider these two as well as other dimensions of red tape. There is growing evidence for the procrustean influence of red tape on different organizational and individual-level variables. Red tape has been shown to lead to a reduction in benefits provided to clients (Scott and Pandey 2000), produce increased work alienation (DeHart-Davis and Pandey 2005), and result in a more risk-averse organizational culture (Bozeman and Kingsley 1998). Anecdotal evidence seems to suggest that red tape has a negative influence on communication performance as well. Consider the saga of Colleen Rowley, the Federal Bureau of Investigation (FBI) field agent who was frustrated by communication red tape in her agency and, as a result, failed to transmit much-needed information to FBI headquarters (Yardley 2002). Although research has not directly examined the impact of red tape on communication performance, it is possible to draw implications by extending the research on red tape and closely related constructs such as formalization and centralization on communication performance. Red tape can influence communication performance in two key ways. First, rigid rules and procedures can be expected to restrict the number and capacity of communication channels available for transmitting information. Second, red tape is likely to negatively influence individual motivation to seek or provide needed information. Guy, in an insightful theoretical article, uses a metaphor to make this point: “The communication channels that work and that stay open and provide free and easy access up and down the chain of command are as important as blood vessels are to the human body.…When lines of communication become rigid and inflexible, they lose their usefulness and reliability as information channels” (1992, 328). Exploring Public Sector Communication Performance
39
In a study of the effect of formalization on communication, Shrader, Lincoln, and Hoffman (1989) demonstrate that formalization leads to reduction in the usage of informal channels for information-seeking purposes. Scott and Pandey (2000) report similar findings with respect to the use of formal communication channels in a study on the effect of red tape on benefit-determination decisions. Better communicators made significantly lower use of formal communication channels. Centralization’s effects on communication have been studied in greater detail, and increased centralization has been shown to lead to reductions in communication volume, time spent in informational interactions, and feedback (Miller 1987; Pearson 1992; Yammamarino and Naughton 1988). Thus, we hypothesize: H2: Higher red tape is associated with poorer communication performance. Organizational Culture and Communication Performance Despite culture’s salience for organizational outcomes, public administration scholars have paid little attention to it, believing that it is difficult—if not impossible—to influence the culture of public organizations (Khademian 2002). Certainly, public administration theorists have argued for the significance of the relationship between organizational culture and communication performance (Garnett 1997; Guy 1992). Empirical scholarship on culture and communication research initially focused on the concept of communication climate. Schneider and Snyder defined organizational climate as “a summary perception which people have of (or about) an organization” (1975, 318). The climate literature focused on characteristics such as “trust, openness, credibility, accuracy, and frequent communication” (Grunig 1992, 540). Pincus and Rayfield broadened the concept of climate to the organizational level: “Frequently cited dimensions of organizational climate are organizational structure, individual responsibility, warmth or support, rewards and punishments, conflict resolution, performance standards, and organizational identity” (1989, 187). Generalizing on the climate literature, Grunig observed, “Researchers believed that climate was a characteristic of the organization, not of the individual—an ‘atmospheric condition’ in the organization” (1992, 540). These definitions of organizational climate are consistent with later views of organizational culture (Eisenberg and Riley 2000). Falcione, Sussman, and Herden (1987) reviewed the literature on organizational climate and noted that organizational climate accounts for only a modest portion of the variance in performance outcomes, including communication outcomes. Grunig and Grunig (2000) found that a participative organizational culture related to chief executive officers’ 40
Public Administration Review • January | February 2006
perceptions that public relations benefits strategic management. The correlation, however, was weak. Downs, Clampitt, and Pfeiffer (1988) surveyed a number of studies and concluded that internal communication tends to be more strongly related to interpersonal variables—trust, openness, and other components of organizational culture—than to external communication. When measuring organizational culture in American higher education, Zammuto and Krakower (1991) found that trust, morale, and leader credibility correlated negatively with hierarchical and rational organizational cultures and with conflict and scapegoating. They found significant relationships between dimensions of organizational culture and key characteristics of communication performance. On balance, despite some disagreement about the definition or elements of organizational culture, organizational culture that reflects an organization’s underlying values and orientation (e.g., task, change, or loyalty) is widely seen as setting the climate and tone for communication, particularly for internal and interpersonal communication. Therefore, we hypothesize the following: H3: Organizational culture has a significant relationship with communication performance that varies by the type of culture. Organizational Size and Communication Performance Organizational size, typically measured as the number of employees, can cut both ways in terms of communication performance. On one hand, communication becomes more challenging and more difficult in larger, more complex public agencies. On the other hand, larger organizations typically have greater resources, including expertise, personnel, and budget, devoted to communicating. Research has generally shown mixed results on the relationship between organizational size and communication effectiveness ( Jablin 1987). Larger size generally translates into more organizational levels. The potential filtering of extra levels of hierarchy has generally been considered to hinder communication accuracy and speed. Tullock (1965), Downs (1967), and Garnett (1992) have all noted the distorting effects of reporting through multiple organization layers. Downs (1967) uses Tullock’s work on hierarchy to illustrate how screening 50 percent of a message at each of seven hierarchical levels results loses 98.4 percent of the message quantity through condensation and filtering. In his study of the organizational culture of the U.S. State Department, Warwick (1975) found that its size and multiple levels had a distorting and slowing effect on internal and external communication.
Organizational size has the potential to increase communication performance if there is stability (Downs 1967), and the organizational slack is used to develop communication expertise and resources. Another perspective on size is offered by McPhee and Poole: “The presumption among theorists is that greater organizational size leads to more mechanistic organization, as the coordination burden overwhelms organizational processes” (2000, 506). Thus, greater size and more mechanistic culture tend to be more oriented toward routine internal reporting and less toward nonroutine and external communication. On balance, we believe that organizational size will lead to lower communication performance. Data, Measurement, and Methods As Garnett (1997) points out, assessing communication performance is difficult under the best of circumstances. An accepted approach to assessing communication performance is to rely on survey research methodologies to obtain key informant assessments that, although subjective, still have value (Dillman 2000; Jabine et al. 1984). The use of survey research has been well established for assessing internal communication (Grunig 1992; Holtzhausen 2002), external communication (Grunig and Grunig 1992), and interpersonal communication (Chelf et al. 2002). The data for this study were collected as part of Phase II of the National Administrative Studies Project (NASP-II) during 2002–03. Initiated in 1992, the National Administrative Studies Project is perhaps best described as an “invisible college” of scholars with a shared interest in furthering systematic empirical knowledge in public management (Crane 1972). Data collection in the first phase of the study (NASPI) was carried out by researchers at Syracuse University, the University of Denver, and Florida State University in 1992 and 1993 (see Pandey 2003 for more details). Nearly 30 publications in leading public management outlets have used the NASP-I data and have made significant theoretical and empirical contributions (e.g., Bozeman and Kingsley 1998; Bozeman and Rainey 1998; Pandey and Scott 2002; Pandey and Welch, 2005; Rainey, Pandey, and Bozeman 1995). The NASP-II study, carried out at Rutgers University, Campus at Camden, builds on the NASP-I objective of providing a solid empirical grounding for public management research but with a slight change in emphasis. NASP-I focused on advancing comparative empirical knowledge about public and private organizations, whereas NASP-II sought to better characterize and study the impact of policy and political context on public management. The theoretical population of interest for this study consisted of managers engaged in information-
management activities and working in state-level primary health and human service agencies in all 50 states and Washington, D.C. These agencies operate some of the most important health and social service programs. Just two of the programs operated by these agencies, Medicaid and the State Children’s Health Insurance Program, serve nearly 40 million beneficiaries and have total annual spending close to $200 billion (Hoffman, Klees, and Curtis 2001). Information management was broadly defined to include a range of key managerial roles, such as the top program administrator, managers of information system applications, managers in charge of evaluation and research, and managers dealing with public information and communication. The organizational structures of these agencies varied greatly. Although the top program administrator was the agency head in some instances, in most cases, the top program administrator was not the agency head and was identified as a top program administrator on the basis of holding overall operational responsibility for a specific program. The sampling frame was developed with the aid of the most widely used directory of human service agency managers, the American Public Human Services Association directory (APHSA 2001). Our survey aimed to be representative of human service agency managers for the set of organizational roles identified earlier, and therefore no attempt was made to stratify the sample based on factors such as the size of the state or the agency. The application of the study criteria resulted in a sampling frame comprising 570 managers from the 50 states and Washington, D.C. The average number of managers selected from each state was about 11, and they came from 83 different state agencies. These were large state agencies with a median size of 4,300 employees. Nearly 10 percent of the respondents came from organizations with fewer than 1,000 employees, 10 percent from organizations with 15,000 employees or more, and the remaining came from organizations ranging in size from 2,000 to 7,000 employees. Given the small size of the sampling frame, a decision was made to administer the survey to the entire sampling frame (i.e., conduct a census). A comparison of the geographic distribution of the sampling frame with the respondents showed no significant geographic under- or overrepresentation. The study response rate was approximately 53 percent, and responses were obtained from all 50 states and Washington, D.C. (see appendix 2 for more details). Dependent Variables Three dimensions of communication performance— interpersonal communication, external communication, and internal communication—were used in the study. (Details on the specific wording of each Exploring Public Sector Communication Performance
41
construct, as well as dependent and independent variables, are provided in appendix 1.) The construct of interpersonal communication performance focused on feedback that individuals received in carrying out their job responsibilities. It was measured with two items rated on a five-point scale derived from Stone (1976). The external communication performance construct rated the organization’s ability to communicate effectively with its publics, particularly the clients served and other stakeholder citizens. This construct consisted of four items, each measured on a five-point scale, adapted from Gianakis and Wang (2000). Finally, internal communication performance was measured using five questionnaire items, each rated on a five-point scale, written specifically for this study but drawing on the seminal work of Katz and Kahn (1966) relating to internal information flows and the specific purposes of downward, upward, and lateral flows. Independent Variables Goal clarity was measured using three items adapted from prior research, each rated on a four-point scale (Rainey 1983). Organizational size was measured in terms of the number of employees in the organization. This study used a comprehensive set of red tape measures focusing on many dimensions of an organization’s functioning. Two of these, a global measure and a measure of personnel red tape, are derived from prior research (Pandey and Scott 2002; Rainey 1983), and others on purchasing, communication, information systems, and budgeting were written specifically for this study. Items for other red tape dimensions written specifically for NASP-II were subjected to extensive peer review. The draft survey instrument was reviewed by 15 experts in public management and health policy. These experts were also provided with a “construct map” that related the constructs to specific questionnaire items. The expert comments were used to modify and refine the questionnaire items. In appendix 1, we present the questionnaire items used to measure these dimensions, together with Cronbach’s alpha, a measure of internal consistency. Measures for all dimensions except budgetary red tape show acceptable levels of internal consistency (DeVellis 1991). In light of the exploratory nature of the study, we retained the measure of budgetary red tape despite this weakness. In measuring organizational culture, we relied on a dimensional approach. The specific scheme for conceptualizing organizational culture was derived from the work of Quinn and Kimberly (1984) and Zammuto and Krakower (1991). Quinn and Kimberly (1984) suggest that it is best to think of organizational culture as a combination of different types of archetypal cultures rather than a “pure” type; Zammuto and Krakower (1991) call this the dimensional approach. The four culture types are group culture, 42
Public Administration Review • January | February 2006
developmental culture, hierarchical culture, and rational culture (Quinn and Kimberly 1984; Zammuto and Krakower 1991). Hierarchical culture is akin to the classic bureaucratic culture, which lays great emphasis on stability and control. Given that our study uses a number of red tape measures, which are likely to have significant conceptual overlap with hierarchical culture, we excluded this dimension from our model. The three culture dimensions used in the study are group, rational, and developmental. Group culture is people centered, emphasizing organizational flexibility and cohesion, and has human resource development as a key organizational goal. Both developmental and rational cultures are organization centered. However, although the rational culture emphasizes control and planning as key instrumentalities, developmental cultures emphasize flexibility and adaptability. Questionnaire items to measure each of these culture types were adapted from Zammuto and Krakower (1991) and are reproduced in appendix 1. Findings and Discussion As a first step, we present descriptive statistics on all of the study variables in table 1. The sample was made up of very large organizations with a mean employee strength of more than 6,000. These organizations had a high average score on goal clarity (mean = 8.9), although there was significant variability. Consistent with Zammuto and Krakower’s contention regarding the dimensional nature of organizational culture, the scores for each of three culture types were significantly greater than zero and displayed variability. Likewise, different measures of red tape exhibited good distributional characteristics. To test our hypotheses about communication performance, we estimated multiple regression models with
Table 1 Descriptive Statistics
Dependent Variables Interpersonal communication performance External communication performance Internal communication performance Independent variables Goal clarity Global measure of red tape Personnel red tape Communication red tape Purchasing red tape Information system red tape Budgetary red tape Rational culture Developmental culture Group culture Size
Mean (standard deviation) 6.56 (1.98) 16.77 (2.39) 16.57 (3.94) 8.89 (2.06) 6.42 (1.98) 15.38 (3.27) 8.83 (2.88) 10.62 (2.64) 9.30 (2.35) 11.37 (2.11) 6.93 (1.68) 8.89 (2.70) 9.80 (2.55) 6,028 (6,150)
goal clarity, red tape measures, organizational culture, and size as independent variables. The results of these models are presented in table 2. Support for the hypotheses was mixed. The first hypothesis, goal clarity, was supported for external and internal communication performance. The second hypothesis, red tape, had mixed support and only for specific kinds of red tape rather than the global (general) red tape. Similarly, there was mixed support for the third hypothesis, organizational culture, which varied by the type of culture and communication performance. Organizational size, our control variable, had no significant effect on interpersonal communication performance. Indeed, organizational size was not a significant predictor for any of the three dimensions of communication performance. This finding may reflect the fact that our sample was made up of large state health and human service agencies and perhaps over the range of variability in size present in the sample, size had little impact on communication performance.
communication performance and budgetary red tape increasing the interpersonal communication performance, thus contradicting the direction of influence specified in hypothesis 2. Although we are still exploring the nature of these relationships, at least part of the difference can be explained by the nature of their processes. Budgetary red tape often requires greater interaction among participants in the process in the form of clearances, meetings, public hearings, and the like, resulting in improved internal communication performance. Purchasing red tape is more likely to focus on restrictions and involves a smaller, more specialized communication loop. Purchasing as a management process tends to be more exclusive, with a narrower loop, whereas the budgeting process tends to be more inclusive, with a larger communication loop. The lesser influence of red tape on interpersonal communication may also be the result of the tendency of interpersonal communication to be lateral and even subformal or informal (Downs 1967; Garnett 1992). This could also be attributed to the way we operationalized interpersonal communication performance: A broader operationalization beyond the primarily personal feedback orientation might show a more robust relationship between the different dimensions of red tape and interpersonal communication.
As table 2 shows, the model for interpersonal communication performance is statistically significant and explains nearly 24 percent of the variability. Goal clarity did not have a significant association with interpersonal communication performance, suggesting that the clarity or ambiguity of organizational goals does not influence interpersonal communication performance. Indeed, interpersonal communication, especially subformal or informal, is often used to compensate for unclear or overly rigid goals.
Both developmental culture and group culture led to enhanced interpersonal communication performance. This is not surprising given that both of these cultural orientations (developmental and group) emphasize flexibility as opposed to control in internal organizational processes, encouraging participation as an end in itself or as a means to bring about desired changes. Therefore, the group and developmental dimensions of organizational culture support increased interpersonal communication.
Of the red tape measures, only purchasing red tape and budgeting red tape had statistically significant effects on interpersonal communication, with purchasing red tape lowering the interpersonal Table 2 Multiple Regression Results (Displaying Standardized Betas)
Dependent Variables
Independent Variables
Interpersonal communication performance
External communication performance
Internal communication performance
Goal clarity Global red tape Personnel red tape Communication red tape Purchasing red tape Information system red tape Budgetary red tape Rational culture Developmental culture Group culture Size Model F value Model significance level N Adjusted R2
.0371 .0183 –.0423 –.0927 –.1362** –.0711 .1454** –.0977 .2406*** .2118*** –.0278 8.50 < .0001 266 .2375
.1802** –.0224 –.0044 .0478 –.0643 –.0050 .0673 .1326* .0261 .1605** –.0325 4.47 < .0001 266 .1258
.2611**** .0226 –.0193 –.0893* –.0766 –.2543**** .0038 .1116** .1188* .1486** –.0319 22.04 < .0001 266 0.4662
**** p < .0001; *** p < .005; ** p < .05; *p < .10.
Exploring Public Sector Communication Performance
43
The model for external communication performance was statistically significant, but the amount of variation explained for this dependent variable was a mere 13 percent. The results provide mixed support for the hypotheses (H1 and H3 supported; no support for H2). Although goal clarity facilitates external communication, red tape dimensions do not have a statistically significant influence. Culture was a significant predictor of external communication performance: Both rational and group culture had a positive impact on external communication performance. External communication is important for public organizations and presents obvious challenges—challenges that have the potential to significantly alter organizational routines. Goal clarity and supportive organizational culture can reduce the perception of threats and challenges, thereby facilitating external communication performance. The model for internal communication performance was statistically significant and explained 47 percent of the variation (H1, H2, and H3 supported). Goal clarity had a positive influence and increased internal communication performance. All three of the culture types had a statistically significant and positive influence on internal communication performance. Red tape had a stronger influence on internal communication performance than interpersonal and external communication performance. Both communication red tape and information systems red tape had a significant and negative influence on internal communication performance. The greater influence of red tape on internal communication performance is understandable because most rules, regulations, and constraints focus on internal agency processes and dynamics rather than external processes and dynamics. This holds true despite the growing number of red tape dimensions affecting agency interaction with external stakeholders. Our findings are consistent with recent research that suggests public managers are not responsible for creating red tape; instead, public managers do their best to contend with the bureaucratic red tape inherent in different management systems in public organizations (Pandey, Kingsley, and Scott 2001; Pandey and Welch, 2005; Scott and Pandey 2005). Thus, our finding that internal communication performance is compromised by communication and information systems red tape, not by a generalized sense of red tape, further supports the position that public managers’ efforts are impeded by structural forces that are beyond their control. The consistently strong and positive influence of the three culture dimensions on the three types of communication performance seem to be in accord with arguments advanced by scholars who have reviewed 44
Public Administration Review • January | February 2006
the link between culture and communication (Downs, Clampitt, and Pfeiffer 1988; Guy 1992). The more organizational culture emphasis shifts from hierarchy and systems to individuals, the better it is from a communication perspective because the changed orientation makes it possible for individuals to provide or seek information from different communication channels. Our findings on the effect of culture reflected this: Specifically, the strong, consistent, and positive influence of group culture on all dimensions of communication is noteworthy in this regard. Group cultures are associated with a focus on people rather than the organization, flexibility rather than control, and they value employee cohesion and morale—conditions that, taken together, foster communication. Conclusion and Implications Although it is exploratory in nature, this is the first large-scale empirical study to directly examine public sector communication performance. Despite the obvious implications of communication for organizational performance, communication performance is understudied and, as a result, poorly understood. The reasons are not hard to fathom and include the performance predicament (Garnett 1997) and the fact that (for obvious reasons) the focus is on performance in and of itself (Holzer 1992). The often-repeated adage about the relationship between measurement and theory in social and behavioral sciences (e.g., Cone and Foster 1991) also applies to communication performance and organizational performance: Communication performance seems destined to be forever a bridesmaid, but never the bride. We believe that a focus on communication performance is justified not only because of its relative neglect, but also because it holds vital keys to improving organizational performance. We are not alone in holding this belief—Guy (1992) makes a persuasive case for the importance of communication to performance, suggesting that “productive work environments” owe much to clear and effective channels of communication. Before discussing the implications of this research, its limitations are worth noting. First, some of the measures used in the study, as indicated in appendix 1, display low internal consistency. Given the exploratory nature of our study and the fact that these measures are based on indicators used in prior research or draw on well-developed theoretical frameworks, we chose to use the measures in spite of low internal consistency. Indeed, significant findings, despite measurement weaknesses, provide indirect support to the strength of underlying theoretical models. Second, our measures probably tap into only a part of the content domain of three communication performance constructs used in the study and further construct development can be of value.
The empirical support for our exploratory model of communication performance is particularly strong for internal communication but not as strong for external and interpersonal communication. Taken together, our findings underscore the usefulness of the exploratory strategy we employ, a synthetic approach that combines distinctive aspects of public organizations (Rainey 2003; Rainey and Bozeman 2000; Rainey, Backoff, and Levine 1976) with insights from organizational communication literature (Downs, Clampitt, and Pfeiffer 1988; Grunig and Grunig 2000; Guy 1992; Zammuto and Krakower 1991) to develop a theoretical model of communication performance. The study findings also suggest that improving communication performance is not a one-shot affair, and sustained improvements can only be made on the basis of well-planned and well-executed interventions. Consider, for instance, the implications of the significance of goal clarity for effective communication. There are different ways of fostering organizational goal clarity—the public- and third-sector strategic planning approach advocated by Nutt and Backoff (1992) is likely to be successful in engendering both better communication performance and organizational performance. On the other hand, if mission or goal clarity is the product of groupthink or comparable behavior that favors loyalty over independence and limits adaptability, goal clarity can be counterproductive and may have a negative effect on organizational performance ( Janis 1982; ’t Hart and Kroon 1997; Garnett and Kouzmin 2003). Kotter and Heskett’s (1992) study of corporate culture underscores this point. They found that strong value consensus does not automatically produce superior performance unless adaptation and flexibility are also present. Our findings on the negative effects of red tape and the positive effect of nonhierarchical culture dimensions are in accord with Kotter and Heskett’s findings on the importance of adaptation and flexibility. It is also worth noting, as one reviewer pointed out, that the relationship between goal clarity and communication performance is likely bidirectional, and further exploration of this relationship may be worth the effort. The fact that specific dimensions of organizational red tape, rather than a generalized sense of organizational red tape, influence communication performance is worth noting. Especially noteworthy is the fact that information systems and communication red tape have significant and negative effects on internal communication performance. Quite likely, these factors also have a negative influence on overall agency performance. We conclude by noting the implications of our findings for improving public sector performance. Constraints on performance from red tape can be
overcome if other conditions are present in a public agency. Among these performance-enhancing conditions are organizational capacity, such as expertise and resources; clarity of mission and goals without the rigid consensus that restricts adaptability; and organizational cultures that are appropriate to the agency, its mission, and stakeholders. Public officials and executives can improve communication performance—and the overall performance of their agencies—by strategically developing these performance-enhancing conditions. External communication relates less strongly to these performanceenhancing conditions. Because of the greater complexity and uncertainty involved in communication with multiple stakeholders in increasingly turbulent environments, external communication appears to require other conditions and even greater effort on the part of public officials, executives, and managers. This extraordinary effort with external communication in an era of interorganizational networks, service-delivery sets, and hyper–interest advocacy are crucial to overcome the tendency of administrators to focus more on internal communication than external. Clearly, more research is needed to explore the relationships between organizational characteristics and communication performance and the effect of communication performance on overall organizational performance. Acknowledgments We thank the three anonymous PAR reviewers for making valuable suggestions. The data analyzed in the article were collected under the auspices of the National Administrative Studies Project, an effort supported in part by the Forum for Policy Research and Public Service at Rutgers University under a grant from the Robert Wood Johnson Foundation to the Center for State Health Policy, also at Rutgers. This support does not necessarily imply an endorsement of the analyses and opinions expressed in this article. References American Public Human Services Association (APHSA). 2001. Public Human Services Directory 2001–2002. Washington, DC: American Public Human Services Association. Baldwin, J. Norman. 1990. Perceptions of Public versus Private Sector Personnel and Informal Red Tape: Their Impact on Motivation. American Review of Public Administration 20(1): 7–28. Barnard, Chester I. 1938. The Functions of the Executive. Cambridge, MA: Harvard University Press. Bozeman, Barry. 1987. All Organizations Are Public. San Francisco: Jossey-Bass. ———. 1993. A Theory of Government “Red Tape.” Journal of Public Administration Research and Theory 3(3): 273–303. ———. 2000. Bureaucracy and Red Tape. Upper Saddle River, NJ: Prentice Hall. Exploring Public Sector Communication Performance
45
Bozeman, Barry, and Gordon Kingsley. 1998. Risk
Rule Dysfunction Alienate Managers? Journal of
Culture in Public and Private Organizations.
Public Administration Research and Theory 15(1):
Public Administration Review 58(2): 109–18. Bozeman, Barry, and Hal G. Rainey. 1998. Organizational Rules and Bureaucratic Personality. Ameri-
Promoting the Utilization of Performance Mea-
can Journal of Political Science 42(1): 163–89.
sures: An Empirical Study of Factors Affecting
Bozeman, Barry, Pamela Reed, and Patrick Scott. 1992. Red Tape and Task Delays in Public and Private Organizations. Administration & Society 24(3): 290–322. Brown, David. 2002. Agency with Most Need Didn’t Get Anthrax Data; CDC Unaware of Canadian Study before Attacks. Washington Post, November 2. Brudney, Jeffrey, Ted Hebert, and Deil Wright. 1999. Reinventing Government in the American States: Measuring and Explaining Administrative Reform.
Adoption and Implementation. Public Administration Review 61(6): 693–708. DeVellis, Robert F. 1991. Scale Development: Theory and Applications. Newbury Park, CA: Sage Publications. Dillman, Don A. 2000. Mail and Internet Surveys: The Tailored Design Method. 2nd ed. New York: Wiley. Downs, Anthony. 1967. Inside Bureaucracy. Boston: Little, Brown. Downs, Calvin W., Phillip G. Clampitt, and Angela
Public Administration Review 59(1): 19–30.
L. Pfeiffer. 1988. Communication and Organiza-
Buchanan, Bruce. 1975. Red Tape and the Service
tional Outcomes. In The Handbook of Organiza-
Ethic: Some Unexpected Differences between
tional Communication, edited by Gerald M.
Public and Private Managers. Administration &
Goldhaber and George A. Barnett, 171–211.
Society 6(4): 423–44. Cannon, Lou. 1997. Official Negligence: How Rodney King and the Riots Changed Los Angeles and the LAPD. New York: Random House. Charles, Michael T. 1989. The Last Flight of the Space Shuttle Challenger. In Coping With Crisis: The Management of Disasters, Riots, and Terrorism,
Norward, NJ: Ablex. Durning, Daniel W., and Richard W. Campbell. 1997. Communicating in Policy Analysis and Evaluation. In The Handbook of Administrative Communication, edited by James L. Garnett and Alexander Kouzmin, 343–79. New York: Marcel Dekker. Eisenberg, Eric M., and Patricia Riley. 2000. Organi-
edited by Uriel Rosenthal, Michael T. Charles, and
zational Culture. In The New Handbook of Organi-
Paul ’t Hart, 141–68. Springfield, IL: Charles C.
zational Communication: Advances in Theory,
Thomas.
Research, and Methods, edited by Frederic M. Jablin
Chelf, Jane H., Patricia Agre, Alan Axelrod, Lydia Cheney, Diane D. Cole, Kathryn Conrad, Sally Hooper, Irene Liu, Annette Mercurio, Karen
and Linda L. Putnam, 291–322. Thousand Oaks, CA: Sage Publications. Falcione, Raymond L., Lyle Sussman, and Richard P.
Stepan, Louise Villejo, and Carolyn Weaver. 2002.
Herden. 1987. Communication Climate in Orga-
Cancer-Related Patient Education: An Overview of
nizations. In The Handbook of Organizational
the Last Decade of Evaluation and Research.
Communication: An Interdisciplinary Perspective,
Oncology Nursing Forum 28(7): 1139–47.
edited by Frederic M. Jablin, Linda L. Putnam,
Cheney, George, and Lars T. Christensen. 2000.
Karlene H. Roberts, and Lyman W. Porter, 195–
Linkages Between Internal and External Communication. In The New Handbook of Organizational Communication: Advances in Theory, Research, and Methods, edited by Frederic M. Jablin and Linda L. Putnam, 231–69. Thousand Oaks, CA: Sage Publications. Chun, Young H., and Hal G. Rainey. 2003. Goal
227. Thousand Oaks, CA: Sage Publications. Gardner, John. 1990. On Leadership. New York: Free Press. Garnett, James L. 1992. Communicating for Results in Government: A Strategic Approach for Public Managers. San Francisco: Jossey-Bass. ———. 1997. Administrative Communication:
Ambiguity in Federal Agencies. Paper presented at
Domains, Threats, and Legitimacy. In The Hand-
the Seventh National Public Management Research
book of Administrative Communication, edited by
Conference, October 9–11, Washington, DC.
James L. Garnett and Alexander Kouzmin,
Cone, John D., and Sharon L. Foster. 1991. Training in Measurement: Always the Bridesmaid. American Psychologist 46(6): 653–54. Crane, Diana. 1972. Invisible Colleges: Diffusion of Knowledge in Scientific Communities. Chicago: University of Chicago Press. Dahl, Robert A., and Charles E. Lindblom. 1953.
3–20. New York: Marcel Dekker. Garnett, James L., and Alexander Kouzmin. 2003. Unmasking Boundaries and Impacts among Crisis Communication Lenses. Paper presented at the Public Administration Theory Network Conference, June 19–21, Anchorage, AK. Gianakis, Gerasimos, and XiaoHu Wang. 2000.
Politics, Economics and Welfare. New York:
Decentralization of the Purchasing Function in
HarperCollins.
Municipal Government: A National Survey.
DeHart-Davis, Leisha, and Sanjay K. Pandey. 2005. Red Tape and Public Employees: Does Perceived 46
133–49. de Lancer Julnes, Patria, and Marc Holzer. 2001.
Public Administration Review • January | February 2006
Journal of Public Budgeting, Accounting and Financial Management 12(3): 421–40.
Gold, Kenneth A. 1982. Managing for Success: A Comparison of the Public and Private Sectors.
Interdisciplinary Perspective. Newbury Park, CA: Sage Publications.
Public Administration Review 42(6): 568–75.
Janis, Irving L. 1982. Groupthink: Psychological Studies
Grunig, James E. 1992. Symmetrical Systems of
of Policy Decisions and Fiascoes. 2nd rev. ed. Boston:
Internal Communication. In Excellence in Public Relations and Communication Management, edited by James E. Grunig, 531–76. Hillsdale, NY: Lawrence Erlbaum. ———. 1997. Public Relations Management in
Houghton Mifflin. Katz, Daniel, and Robert L. Kahn. 1966. The Social Psychology of Organizations. New York: Wiley. Kettl, Donald F. 2004. System under Stress: Homeland
Government and Business. In The Handbook of
Security and American Politics. Washington, DC:
Administrative Communication, edited by James L.
CQ Press.
Garnett and Alexander Kouzmin, 241–84. New York: Marcel Dekker. Grunig, James E., and Larissa A. Grunig. 1992. Models of Public Relations and Communication.
Khademian, Anne M. 2002. Working with Culture: The Way the Job Gets Done in Public Programs. Washington, DC: CQ Press. Korac-Kakabadse, Nada, and Alexander Kouzmin.
In Excellence in Public Relations and Communica-
1997. From “Captains of the Ship” to “Architects
tion Management, edited by James E. Grunig, 285–
of Organizational Arks”: Communication, Global-
325. Hillsdale, NY: Lawrence Erlbaum.
ization, and the “Withering Away” of Leadership
———. 2000. Public Relations in Strategic Manage-
Steering. In The Handbook of Administrative
ment and Strategic Management of Public Rela-
Communication, edited by James L. Garnett and
tions: Theory and Evidence from the IABC
Alexander Kouzmin, 681–716. New York: Marcel
Excellence Project. Journalism Studies 1(2): 303–21. Guy, Mary E. 1992. Productive Work Environments. In The Public Productivity Handbook, edited by Marc Holzer, 321–33. New York: Marcel Dekker. Hoffman, Earl D., Barbara S. Klees, and Catherine A. Curtis. 2001. Overview of the Medicare and Medicaid Programs. Health Care Financing Review 23(1): 1–19. Holtzhausen, Derina R. 2002. The Effects of Work-
Dekker. Kotter, John P., and James L. Heskett. 1992. Corporate Culture and Performance. New York: Free Press. Lame, Mark. 1997. Communicating in the Innovation Process: Issues and Guidelines. In The Handbook of Administrative Communication, edited by James L. Garnett and Alexander Kouzmin, 187– 202. New York: Marcel Dekker. Lowenhardt, John, and Ger P. van den Berg. 1989. Disaster at the Chernobyl Nuclear Power Plant: A
place Democracy on Employee Communication
Study of Crisis Decision Making in the Soviet
Behavior: Implications for Competitive Advantage.
Union. In Coping with Crisis: The Management of
Competitiveness Review 12(2): 30–48.
Disasters, Riots, and Terrorism, edited by Uriel
Holzer, Marc, ed. 1992. The Public Productivity Handbook. New York: Marcel Dekker. Huseman, Richard C., and E. W. Miles. 1988. Organizational Communication in the Information Age: Implications of Computer-Based Systems. Journal of Management 14(2): 181–204. Jabine, Thomas B., Miron L. Straf, Judith M. Tanor,
Rosenthal, Michael T. Charles, and Paul ’t Hart, 37–65. Springfield, IL: Charles C. Thomas. Majone, Giandomenico. 1989. Evidence, Argument, and Persuasion in the Policy Process. New Haven, CT: Yale University Press. McPhee, Robert D., and Marshall S. Poole. 2000. Organizational Structures and Configurations. In The New Handbook of Organizational Communication:
and Roger Tourangeau, eds. 1984. Cognitive Aspects
Advances in Theory, Research, and Methods, edited by
of Survey Methodology: Building a Bridge between
Frederic M. Jablin and Linda L. Putnam, 503–43.
Disciplines. Washington, DC: National Academy Press. Jablin, Frederic M. 1987. Formal Organization Structure. In The Handbook of Organizational
Thousand Oaks, CA: Sage Publications. McPhee, Robert D., and Pamela Zaug. 2001. Organizational Theory, Organizational Communication, Organizational Knowledge, and Problematic
Communication: An Interdisciplinary Perspective,
Integration. Journal of Communication 51(3):
edited by Frederic M. Jablin, Linda L. Putnam,
574–91.
Karlene H. Roberts, and Lyman W. Porter, 389– 419. Newbury Park, CA: Sage Publications. Jablin, Frederic M., and Linda L. Putnam, eds. 2000. The New Handbook of Organizational Communication: Advances in Theory, Research, and Methods. Thousand Oaks, CA: Sage Publications. Jablin, Frederic M., Linda L. Putnam, Karlene H.
Medvedev, Gregorii. 1991. The Truth about Chernobyl. New York: Basic Books. Meltsner, Arnold J. 1976. Policy Analysts in the Bureaucracy. Berkeley: University of California Press. Merton, Robert K. 1968. Social Theory and Social Structure. New York: Free Press. Meyers, Marcia K., Norma Riccucci, and Irene Lurie.
Roberts, and Lyman W. Porter, eds. 1987. The
2001. Achieving Goal Congruence in Complex
Handbook of Organizational Communication: An
Environments: The Case of Welfare Reform. Exploring Public Sector Communication Performance
47
Journal of Public Administration Research and Theory 11(2): 165–201. Miller, Abraham H. 2001. The Los Angeles Riots: A
Organizational Communication and Job Satisfaction: A Metaresearch Perspective. In
Study in Crisis Paralysis. Journal of Contingencies
Progress in Communication Sciences, edited by
and Crisis Management 9(4): 189–99.
Brenda Dervin and Melvin J. Voigt, 183–208.
Miller, Danny. 1987. Strategy Making and Structure: Analysis and Implications for Performance. Academy of Management Journal 30(1): 7–32. Nutt, Paul C., and Robert W. Backoff. 1992. Strategic Management of Public and Third-Sector Organizations: A Handbook for Leaders. San Francisco: Jossey-Bass. Osborne, David, and Ted Gaebler. 1992. Reinventing Government. Reading, MA: Addison-Wesley. Pandey, Sanjay K. 1995. Managerial Perceptions of Red Tape. Unpublished PhD dissertation, Syracuse University. ———. 2003. National Administrative Studies Project (NASP-II): A National Survey of Managers in State Health and Human Services Agencies. Camden, NJ: Rutgers University. Pandey, Sanjay K., and Gordon A. Kingsley. 2000. Examining Red Tape in Public and Private Organizations: Alternative Explanations from a Social
Norwood, NJ: Ablex. Quinn, Robert E., and John R. Kimberly. 1984. Paradox, Planning, and Perseverance: Guidelines for Managerial Practice. In Managing Organizational Translations, edited by John R. Kimberly and Robert E. Quinn, 295–313. Homewood, IL: Dow Jones/Irwin. Rainey, Hal G. 1983. Public Agencies and Private Firms: Incentive Structures, Goals and Individual Roles. Administration & Society 15(3): 207–42. ———. 1993. A Theory of Goal Ambiguity in Public Organizations. In Research in Public Administration, vol. 2, edited by James L. Perry, 121–66. Greenwich, CT: JAI Press. ———. 2003. Understanding and Managing Public Organizations. 3rd ed. San Francisco: Jossey-Bass. Rainey, Hal G., and Barry Bozeman. 2000. Compar-
Psychological Model. Journal of Public Administra-
ing Public and Private Organizations: Empirical
tion Research and Theory 10(4): 779–99.
Research and the Power of A Priori. Journal of
Pandey, Sanjay K., and Patrick G. Scott. 2002. Red Tape: A Review and Assessment of Concepts and Measures. Journal of Public Administration Research and Theory 12(4):553–80. Pandey, Sanjay K. and Eric W. Welch. (2005) Beyond Stereotypes: A Multistage Model of Managerial Perceptions of Red Tape. Administration & Socciety 37(5): 542–575. Pandey, Sanjay K., David H. Coursey, and Donald P. Moynihan. 2004. Management Capacity and Organizational Performance: Can Organizational
Public Administration Research and Theory 10(2): 447–69. Rainey, Hal G., Robert W. Backoff, and Charles L. Levine. 1976. Comparing Public and Private Organizations. Public Administration Review 36(2): 233–46. Rainey, Hal G., Sanjay K. Pandey, and Barry Bozeman. 1995. Research Note: Public and Private Managers’ Perceptions of Red Tape. Public Administration Review 55(6): 567–74. Redding, William C. 1979. Organizational Commu-
Culture Trump Bureaucratic Red Tape? Paper
nication Theory and Ideology: An Overview. In
prepared for the Annual Meeting of the Academy
Communication Yearbook 3, edited by Daniel
of Management, August 6–10, New Orleans, LA. Pandey, Sanjay K., Gordon A. Kingsley, and Patrick G. Scott 2001. Coping with Red Tape: Does Public Service Motivation Separate the Victor from the Vanquished? Paper presented at the Sixth National Public Management Research Conference, October 18–20, Bloomington, IN. Pearson, C. A. L. 1992. Autonomous Workgroups: An Evaluation at an Industrial Site. Human Relations 45(9): 905–36. Perry, James L., and Hal G. Rainey. 1988. The PublicPrivate Distinction in Organization Theory: A Critique and Research Strategy. Academy of Management Review 13(2): 182–201. Pijnenburg, Bert, and Menno van Duin. 1991. The Zeebrugge Ferry Disaster: Elements of a Communication and Information Processes Scenario. In Crisis Management and Decision Making: Simula-
48
Pincus, J. David, and Robert E. Rayfield. 1989.
Nimmo, 309–41. New Brunswick, NJ: Transaction. Rogers, Everett M., and F. Floyd Shoemaker. 1971. Communication of Innovations: A Cross-Cultural Approach. New York: Free Press. Romzek, Barbara S., and Melvin J. Dubnick. 1987. Accountability in the Public Sector: Lessons from the Challenger Tragedy. Public Administration Review 47(3): 227–38. Schneider, Benjamin, and Robert A. Snyder. 1975. Some Relationships between Job Satisfaction and Organizational Climate. Journal of Applied Psychology 60(3): 318–28. Scott, Patrick G., and Sanjay K. Pandey. 2000. The Influence of Red Tape on Bureaucratic Behavior: An Experimental Simulation. Journal of Policy Analysis and Management 19(4): 615–33. ———. 2005. Red Tape and Public Service Motivation:
tion-Oriented Scenarios, edited by Uriel Rosenthal
Findings from a National Survey of Managers in
and Bert Pijnenburg, 45–73. Dordrecht,
State Health and Human Services Agencies. Review
Netherlands: Kluwer.
of Public Personnel Administration 25(2): 155–80.
Public Administration Review • January | February 2006
Shrader, C. B., J. R. Lincoln, and A. N. Hoffman. 1989. The Network Structures of Organizations: Effects of Task Contingencies and Distributional Form. Human Relations 42(1): 43–66. Siegel, Marc. 2002. The Anthrax Fumble. The Nation, March 18. http://www.thenation.com/ doc/20020318/siegel [accessed September 22, 2005]. Simon, Herbert A. 1964. On the Concept of Organizational Goal. Administrative Science Quarterly 9(1): 1–22. Simon, Herbert A., Donald W. Smithburg, and Victor A. Thompson. 1950. Public Administration. New York: Alfred A. Knopf. Stone, Eugene F. 1976. The Moderating Effect of Work-Related Values on the Job Scope-Job Satisfaction Relationship. Organizational Behavior and Human Performance 15(2): 147–67. ’t Hart, Paul, and Marceline B.R. Kroon. 1997. Groupthink in Government: Pathologies of SmallGroup Decision Making. In The Handbook of Administrative Communication, edited by James L. Garnett and Alexander Kouzmin, 101–39. New York: Marcel Dekker. Thompson, Frank J., and Norma M. Riccucci. 1998. Reinventing Government. Annual Review of Political Science 1: 231–57.
Tullock, Gordon. 1965. The Politics of Bureaucracy. Washington, DC: Public Affairs Press. Warwick, Donald, in collaboration with Marvin Meade and Theodore Reed. 1975. A Theory of Public Bureaucracy: Politics, Personality, and Organization in the State Department. Cambridge, MA: Harvard University Press. Wilson, James Q. 1989. Bureaucracy. New York: Basic Books. Wilson, R. 1996. More on Chernobyl, Ten Years Later. Environment 38(5): 3–5. Wright, Bradley E. 2004. The Role of Work Context in Work Motivation: A Public Sector Application of Goal and Social Cognitive Theories. Journal of Public Administration Research and Theory 14(1): 59–78. Yammamarino, F. J., and T. N. Naughton. 1988. Time Spent Communicating: A Multiple Level of Analysis Approach. Human Relations 41(9): 655–76. Yardley, J. 2002. Traces of Terror: The Agent; Critic Is Described as Scrupulous and Determined. New York Times, May 25. Zammuto, Raymond F., and Jack Y. Krakower 1991. Quantitative and Qualitative Studies of Organizational Culture. Research in Organizational Change and Development 5(2): 83–114.
Appendix 1 Operational Definitions of Study Variables Model of Communication Performance: Variables, Expected Relationships, and Measurement Details Measure Dependent variables Interpersonal communication performance (Cronbach’s alpha = 0.60)
External communication performance (Cronbach’s alpha = 0.72)
Internal communication performance (Cronbach’s alpha = 0.78)
Independent variables Goal clarity (+) (Cronbach’s alpha = 0.80)
Question Wording and Scaling
Summative index based on ratings of following items (1 = strongly disagree, 5 = strongly agree): I receive useful evaluations of my strengths and weaknesses at work. The only time I hear about my performance is when something goes wrong (reversed). Summative index based on ratings of following items (1 = strongly disagree, 5 = strongly agree): Our agency can provide services the public needs. Our agency can satisfy public needs. Our agency can provide high-quality public service. Our agency can reduce criticism from citizens and clients. Summative index based on ratings of following items (1 = strongly disagree, 5 = strongly agree): Downward communication of task performance directives and instructions is adequate. Downward communication about the agency’s strategic direction is adequate. Downward communication about feedback on work performance is adequate. Upward communication about problems that need attention is adequate. Lateral communication giving emotional support to peers is adequate. Summative index based on ratings of following items (1 = strongly disagree, 4 = strongly agree): This organization’s mission is clear to almost everyone who works here. It is easy to explain the goals of this organization to outsiders. This organization has clearly defined goals.
Exploring Public Sector Communication Performance
49
Appendix 1, Continued Measure
Question Wording and Scaling
Global red tape (–)
Respondents were asked to rate the following item on a 0–10 scale, with 10 indicating the highest level of red tape: If red tape is defined as burdensome administrative rules and procedures that have negative effects on the organization’s performance, please assess the level of red tape in your organization. Summative index based on ratings of following items (1 = strongly disagree, 5 = strongly agree): Even if a manager is a poor performer, formal rules make it hard to remove him or her from the organization. The rules governing promotion make it hard for a good manager to move up faster than a poor one. The formal pay structures and rules make it hard to reward a good manager with higher pay here. The personnel rules and procedures that govern my organization make it easier for superiors to reward subordinates for good performance (reversed). Top managers in this agency are allowed to communicate freely with reporters (reversed). Communication within my agency is restricted by policies and procedures. Communication with other government agencies is restricted by policies and procedures. Summative index based on the following statements (1 = strongly disagree, 5 = strongly agree): The rules governing purchasing and procurement in my organization make it easy for managers to purchase goods and services (reversed). Due to standard procedures, procurement is based more on the vendor’s ability to comply with rules than on the quality of goods and services. The rules governing procurement make it hard to expedite purchase of goods and services for a critical project. Summative index based on the following statements (1 = strongly disagree, 5 = strongly agree):
Personnel red tape (–) (Cronbach’s alpha = 0.69)
Communication red tape (–) (Cronbach’s alpha = 0.61)
Purchasing red tape (–) (Cronbach’s alpha = 0.67)
Information systems red tape (–) (Cronbach’s alpha = 0.68)
Rules and procedures on preparation of information system reports ensure that managers receive timely information (reversed). Procedural requirements for information system requests make it difficult for managers to obtain relevant information. Budgetary red tape (–) (Cronbach’s alpha = 0.45)
Rational culture (Cronbach’s alpha = 0.59)
Developmental culture (Cronbach’s alpha = 0.73)
Group culture (Cronbach’s alpha = 0.69)
50
Public Administration Review • January | February 2006
Summative index based on the following statements (1 = strongly disagree, 5 = strongly agree): Budgetary rules and procedures limit manager’s ability to reprogram funds in accordance with agency mission. Budgeting policies and procedures are effective in ensuring that agency funds are used for intended purposes only. The budgeting rules and procedures limit manager’s ability to deal with unexpected program/project cost overruns. Summative index based on the following statements (1 = strongly disagree, 5 = strongly agree): The glue that holds my agency together is the emphasis on task and goal accomplishment. A production orientation is commonly shared. My agency emphasizes competitive actions and achievement. Measurable goals are important. Summative index based on the following statements (1 = strongly disagree, 5 = strongly agree): My agency is a very dynamic and entrepreneurial place. People are willing to stick their necks out and take risks. The glue that holds my agency together is a commitment to innovation and development. There is an emphasis on being first. My agency emphasizes growth and acquiring new resources. Readiness to meet new challenges is important. Summative index based on the following statements (1 = strongly disagree, 5 = strongly agree): My agency is a very personal place. It is like an extended family. People seem to share a lot of themselves. The glue that holds my agency together is loyalty and tradition. Commitment to this agency runs high. My agency emphasizes human resources. High cohesion and morale in the agency are important.
Appendix 2 Data-Collection Procedures for the National Administrative Studies Project (NASP-II) The study protocol was reviewed and approved by the Institutional Review Board of Rutgers University. Every effort, within reason, was made to encourage managers in the sampling frame to complete the survey. However, with each contact, respondents were advised of the voluntary nature of the study and informed that although the researchers greatly appreciated their participation in the study, managers could choose not to participate. In accordance with good survey research practice, we honored respondents’ wishes and did not direct additional follow-up efforts at subjects who expressed a wish not to participate in the study. As with most survey research projects, minimizing nonresponse, both to the survey and to specific questionnaire items, was a primary goal of survey administration. We employed Dillman’s (2000) comprehensive tailored design method approach to maximizing the response rate, which comprises the following elements: a questionnaire with well-designed content; a survey questionnaire formatted in accordance with the latest advances in cognitive research; multiple personalized contacts, each accompanied by a carefully crafted message to encourage the respondent to complete the survey questionnaire; the use of real stamps on return envelopes; the use of features such as a prenotice letter, fax message, phone calls at key points in the survey administration; and the use of special delivery (combination of two-day delivery by Airborne Express and U.S. Postal Service Priority Mail). The data-collection phase of the study began in the fall of 2002 and concluded in the winter of 2003. First, respondents were sent a prenotice letter informing them about the study and requesting their cooperation in completing a questionnaire to be mailed later. Approximately a week after the initial alert letter, the survey questionnaire was mailed to the respondents. The cover letter accompanying the survey questionnaire outlined the study’s objectives, indicated the voluntary nature of the study, requested participation, and provided contact details about the project director for further information needs and clarification. About 10 days later, a combination thank you and reminder postcard was sent to all respondents, thanking those who had responded and encouraging those who had not responded to do so as soon as possible. Nearly a month after the mailing of this postcard, a new cover letter and replacement survey were sent to nonrespondents. The cover letter emphasized that it was important for everyone to respond (unless for some reason the respondent chose not to respond). The final step in the survey administration took place about two months later, when nonrespondents were sent a new cover letter and a second replacement survey with a request to complete the survey. This final mailing pointed out that this was the last opportunity for the respondents to complete the survey questionnaire and used a combination of two-day delivery by an express carrier and U.S. Postal Service Priority Mail. Based on information gathered during this period, the size of the sampling frame was reduced from 570 to 518. Although the APHSA directory is the best available source of information on the sampling frame, the information in the directory at the time of publication is a year old. The survey was administered several months after the publication of the directory. This was reflected in the principal reason for deletion from the sampling frame—managers having left the organization before the survey administration began. Other reasons for deletion from the sampling frame were retirement and death. By the time the survey administration concluded in the winter of 2003, a total of 274 responses had been received. Thus, the response rate for the study was approximately 53 percent.
Exploring Public Sector Communication Performance
51