“The original paper is available at journals.sagepub.com/home/oag”
Exploring relationships between rubber productivity and R&D in Malaysia Outlook on Agriculture 2017, Vol. 46(1) 28–35. The Author(s) 2017 Reprints and permission: sagepub.co.uk/journalsPermissions.nav DOI: 10.1177/0030727016689731 journals.sagepub.com/home/oag
Ibragimov Abdulla1 and Fatimah Mohamed Arshad Abstract In recent decades, the Malaysian rubber sector has developed from a supplier of raw materials to a rubber-based manufacturing industry producing export products such as gloves and tyres. In contrast, the upstream rubber sector has experienced a declining trend in both plantation area and production capacity. In 2015, almost 95% of rubber producers were smallholders who depended on plantations as their main source of income. Despite government efforts to boost growth in the industry, the area and productivity have continued to decline. This study attempts to examine the structural factors that led to a decline in rubber area and natural rubber production and proposes strategies to enhance productivity and returns for smallholders. A system dynamics approach was used to capture the feedback relationships between variables in the rubber production system as well as the temporal lags and non-linearities. The findings suggest that gradual research and development funding for development of high-yielding clones holds major promise for yield improvement and increased income for smallholders.
Keywords plantation area; production capacity; income; smallholders; system dynamics
Introduction The rubber tree (Hevea brasiliensis) was brought into Malaysia from South America in the 19th century by British scientists and is currently grown in many Asian countries (Fox and Castella, 2013; Nyaka Ngobisa, et al., 2013). Since then, the industry has developed through the years and became the second major commodity product in Malaysia after palm oil and was considered to be a crop in focus in the First (1956–1960) and Second Malaysia Plans (1961–1965). In the 1960s, Malaysia was one of the world’s largest natural rubber producers. However, by 2014, Malaysia contributed only about 8% to world production and was ranked third globally. Currently, the largest rubber producing countries are Thailand, Indonesia, Malaysia, Vietnam, India and China which collectively account for 90% of world production (Fox and Castella, 2013). Rubber is primarily exported to China, Germany, United States and Iran to be processed to produce vehicle tyres and gloves. One of the main structural modifications in the Malaysia rubber industry was the expansion into local processing of value-added products. Nevertheless, the plantation area under rubber has declined since the 1980s in accordance with the diversification programme driven by unfavourable rubber prices. The decline in area resulted in a corresponding fall in rubber production which led to the failure of several rubber-based factories. Moreover, as the country’s economic policy shifted from primary production to export-oriented manufacturing, this structural modernization had a major impact on the rubber industry and wider agricultural sector. The industry contributes to the country’s gross domestic
product (GDP), export earnings as well as employment. In 2010, the export value of rubber and rubber products was valued at RM25 billion, representing 4% of the total export value. In the same year, the share of the industry in GDP was 1.4% with 10,813 workers engaged in the sector. Malaysia also plays a significant role in the world rubber market, despite the fact that its contribution is declining. In 1980, Malaysia was the dominant producer of rubber glob-ally, accounting for 41% of total world production, followed by Indonesia and Thailand with 27% and 12%, respectively (FAO, 1989). In 1980, Malaysia was also the dominant 1
Corresponding author:
Ibragimov Abdulla, Institute of Agricultural and Food Policy Studies, Universiti Putra Malaysia, Serdang, Selangor 43400, Malaysia. Email:
[email protected]
“The original paper is available at journals.sagepub.com/home/oag” exporter of rubber in the global market with 48% of world production, followed by Indonesia and Thailand with 31% and 14%, respectively (FAO, 1989). By 2010, it accounted for only 9% of world production and was the third largest producer, followed by Thailand and Indonesia with 30% and 28%, respectively. This study focuses on understanding the dramatic changes undergone by the upstream sector and proposes a model based on a system dynamics methodology to
provide new knowledge on the decline but also to help designing a more sustainable rubber production sector in Malaysia.
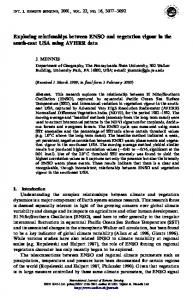
Historical perspective of the rubber industry In 1980, the area under cultivation consisted of more than 2 million ha, with estate plantations accounting for 25% of the total area and smallholder plantations the remainder (75%) (Figure 1). By 2010, the total rubber plantation area had decreased to 1 million ha with an average annual decrease rate of 2%. Currently, smallholders account for 94% of the total rubber area with only 6% under estate plantations. This decline in area arose from conversion of some rubber areas to other activities and the rising cost of labour which constitutes the largest fraction of production cost. 2,500
Planted Area ('000 ha)
2,000 1,500 1,000 500
Total
Estate
2010
2008
2006
2004
2002
2000
1998
1996
1994
1992
1990
1988
1986
1984
1982
1980
0
Smallholder
Figure 1. Planted area of natural rubber under estates and smallholdings in Malaysia (1980-2010) (‘000 ha). Source: MRB (2011). Figure 2 illustrates the trends in production of rubber in Malaysia between 1980 and 2010. In 1980, rubber production was 1.5 million t, of which 61% or 592,000 t came from estates while production from smallholders accounted for 39% or 933,000 t. Rubber production from estates has gradually declined and fell to 56,000 t in 2010, while production from smallholders reached 883,000 t. Changes in the production pattern are also attributed to the long season of yearly wintering followed by unexpected rains that limited tapping (Dove, 1993; FAO, 1989). Between 1990 and 1999, production shrank steadily to its record minimum in 1999; this was principally due to the downtrend in world prices alongside a surge in efforts to diversify into more lucrative cropping. Despite the continuous reduction in plantation area, positive growth was achieved between 2000 and 2006 mainly by the smallholder sector through improvements in crop productivity (t/ha). 2
Production ('million tonnes)
1.6 1.2 0.8 0.4
Total
Estate
2010
2008
2006
2004
2002
2000
1998
1996
1994
1992
1990
1988
1986
1984
1982
1980
0
Smallholder
Figure 1. Natural rubber production under estates and smallholdings in Malaysia (1980-2010) (‘000 tonnes). Source: MRB (2011).
“The original paper is available at journals.sagepub.com/home/oag” In 2009, the average national yield was 1.45 t/ha in contrast with 1.76 t/ha, 1.7 t/ha and 0.9 t/ha by India, Thailand and Indonesia, respectively (ANRPC, 2011). The annual yield in the estates was about 10–45% higher than smallholder productivity by 2010 (Figure 3). In 2010, the smallholder sector achieved an average productivity of about 1.47 t/ha while the estate sector recorded about 1.62 t/ha, which was much lower than the maximum reported yield (3.0 t/ha) (Kadir, 1994). The lower yield in the smallholder sector was largely due to lack of technology transfer, poor farm level management and practices and utilization of low-yielding breeds (Manivong and Cramb, 2008). The higher yield in the estate sector showed was opportunity for further advancement in 1,800
Yield (kg/ha/year)
1,600 1,400 1,200 1,000 800
2010
2008
2006
2004
2002
2000
1998
1996
1994
1992
1990
1988
1986
1984
1982
1980
600 National Estate Smallholder Figure 2. Natural rubber yield in Malaysia (1980-2010) (‘000 t). Source: MRB (2011). productivity of the smallholder sector through better management, utilizing high-yielding breeds and uptake of better technology (Lawrence, 1996; Mohammad and Sarjiman, 2007). After a slight downturn in 2001, prices of rubber (given as free on board prices of standard Malaysian rubber grade SMR20) started to grow at an average rate of about 21% over the next 4 years. In 2007 and 2008, prices continued to rise albeit it more slowly (Table 1). Prices then fell in
2009 following the downward trend in crude oil prices, but increased dramatically in 2010 to record a 10-year peak; this increase in rubber price was caused by a steady supply and growing demand, notably from China. Table 1. Natural rubber prices (cent/kg) between 2000 and 2010. a Year 2000 2001 2002 2003 2004 2005 2006 2007 2008 2009 2010
Bulk Latex1 202.57 170.14 207.1 287.35 330.67 382.09 511.01 512.51 570.91 447.52 743.36
Cup lumps2 170.12 145.52 226.74 286.55 355.22 424.49 600.72 639.17 689.11 515.23 919.64
SMR203 242.52 205.56 285.98 378.97 461.93 523.07 710.92 734.06 831.37 637.36 1,058.08
DRC: dry rubber content; SMR: Standard Malaysian Rubber grade 20; FOB: free on board. aSource: MRB (2011). b60% DRC. c100% DRC.
Challenges and policy environment Malaysia has also faced several challenges that have restricted growth in rubber production, including (i) a declining planted area for rubber despite increases in global demand, mainly due to the conversion of rubber areas to alternative crops, and (ii) low productivity compared to those attained by competing countries mainly due to use of poor-yielding clones (Dompok, 2010). Government involvement in the industry has been considerable. While diversification has always been an important element in the economic plans, the local government has promoted modernization in production systems. For instance, the government has invested funds in research and development (R&D) to support yield increases for both estates and smallholders. Due to the significance of the smallholder sector, projects have been implemented. The Malaysian Rubber Board (MRB) started a group farming project termed Projek Kampung Getah to improve production and revenue by integrated farming and new techniques such as application of the low-intensity tapping system (Mohammad and Sarjiman, 2007).
In 2011, the Ministry of Plantation Industries and Commodities together with MRB and Sabah Rubber Industry
“The original paper is available at journals.sagepub.com/home/oag” Board arranged a replanting and new planting support project under the National Key Economic Area. The government carried out replanting and new planting activities among smallholders. In 2011, the replanting subsidy was raised from RM7000 to RM9230 per hectare in Peninsular Malaysia and was established in Sabah and Sarawak at the rate of RM13,500 per hectare and RM14,000 per hectare, respectively. This grant has been introduced for new planting activities. MRB has provided particular attention to enhance yield through breeding and innovative latex harvesting methods via upstream R&D programmes and to meet the increasing demand by the industry. The MRB has also created new clones and technologies to enhance productivity as well ensuring favourable net returns from rubber production.
Methodology Rubber industry development programmes entail investment in R&D for development of high-yielding clones, provision of input subsidies and promotion of extension services to minimize technical inefficiencies in production systems. As evident from the past, the sector is subject to a number of factors such as its own prices, the pull of alter-native crops, input prices, development in the transportation sector and changes in climate and other technical factors. The industry is characterized by feedback relation-ships between major elements in the system and delays in the processes (e.g. harvesting time and response to prices) and non-linear behaviour. For instance, an increase in subsidy may result in an increase in production of natural rubber which with time causes an accumulation of inventory. An increase in stock would normally depress the price and producers may respond through area adjustment in the long term. Under such a complex system with many multi-dependent variables, a system dynamics methodology provides a framework that can account for the causal relationships between variables, lagged responses and non-linearity in behaviour. System dynamics methodology is a basis for constructing computer models that can rationally analyse the framework, the reciprocity and mode of behaviour of sophisticated socioeconomic, specialized and environmental systems (Forrester, 1968; Sterman, 2000). The system dynamics paradigm is based on feedback relationships and multi-loop nonlinear and time-delayed complicated systems. Capturing the nonlinear dynamic interactions is complex with traditional econometric methods (Stephens, 2012). Hence, the system dynamics method is most suited to model this type of complex issue. A detailed explanation of the system dynamics methodology is given by Forrester (1968). The modelling steps begin with the problem articulation and followed by formulation of dynamic hypothesis, formulation of simulation model, model testing and finally policy design and evaluation. + Profit +
Net Revenue +
Plantin/R eplanting Grant
R1
Production
R3
+
Fertilizer Cost
+
grant
Profit/area
+
-
Production + +
B4
B1
+
Fertilizer Cost
Net Area Addition Planted Area -
+
R2 Yield Growth by R&D
Fertilizer Use
-
B5
Conversion to Other Activities
B3
+
Workforce Cost
R&D and Technology Transfer
Yield +
+
Labor Cost
B2 Yield Change by Workforce
-
+
+
Worker
Figure 4. Causal loop diagram for rubber production in Malaysia. Malaysia has limited available land for rubber production, and it is highly subsidized in terms of inputs. So, issues such as subsidy, R&D and cropping intensity are important and need to be incorporated in the model to seek sustainable development plans for rubber in Malaysia. The causal loop diagram for rubber production in Malaysia is shown in Figure 4; this indicates the main feedback loops of the system. These diagrams have been utilized to describe fundamental causal relationships hypothesized to generate the reference mode of behaviour over time (Sterman, 2000). A causal loop comprises two or more causally related variables that close back on themselves. The relationship between variables can be either positive or negative. A positive relationship denotes that if one increases, the other also increases
“The original paper is available at journals.sagepub.com/home/oag” in the same direction. In a negative relationship, the two variables change in the opposite direction. Even numbers of negative relationships in total denote that the loop is positive and odd numbers of negative relationships represent the negative loops. Positive feedback loops create growth, while negative feedback loops are goal seeking (Abdulla et al., 2015; Mohammadi et al., 2016). There are eight main feedback loops in the rubber production system in Malaysia. The stock and flow diagram of the system dynamics model for rubber production is shown in Figure 5 where the rubber immature area (when trees are not yet tappable and hence not productive), harvested and abandoned areas are stock variables, and rubber area increase rate for rubber crop from planting is an inflow into the stock – immature area. The principal equations that correspond to major state variables described in Figure 5 are as follows. Rubber production depends on rubber productivity (tonnes/ha) as well as on harvested area under rubber cultivation and is computed as 1.
Rubber Production = Actual Productivity × Harvested Area
Rubber immature area is incremented by replanting of old tree areas and land suitable for rubber cultivation based on policy. The rubber area is reduced by a normal conversion rate of 0.058 of rubber abandoned area mainly for oil palm plantation. This is expressed as 2.
Conversion Rate = Abandoned Area × normal conversion fraction Fertilizer Price Per Ton Expenditure on Total Cost Fertilizer Fertilizer Application Per Ha
planting
Total Fertilizer Use
Net Revenue (NR)
Natural Rubber (NR) FOB Price
Harvested Area
mature rate
Maturation Period R
Aging Period
Time to Implement
Subsidy on R&D
Actual Yield Change in PP
Total Production
R Implemented Actual Yield
B decay
Effect of Fertilizer on Yield
Adjustment Time
Revenue
B Immature Area
Total Replanting Replanting Grant Grant Per Hectare
Productivity Adjustment
R&D and Desired Technology Productivity Transfer
Total Planted Area
Productivity Maximum Economic Gap Replanting B Productivity Profitability replanting Abandoned Normal Effect of Fractional Change Area Average Desired conversion conversion Wage Effect Area per Labor in labor fraction rate on LD Worker Rubber Tenure Rubber Profit departures Time Effect of Per Ha Relative Profit B Domestic Wage in Domestic Labor gap Labor Arrival Relative Labor in Rubber Foreign Delay domestic labor Rubber Profit Labor in Oil Palm Profit arrivals Rubber Per Ha B wage Effect of Relative Relative change Average Wage in Labor Labor Wage Domestic Labor Availability Agriculture labor Adjustment Engagement in arrivals Rubber Relative Wage Foreign Labor B
Figure 5. Stock and flow diagram for rubber production systems in Malaysia. Rubber trees need to be replaced after 25 years, which is their economic life, and latex yield begins to decline and is computed as Harvested Area 3. Decay = Aging Period Rubber potential productivity is increased by development of new clones and minimizing productivity gaps through R&D and technology transfer. In addition, it is affected by agricultural inputs. This is described as 4.
Potential Productivity =
Desired Productivity × R&D and Technology Transfer Time to Develop New Variety
Rubber is a perennial crop, and trees typically commence yielding beans about 5–10 years after planting when they reach maturity. That is the stage when tapping is started (Suyanto et al., 2001). Yields increase with time and reach a peak around 8 years after planting (Guo et al., 2006). With good husbandry practices, productivity will be sustained for up to 20–30 years (Manivong and Cramb 2008; Okuneye et al., 2003): 5.
Actual Productivity = Implemented Potential Productivity × (1-Effect of Labour Gap)
Foreign labour in rubber plantation area is augmented by labour arrivals and decreased by labour departures. This is
“The original paper is available at journals.sagepub.com/home/oag” expressed as 6.
Foreign Labour = labour arrival – labour departures + initial labour
Findings Initial values and parameters for modelling were obtained from primary and secondary data gathered from reports, statistical books for Malaysia and plantation visits (Table 2). A range of experiments were also conducted to establish confidence in the model, including validation, sensitivity analysis and policy analysis. The two principal tests for gaining confidence in the system dynamics models were validation and testing. Table 2. List of key parameters, values and data sources used for modelling. Parameter Actual yield Ageing period Average area per worker Harvested area Maturation period Natural rubber FOB price Wage in rubber
Value 1.11 (ton/ha) 20 (year) 6 (ha/worker) 1.37 (million ha) 5 (year) 2737 (RM/tonne) 2743 (RM/worker)
Source (MRB, 2011) (Manivong and Cramb, (2008) (MRB, 2011) (MRB, 2011) (Suyanto et al. 2001) (MRB, 2011) (MRB, 2011)
Testing denotes the accepting or rejecting the model based on the comparison of a model to observed reality, and validation denotes the process of building confidence in the usefulness and soundness of the model. Behaviour validity tests particularly emphasize on the behavioural trends rather than point by point estimation (Barlas, 1996). To establish a confidence in the model estimations, different validations such as comparing model estimations with historical data and whether the model generated reasonable behaviour and testing the quality of the parameter values were considered. Figures 6 to 8 show the comparison between the simulated and observed rubber planted areas, production and productivity. The model simulations agree well with historical patterns. The validated model was utilized for the baseline scenario and policy analysis.
Rubber Area ('million ha)
2.5 2 1.5 1 0.5 0 1980
1984
1988
1992
historical
1996
2000
2004
2008
simulation
Figure 6. Simulated and observed historical trend in rubber plantation area (million ha) in Malaysia. Table 3 provides a summary set of statistics along with the Theil’s inequality test for the important variables that were estimated to correspond with observed data. Explanation of the inequality test is given with graphs to define the errors by the decomposition technique for each variable. Table 3 shows the root-mean-square error (RMSE) and inequality statistics. The RMSE offers a standardized measure of the magnitude of the error. The Theil statistics indicate the total Table 3. Summary statistics of behaviour reproduction. Variable Rubber area Rubber productivity Rubber production
RMSE (%) 0.02 0.11 0.15
UM (%) 0.07 0.2 0.02
Theil Inequality Statistics US(%) 0.11 0.11 0.03 S
UC(%) 0.82 0.69 0.95
error and how it is decomposed into bias (UM), unequal variation (U ) and unequal covariation (UC) components (Sterman, 2000). The RMSE for rubber area was 2%. The error due to bias and unequal variation was 7% and 11%, respectively. It indicates that the simulated and observed series have nearly the same mean and share similar behaviour. The majority of error lies in unequal covariation and stems from the point by point variation around the simulated
“The original paper is available at journals.sagepub.com/home/oag”
Production ('million ton/year)
output. The RMSE for rubber production was 15%, but 95% of the error is due to unequal covariation, whereas the error in bias and unequal variation accounts for only 2% and 3%, respectively (Table 3). It shows that the simulated result for rubber production is consistent with the actual behaviour but differs from the point by point variation. 2 1.6 1.2 0.8 0.4 0 1980
1984
1988
1992
historical
1996
2000
2004
2008
simulation
Figure 7. Simulated and observed historical rubber production (million t/year) in Malaysia.
In Figure 7, the simulated output closely matches the historical data, but with some minor deviations. The historical data indicates some fluctuation along the trend. How-ever, the cycling trend is not taken into consideration explicitly as the model goal is to study the long run performance. Hence, the large error in unequal variation is of little concern as the model replicates the average and behaviour accurately. The RMSE for rubber productivity was 11%. The error due to bias, unequal variation and unequal covariation was 20%, 11% and 69%, appropriately. The error due to unequal variation is small. The majority of error comes from the unequal covariation. This indicates that the model captures the mean value and dominant pat-terns in the observed data well. The overall pattern of the simulated output closely fits that of the historical observed data (Figure 8). Owing to uncertainty in system dynamics models, sensitivity analysis is important for checking the reliability of
Productivity (ton/ha/year)
2 1.5 1 0.5 0 1980
1984
1988
1992
historical
1996
2000
2004
2008
simulation
Figure 8. Simulated and observed historical rubber productivity (t/ha) in Malaysia.
results and testing the robustness of the model pattern for adjustments in parameters. The sensitivity of the main parameters was also estimated. The time to develop a new variety has a great impact on the model pattern, that is, actual yield and production, which is the focus of this research. In this research, the behaviour sensitivity analysis of actual productivity and the total production to time to develop a new variety was conducted.
“The original paper is available at journals.sagepub.com/home/oag” Current 50% 75%
95%
100%
Actual Productivity 2
1.75
1.5
1.25
1 1980
1990
2000 Time (Year)
2010
2020
Figure 9. Sensitivity of observed rubber productivity over time to develop new variety. Note: The 100 percent percentile is shaded to include all number of simulations runs. The 95 percent percentile is generated by removing the lowest 2.5% and the highest 2.5% runs. The 75 percent percentile is generated by removing the lowest 12.5% and the highest 1 2.5% runs. The 50 percent percentile is generated by removing the lowest 25% and the highest 25% runs. Current 50% 75%
95%
100%
Total Production 2M
1.5 M
1M
500,000
0 1980
1990
2000 Time (Year)
2010
2020
Figure 10. Sensitivity of production (t) to time to develop a new variety.
Figures 9 and 10 show the changes in productivity and production for time to develop new variety for changes from 0.1 year to 10 years with an increment of 0.2 year. The 100 percent percentile is shaded to include all 50 simulation runs. The 95 percent percentile is generated by removing the lowest 2.5% and the highest 2.5% runs. The 50 percent percentile is generated by removing the lowest 25% and the highest 25% runs. The percentile charts show wide variations in the productivity and production, depending on the choice of input values allocated to parameter. The rubber yield and production change from a decline to growth in values for the changes in rubber productivity from 1.1 t/ha to 1.61 t/ha and production from 0.8 t/ha to 1.5 t/ha. Since relative profit is the function of rubber profit per hectare and oil palm profit per hectare, changes in any of these variables affect the total planted area dynamics. Hence, the changes in total planted area for oil palm profit per hectare with changes from 0% to 100% and an increment of 10% was tested (Figure 11).
“The original paper is available at journals.sagepub.com/home/oag” Current Total Planted Area 2M
1.5 M
1M
500,000
0 1980
1990
2000 Time (Year)
2010
2020
Figure 11. Sensitivity of total planted area (ha) to oil palm profit per hectare.
Simulated R&D and subsidy scenarios The system dynamics model was designed to address the main policy options of rubber production in Malaysia. The model was run to examine R&D policy for enhanced yield and the withdrawal of subsidies to address how the sector would perform in the long run. Given the data availability, the model structure was constructed on the basis of 30 years from 1980 to 2010. Simulations up to 2030 for a long-term analysis of system behaviours were completed. Figure 12 shows the simulated productivity, total production, total planted area and net revenue for subsidies on R&D (100%) for a 14-year simulation period. Rubber productivity increases up to 2 t/ha due to government support, while the total production grows up to approximately 1.6 million t. This results in an increase in net revenue to RM9.7 billion at the
end of the simulation period. This implies that subsidies on R&D have positive effect on productivity in Malaysia at the desired level, and the rubber production in Malaysia would be sustainable in the long run. 2 2M 2M 10 B
1 800,000 1M 0
ton/ha ton/Year ha RM
ton/ha ton/Year ha RM 1980
1990
Actual Yield : 100% subsidy Total Production : 100% subsidy Total Planted Area : 100% subsidy Net Revenue : 100% subsidy
2000 2010 Time (Year)
2020
2030 ton/ha ton/Year ha RM
Figure 12. Simulated observed productivity, total production, total planted area and net revenue for R&D subsidies. R&D: research and development.
Figure 13 shows the simulated productivity, total production, total planted area and net revenue for the withdrawal of subsidies on R&D for the same simulation period. Productivity, and hence the total production of rubber, declines as a result of withdrawal of subsidies on R&D. This causes a further decline in net revenue to RM9.5 billion at the end of the simulation period. This shows that the withdrawal of subsidies on R&D would have a negative effect on yield since rubber production in the country does not have comparative advantage in terms of net revenue. It would not be advisable to withdraw the subsidies unless a replacement mechanism such as the introduction of new varieties and/or improved management practices was introduced to ensure rubber yields were maintained.
“The original paper is available at journals.sagepub.com/home/oag” 2 2M 2M 10 B
ton/ha ton/Year ha RM
1 0 1M 0
ton/ha ton/Year ha RM 1980
1990
Actual Yield : subsidy withdrawal Total Production : subsidy withdrawal Total Planted Area : subsidy withdrawal Net Revenue : subsidy withdrawal
2000 2010 Time (Year)
2020
2030 ton/ha ton/Year ha RM
Figure 13. Simulated productivity, total production, total planted area and net revenue for withdrawal of R&D subsidies. R&D: research and development.
Summary and policy implications A system dynamics model has been designed to simulate and evaluate policy plans for sustainable rubber production. The results indicate that subsidy withdrawn would worsen productivity and hence production. Simulation results support the idea that one of the best policies to achieve the sustainability in production is through R&D and replacement of older trees with improved varieties through replanting schemes. One of the more significant findings to emerge is that the direct profitability and the return on investment are considered as the main factors to determine the turning point. The smallholders have labour-intensive farm operations, poor management skills and especially limited access to capital, which are often fol-lowed by advancing age and low asset levels; they are thus limited in their ability to adapt, either by adopting new technology or by transforming to other more lucrative activities. Obviously, the rubber upstream cannot carry on in a ‘business as usual’ mode. The adoption of recent output-increasing technology is desirable under the new conditions in which the industry is operating. This study provides a better understanding and new insights of rubber production to support improved decision-making to policy-makers and the rubber industry. The following policy implications emerge: (i) R&D has positive impacts on rubber production, and hence, subsidies for R&D require priority consideration to support development of new varieties, (ii) the sustainability of rubber production requires continuous funding for R&D to create new resilient and high-yielding clones. Policies should be regulated to facilitate the transfer of new technologies for sufficient rubber production, and (iii) to address trade-off between rubber and production of the other industrial crops. Declaration of conflicting interests The author(s) declared no potential conflicts of interest with respect to the research, authorship, and/or publication of this article. Funding The author(s) disclosed receipt of the following financial support for the research, authorship, and/or publication of this article: This study was funded by the Ministry of Education, Malaysia under the Fundamental Research Grant Scheme (FRGS) Vote No. 5524672.
References Abdulla I, Arshad FM, Tasrif M, et al. (2015) A systems approach to study the Malaysian pepper industry. American Journal of Applied Sciences 12(7): 487–494. Association of Natural Rubber Producing Countries (ANRPC) (2011) Member country info. Available at: anrpc.org/html/member_country_info.aspx?ID= 14&PID= 18 (accessed 7 March 2016).
http://www.
Barlas Y (1996) Formal aspects of model validity and vali-dation in system dynamics. System Dynamics Review 12: 183–210.
“The original paper is available at journals.sagepub.com/home/oag” Dompok BG (2010) Deepening Malaysia’s palm oil advantage. Chapter 9: Economic Transformation Programme, A Roadmap For Malaysia. Kuala Lumpur, Malaysia: Office of the Prime Minister, pp. 281–314. Dove MR (1993) Smallholder rubber and Swidden agriculture in Borneo: a sustainable adaptation to the ecology and economy of the tropical forest. Economic Botany 47(2): 136–147. FAO (1989) Commodity Review and Outlook 1988-89. Rome: Food and Agriculture Organization of the United Nations. Forrester JW (1968) Principles of Systems, 2nd ed. Waltham: Pegasus Communications, p. 391. Fox J and Castella J-C (2013) Expansion of rubber (Hevea brasiliensis) in Mainland Southeast Asia: what are the prospects for smallholders? The Journal of Peasant Studies 40(1): 155–170. Guo Z, Zhang Y, Deegen P, et al. (2006) Economic analyses of rubber and tea plantations and rubber-tea intercropping in Hainan, China. Agroforestry Systems 66(2): 117–127. Kadir AA (1994) Advances in natural rubber production. Rubber Chemistry and Technology 67(3): 537–548. Lawrence DC (1996) Trade-offs between rubber production and maintenance of diversity: the structure of rubber gardens in West Kalimantan, Indonesia. Agroforestry Systems 34: 83–100.
Malaysian Rubber Board (MRB) (2011) Malaysian rubber exchange. Available at: cechart.aspx (accessed 16 March 2016).
http://www3.lgm.gov.my/mre/smrpri
Manivong V and Cramb RA (2008) Economics of smallholder rubber expansion in Northern Laos. Agroforestry Systems 74(2): 113–125. Mohammad AF and Sarjiman Y (2007) Reviewing rubber: are we losing our grips? Journal of the Department of Statistics, Malaysia 2: 15–42. Mohammadi S, Arshad FM and Ibragimov A (2016) Future prospects and policy implications for biodiesel production in Malaysia: a system dynamics approach. Institutions and Economies 8(4): 42–57. Nyaka Ngobisa AIC, Zainal Abidin MA, Wong MY, et al. (2013) Neofusicoccum ribis associated with leaf blight on rubber (Hevea brasiliensis) in Peninsular Malaysia. Plant Pathology Journal 29(1): 10–16. Okuneye PA, Aromolaran AB, Adetunji MT, et al. (2003) Environmental impacts of cocoa and rubber cultivation in Nigeria. Outlook on Agriculture 32(1): 43–49. Stephens EC, Nicholson CF, Brown DR, et al. (2012) Modeling the impact of natural resource-based poverty traps on food security in Kenya: the crops, livestock and soils in smallholder economic systems (CLASSES) model. Food Security 4(3): 423–439.
Sterman JD (2000) Business dynamics: systems thinking and modeling for a complex world. Journal of the Operational Research Society. 53, pp. 1–29. DOI: 10.1057/palgrave.jors. 2601336. Suyanto S, Tomich TP and Otsuka K (2001) Land tenure and farm management efficiency: the case of smallholder rubber production in customary land areas of Sumatra. Agroforestry Systems 52(2): 145–160.