Cell Phone Mini Challenge Award: Social Network Accuracy— Exploring Temporal Communication in Mobile Call Graphs Qi Ye∗
Tian Zhu†
Deyong Hu‡
Bin Wu§
Nan Du
Bai Wang
Beijing University of Posts and Telecommunications Beijing Key Lab of Intelligent Telecommunications Software and Multimedia
A BSTRACT In the mobile call mini challenge of VAST 2008 contest, we explored the temporal communication patterns of Catalano/Vidro social network which is reflected in the mobile call data. We focus on detecting the hierarchy of the social network and try to get the important actors in it. We present our tools and methods in this summary. By using the visual analytic approaches, we can find out not only the temporal communication patterns in the social network but also the hierarchy of it. Index Terms: H.2.8 [Database Management]: Database Applications—Data mining; D.2.2 [Software Engineering]: Design Tools and Techniques—User interfaces 1
I NTRODUCTION
Our team solved the mobile call mini challenge in VAST 2008 contest. In order to find out temporal relationships among people and hierarchy in the mobile call network, we developed a tool called TemporalNet to explore the temporal mobile call graphs based on our network visualization framework JSNVA. 1.1 Tools JSNVA (Java Straight-line drawing Network Visual Analysis framework) is a software framework for network visual analysis in different applications. It has a clear architecture and supports a more systematic way of implementing different straight-line graph drawing algorithms which show different networks on different views. JSNVA can be used as a front-end for visualization and a back-end for analysis in applications, and it can be customized for different applications. Based on JSNVA, we developed a tool called TemporalNet to show the communication patterns in the call graphs. In the mini challenge, we mainly used the force directed layout algorithm to show the social networks. 2
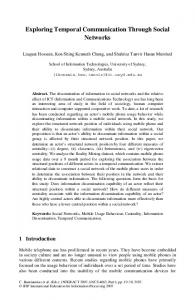
2.2 Temporal Relationship In order to detect the communication patterns, we construct call graphs based on the call records. A call graph G is a pair (V, E), where V is a finite set of vertices (mobile users), and E is a finite set of vertex-pairs from V (mobile calls). So if user u calls user v, then an edge (u, v) is said to exist in E. The edge (u, v) can be either directed or undirected. According to the mobile phone call records from June 1st 2006 to June 10th 2006, we find that the social network structure changed greatly on June 8th 2006. In the first 7 days, the leader of the social network was 200. In Fig. 1 the red edges are the calls formed on June 7th and the blue ones are the calls formed on June 8th . We use the PageRank value of each individual in the directed call graph formed in these 10 days to show the importance of the individual [1]. The sizes of vertices indicate the importance of vertices. We find an interesting pattern that all the neighbors of 200 vanished in the call graph formed on June 8th 2006 and there were some actors with large degrees replaced their positions. By visualizing the calling behaviors of the actors in Fig. 1, we find out that the structure of the social network changed greatly on the 8th day. The people who communicated with 1, 2, 3 and 5 changed to communicated with 309, 397, 360 and 306. In order to make this pattern more clearly, we set color of 1, 2, 3, 5 as red and set color of 309, 397, 360, 306 as blue. We will show the method of detecting equivalent actors in more details in the following.
A NALYSIS A PPROACH
2.1 Data Set The mobile call records cover a ten-day period in June 2006, and are narrowed to about 400 unique mobile phones during this period. The data set includes records with the following fields: identifier for caller, identifier for receiver, time, duration and call origination cell tower. The data set also tells us that Ferdinando Catalano’s identifier may be 200; close relatives and associate that he would be calling would include David Vidro, Juan Vidro, Jorge Vidro, and Estaban Catalano; Ferdinando would call brother Estaban most frequently; David Vidro coordinates high level in Paraiso activities. ∗ e-mail:
[email protected] † e-mail:
[email protected] ‡ e-mail:
[email protected] § e-mail:wubin, dunan,
[email protected]
IEEE Symposium on Visual Analytics Science and Technology October 19 - 24, Columbus, Ohio, USA 978-1-4244-2935-6/08/$25.00 ©2008 IEEE
Figure 1: The call graph formed in June 7th and 8th 2006.
2.3 Equivalent Actors The problem of detecting similar vertices in a network is not a new one. Two actors are considered structurally equivalent if they share many of the same network neighbors [2]. There are a lot of measures to show the similarity between data objects, such as simple matching coefficient, Jaccard coefficient, cosine similarity, Pearson’s correlation coefficient etc. [2, 3]. In order to get the similarity between two vertices in the call graph formed in these 10 days, we choose the Jaccard coefficient to measure how many common
207
Table 1: The Jaccard coefficients of actor pairs ID1 1 5 3 2
ID2 309 306 360 397
Jaccard Coefficient 0.75 0.68 0.60 0.59
neighbors they share. Let N(i) be the neighborhood of vertex i in a network and |x| be the size of set x. Then the Jaccard coefficient of an actor pair (i, j), which is symbolized by J(i, j), is given by the following equation: J(i, j) = J( j, i) =
|N(i) ∩ N( j)| |N(i) ∪ N( j)|
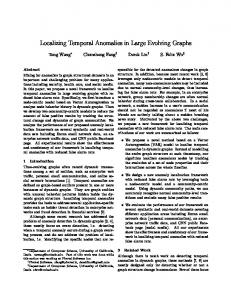
their importance. As David Vidro coordinates high-level in Paraiso activities and communications, we find that the person whose ID is 0 communicated with all the important people who communicated with 200. He also communicated with the persons in the second group whose identifiers are 306 and 309. We also guess that the persons whose identifiers are 1 and 2 may be Juan Vidro and Jorge Vidro. The one whose ID is 0 should be David Vidro. 3.0.2 Hierarchy Fig. 3 shows the social network by combing the common green vertices in Fig. 2 (A) and (B) as the third level. In our opinion, the hierarchy of the Paraiso movement social network has 3 levels: the first level is composed by the persons whose IDs are 0, 200 and 300; the persons who are in red and dark blue are in the second level; other persons in Fig. 3 are in the third level. The two groups with dark blue and red are these people who have equivalent positions in the social network.
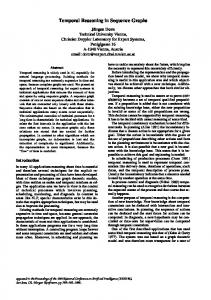
Table 1 shows the Jaccard coefficients of these actor pairs with high degrees in the call graph during the 10 days. The equivalent actor pairs are (1, 309), (5, 306), (3, 360) and (2, 397). 3 R ESULTS We can get that there are two groups of people who communicate with a lot of people in the Catalano/Vidro social network. The first group is the neighbors of 200 and their identifiers are 1, 2, 3 and 5. The second group is the people who have the equivalent positions with the people in the first group whose identifiers are 309, 397, 360 and 306. All the people in the second group called the person whose ID is 300. As shown in Fig. 2, we use the egocentric networks of 200 and 300 to show the social network structure. We get the social network by detecting the two egocentric networks whose roots are 200 and 300 in 2 hops. Fig. 2 (A) shows the social network of the first 7 days, and Fig. 2 (B) shows the social network of the last 3 days. The green nodes are the ones in both social networks.
Figure 3: The Catalano/Vidro social network.
4 C ONCLUSION Based on the mobile call records of the mini challenge in VAST 2008, we analyze the social network structure of Catalano/Vidro society. By visualizing the calling behaviors of the actors in the social network, we find on the 8th day the structure of the social network changes greatly. There are equivalent actors replace the positions of Ferdinando Catalano’s neighbors and these actors all called the person whose ID is 300. At last, after exploring these communication patterns, we construct a reduced social network structure to show the hierarchy of the social network.
Figure 2: The temporal social network (A) the first 7 days (B) the last 3 days.
3.0.1 Actors’ Names We believe that the person whose ID is 200 is Ferdinando Catalano and the person whose ID is 5 should be his brother Estaban Catalano. As the person whose ID is 200 have communicated with 6 persons and the person whose ID is 5 have communicated with him most frequently. They have communicated for 14 times and 15183 seconds during these 10 days. The person whose ID is 3 is the second one who communicate with Ferdinando Catalano most frequently, while they have communicated for 8 times and 8520 seconds. So we believe that the person whose ID is 5 should be Estaban Catalano. The sizes of vertices in these figures indicate
208
ACKNOWLEDGEMENTS This work is supported by the National Natural Science Foundation of China under Grant No. 60402011, and the National Science and Technology Support Program of China under Grant No.2006BAH03B05. It is also is supported by IBM China Research Laboratory, the Specialized Research Fund for the Joint laboratory between Beijing University of Posts and Communications and IBM China Research Laboratory (Project No.JTP200710024,JTP200806014-3). R EFERENCES [1] S. Brin and L. Page. The anatomy of large-scale hypertextual web search engine. In Computer Networks and ISDN Systems, volume 30, pages 107–117, 1998. [2] E. A. Leicht, P. Holme, and M. E. J. Newman. Vertex similarity in networks. Phys. Rev. E., 73(026120), 2006. [3] P.-N. Tan, M. Steinbach, and V. Kumar. Introduction to Data Mining. Addison-Wesley, 2006.