Abstract. Cyber attacks such as ransomware can do great damage. Intrusion de- ..... 4487â4492, April 2013. [14] Australian Center for Cyber Security (ACCS).
Intrusion Detection on System Call Graphs Martin Grimmer Martin Max Röhling Matthias Kricke Bogdan Franczyk Erhard Rahm
Abstract Cyber attacks such as ransomware can do great damage. Intrusion detection systems can help to detect those attacks. Especially with anomaly detection methods, it is possible to detect previous unknown attacks. In this paper, we present a graph-based approach in combination with existing methods trying to increase recognition rates and reduce false alarm rates. Our Hypotheses: By taking the inherent structure of the underlying data into account, it is possible to gain more insights compared to other known methods. The modern ADFA-LD dataset was used for the evaluation, which reflects the operation in a modern operating system. Compared to the Stide approach we demonstrate that a graph-based approach can keep pace. Keywords: Intrusion Detection, Anomaly Detection, System Call Graph, host-based IDS
1
Introduction
Nowadays all computer systems face the threat of attacks. Hardly a week goes by without reports of new malicious software or hacking attempts. As seen in May 2017, cyber attacks like the ransomware WannaCry may cause massive damage to the IT infrastructure of companies and to private users [1]. This shows the importance of detecting attacks on computer systems. Host based intrusion detection systems (HIDS) are capable to achieve this. Generally speaking, there are two types of HIDS: misuse detection and anomaly detection systems. The misuse detection system defines abusive behavior {grimmer,kricke,rahm}@informatik.uni-leipzig.de {roehling,franczyk}@wifa.uni-leipzig.de
G-2
25. DFN-Konferenz „Sicherheit in vernetzten Systemen“
and identifies processes conducting otherwise. These definitions are called misuse signatures or attack patterns. However, one drawback of these systems is the need of signatures before an attack occurs. Therefore, they are not able to detect attacks not defined in the misuse signatures. In contrast to misuse detection systems, anomaly detection systems, which are also called behavior based detection systems, are based on the definition of ordinary system behavior. These systems detect deviations from the ordinary behavior and do not need any attack signatures beforehand, which allows them to detect previously unknown attacks. Anomaly detection is related to the fields of outlier and novelty detection. Since we want to learn normal behavior of a system to distinguish it from an unknown, anomal and intrusive behavior we move forward into the area of one-class classification problems. In the case of one-class classification, only information of one class is available. The task is to define a boundary around this class so that it accepts as much of the containing objects while minimizing the number of accepted outlier objects [2]. This paper aims at extending an established method with a graph based, anomaly detecting approach to host based intrusion detection systems. After a period of training on a set of normal sequences of system calls, our approach is able to determine whether a new given system call trace belongs to an anomaly or normal behavior. The rest of this paper is organized as follows: Section 2 introduces a brief background and lists other approaches. Section 3 explains the theory behind our approach using system call graphs. Section 4 lists our used features and classifiers, which form the central algorithm for anomaly detection. Section 5 presents results and evaluates our approach. Section 6 discusses our results and provides an outlook for further research.
2 2.1
Background and Related Work Host-Based Intrusion Detection Systems
HIDS uses system call traces to detect intrusions. The intrusions are in form of anomalous subsequences of the traces. These collective anomalies translate to malicious programs, unauthorized behavior and policy violations [3]. A system call trace is the ordered sequence of system calls that a process performs during its execution, like open, read or write as shown in Figure 1 [4].
Grimmer et al.: Intrusion Detection on System Call Graphs
Trace 1 Trace 2 Trace 3
open open open
read mmap close
mmap read open
mmap open close
open close open
read ... mmap
G-3
mmap
...
close
...
Figure 1: Sample traces of operating system calls [3] The amount of possible system calls can be described as the alphabet based on the operating system. The size of the alphabet is usually large and depends on the system architecture. For example, about 380 individual system calls exist in the kernel used by the Ubuntu 11.04 distribution [5]. The traces are extracted from the kernel of the operating system. In a linux environment, tools like strace allow to monitor programs and to report all executed system calls. Each program generates sequences by its own characteristics in different lengths and different system calls [3]. It is essential that anomaly detection techniques, which are applied to HIDS, consider the context of the data. A system call trace which is compromised is clearly different from the program process under normal conditions [4][6]. For this reason point-anomaly detection techniques which can consider an individual data instance as anomalous, cannot be applied to this domain [3].
2.2
Other Approaches
Stide [6] keeps track of sequences of predetermined length seen in the training set and calls sequences not seen in training mismatches. To detect anomalies, the number of mismatches in a region of 20 consecutive sequences is considered. The threshold for anomalies is set between 1 and 20. T-Stide [7] is an extension to Stide, which incorporates a threshold (for example any sequence seen less than 0,001% of total number of sequences) for rare sequences which are also counted as mismatch. Eskin presents a probabilistic approach for detecting anomalies without the need of a clean normal training data [8]. The approach is based on three assumptions: Normal data can be modeled using the probability distribution, anomalous elements are sufficiently different from normal elements and the number of normal elements in the dataset is significantly larger than the number of anomalous elements. Creech tries to build a language which uses discontiguous system calls in order to get a semantic context. This context was used to train the decision
G-4
25. DFN-Konferenz „Sicherheit in vernetzten Systemen“
engine of a neural network, the extreme learning machine (ELM) [9]. ELM was proposed to reduce the false alarm rate while increasing the anomaly detection rate. Finally, superior results were demonstrated for the semantic approach. A considerable disadvantage of this approach is the necessary processing time, which can last weeks.
3
Our Approach: System Call Graphs
Hypotheses 1. By taking the inherent structure of the underlying data into account, it is possible to gain more insights compared to other known methods.
3.1
n-gram Sequence Graph
Each program trace represented by a sequence of system calls can be interpreted as a graph. A system call of such a sequence is represented by a vertex in the graph, the transition from a system call to the subsequent system call by an directed edge. Repeated calls of the same system call refer to the same vertex in the graph. The following example is intended to illustrate this. Given the sequence S from Figure 2 the resulting sequence graph looks like Figure 3. S:
054
175
120
175
175
003
175
175
120
175
...
Figure 2: Example system call sequence S. Note that for simplicity’s sake, the system calls are displayed as integers, as it is done in the reference dataset we use as shown in section 5.1.
Figure 3: Sequence Graph for the example sequence S. Edge weights represent the frequency of the transition and are omitted if the frequency is 1.
Grimmer et al.: Intrusion Detection on System Call Graphs
G-5
This principle can also be applied to n-grams of the system calls from a sequence, as shown in Figure 4 and 5. The window defining the n-gram is incremented by one place regardless of the n-gram length. step 1 step 2 step 3
[ 054 054 054
175 ] [ 175 175
120 120 ] [ 120
175 175 175 ]
175 175 175
003 003 003
... ... ...
Figure 4: Selection of the first three n-grams from S which form the vertices (054, 175), (175, 120) and (120, 175) in the resulting n-gram sequence graph with n = 2.
Figure 5: Resulting Sequence Graphs for the example sequence S with n = 2 and n = 3. Again, edge weights represents the frequency of the transition and are omitted if the frequency is 1.
3.2
n-gram Probability Graph
The n-gram Probability Graph is generated from all sequence graphs, from the training set of normal system call sequences. Vertices with the same label are merged. Parallel edges from vertices a to b are grouped together and the frequency of the corresponding transition is noted as a parameter of the edge called transition frequency f (a, b). In addition, the probability of a transition from a vertex a to an adjacent vertex b is stored as edge parameter and called transition probability p(a, b). Let A be the set of adjacent successor vertices of a, than: f (a, b) p(a, b) = ∑ f (a, ai ) ai ∈A
G-6
25. DFN-Konferenz „Sicherheit in vernetzten Systemen“
Figure 6 shows an example probability graph and its two source sequence graphs.
Figure 6: Example probability graph generated from the training set of two sequence graphs with n = 2. The edge properties are transition frequency and transition probability. The resulting n-gram Probability Graph is similar to a markov chain of n-th order. For a given system call sequence T it gives the probability regarding the training set off all transitions of T considering the n previous system calls of the sequence.
4 4.1
Classification Feature Engineering
We investigate the properties of the graph best suited to detect anomalies in the system call sequences. In this paper we want to use these properties in addition to the feature used by Stide. Features we considered are: the number of distinct vertices used by a sequence, the mean of transition probabilities and the mean of transition fre-
Grimmer et al.: Intrusion Detection on System Call Graphs
G-7
quencies. These values can easily be calculated from a given sequence graph as indicated in Figure 7. example sequence 175 175 003 175 054 175 120 175
transition a→b 175,175 → 175,003 175,003 → 003,175 003,175 → 175,054 175,054 → 054,175 054,175 → 175,120 175,120 → 120,175
frequency f (a, b) 1 2 0 0 1 3 mean: 1.166
probability p(a, b) 0.333 0.666 0.000 0.000 0.500 1.000 mean: 0.4165
Figure 7: Another example sequence applied on the probability graph of Figure 6 and the average of the corresponding transition frequencies and probabilities. This average value is used as one feature in the following classification. We normalized the values of all of our features with z-score normalization using Gaussian distribution.
4.2
Classifier
We classified the extracted features of the system call traces using the following classifiers: axis aligned bounding box, k-centers and nearest neighbor. In the following descriptions we call the set of training sequences T = {t1 ,t2 , ...,tnT }, the set of features: F = { f1 , f2 , ..., f j } with j = |F| and we call the actual feature vector of a given sequence s: Fs = ( f1 (s), f2 (s), ..., f j (s))
G-8
4.2.1
25. DFN-Konferenz „Sicherheit in vernetzten Systemen“
Axis Aligned Bounding Box Classifier
The Axis Aligned Bounding Box Classifier (AABB) is the simplest classifier we used. It defines the boundary around the target class as an j dimensional axis aligned bounding box. For each feature fi ∈ F used for classification it stores the minimum min fi and maximum max fi value seen in the training set. A given sequence s is considered an anomaly if at least one of its features fi (s) lies outside the axis aligned bounding box: s is an anomaly ↔ ∃ fi ∈ F : fi (s) < min fi ∨ fi (s) > max fi
Figure 8: The Axis Aligned Bounding Box Classifier visualized for two dimensions. The simple form of the border can cause problems. As one can see normal values like b can be classified correctly, but anomalies like a may not be detected. 4.2.2
K-centers Classifier
The k-centers method introduced by Ypma and Duin [10] covers the dataset with k balls of equal radii. The centers of the balls lie on elements of the
Grimmer et al.: Intrusion Detection on System Call Graphs
G-9
training set. The k centers are determined by a random initialization and a search strategy trying to minimize the maximum minimum euclidean distance of the selected k-centers to all other elements of the trainings set. The result of this training are the k selected centers C = {c1 , c2 , ..., ck } and the minimized maximum minimum distance r: A given sequence s is considered an anomaly if the distance of s to all k-centers is greater than r. s is an anomaly ↔ ∀ c ∈ C : ||Fs − c||2 > r
Figure 9: K-centers Classifier visualized for two dimensions and k = 3. The sets of training, normal and anomal data are the same as in Figure 8. The slightly more complex form of the border may provide better classification results. This time, the anomal data point a is classified correctly, but the normal point b isn’t. 4.2.3
Nearest Neighbor Classifier
The nearest neighbor method from [2] compares the euclidean distance from a test sequence s to its nearest neighbor nn(s) within the trainings set to the distance of nn(s) to its nearest neighbor nn(nn(s)) from the trainings set: s is an anomaly ↔ ||Fs − nn(Fs )||2 > ||nn(Fs ) − nn(nn(Fs ))||2
G-10
25. DFN-Konferenz „Sicherheit in vernetzten Systemen“
Figure 10: Nearest Neighbor Classifier visualized for two dimensions. As before, the sets of training, normal and anomal data are the same as in Figure 8. This more complex form of the border may provide even better classification results. The example data points a and b are classified correctly in this example. 4.2.4
Combined Classifier
We also want to test a combined variant of the classifiers presented here. It should decide by majority voting. The classifier contains a configuration of each of the other classifiers and a threshold value that specifies how many of the classifiers must classify a trace as normal in order to mark it as normal.
5 5.1
Evaluation Datasets
In order to ensure the comparability of the results, we want to use a frequently used dataset from recent years. Although the 1999 DARPA Intrusion Detection Evaluation dataset [11], especially the BSM (Basic Security Module) from the MIT Lincoln Labs and the Sequence-based Intrusion Detection dataset from
Grimmer et al.: Intrusion Detection on System Call Graphs
G-11
the University of New Mexico [12, 7], were often used in recent years, we want to apply our approach to the newer ADFA-LD dataset [13, 14]. This dataset consists of sequences of system calls without parameter similar to the sequences used in the previous sections and as shown in Figure 2. The composition and size of the ADFA-LD dataset is shown in Figure11. Past approaches provide dataset training data validation data attack data
number of sequences 833 4373 745
Figure 11: Composition of the ADFA-LD dataset. good results on older datasets as mentioned above, but especially the new ADFA-LD is much more difficult to solve, because it has a much greater degree of similarity between attack data and normal data [13]. In contrast to earlier datasets, the traces of ADFA-LD come from a mixture of different programs without mapping the traces to the programs. Therefore, it is not possible to learn the normal behaviour of a single program, instead one has to consider everything as a whole. It uses a modern Linux operating system that is fully patched as well as the latest publicly accessible exploits. In summary the ADFALD record is based on a realistic modern target and is much more representative of current cyber attacks [9]. The ADFA-LD thus forms a realistic and relevant metric for the IDS performance evaluation.
5.2
Stide Variants
In order to compare the performance of our approach we have implemented two variants of the Stide approach. Variant I corresponds to the approach described in [7]. A threshold value l of 1 to 20 is defined. If the number of mismatches within a locality frame of the 20 last n-grams is greater or equal l, the trace is considered an anomaly. Variant II considers the whole trace at once and calculates the ratio of mismatches to the number of n-grams of the trace. In this variant, a threshold for the ratio is defined, which determines whether it is an anomaly.
G-12
5.3
25. DFN-Konferenz „Sicherheit in vernetzten Systemen“
Results
To visualize the results of our experiments, we use receiver operating characteristic (ROC) curves plotting the detection rate (DR) against the false alarm rate (FAR). These values are calculated as follows: DR =
anomal traces classified as anomal |A|
FAR =
normal traces classified as anomal |N|
With N = {n1 , n2 , ...nnN } the set of normal traces for validation and A = {a1 , a2 , ...anA } the set of anomal traces for validation. The detection rate is the percentage of intrusions (anomal traces), which are correct identified as anomal (true positives). The false alarm rate is defined to be the percentage of normal traces which are declared anomalous (false positives). The difference of the detection rate to 100% describes the percentage of attacks which are not detected (false negatives). The best results we achieved are optimal in Pareto condition, so that the detection rate cannot be improved without increasing the false alarm rate. In this condition the detection rate is maximized and the false alarm rate is minimized at the same time. In order to keep up with other approaches, detection rates above 80% with as low as possible false alarm rates are relevant for us. Exceptions to this rule are results with an extremely low false alarm rate of less than 1%, which is necessary for real-world application.
5.3.1
Stide Variant Results
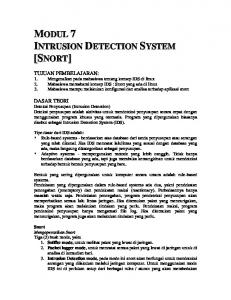
The results from comparing both variant implementations of Stide can be seen in Figure 12. As one can see, variant II is better than variant I in almost all respects. This situation only changes with very high false alarm rates. Similar curves were measured for other values of n. Therefore, in the following we refer to variant II only.
Grimmer et al.: Intrusion Detection on System Call Graphs
G-13
100 90
Detection Rate in %
80 70
60 50 40 30 20
Stide Variant I 10
Stide Variant II 0
0
10
20
30
40
50
60
70
80
False Alarm Rate in %
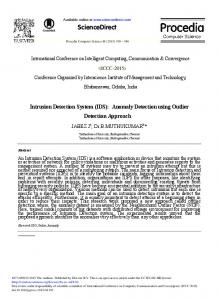
Figure 12: Resulting Detection Rates and False Alarm Rates for n = 5 of both Stide variants with different values for the thresholds described in section 5.2. Figure 13 shows more results of variant II of our implementation. 100 90
Detection Rate in %
80 70 60 50 40 n=1
n=2
30
n=3
n=4
20
n=5
n=6
n=7
n=8
n=9
n=10
10 0 0
10
20
30
40
50
60
70
80
False Alarm Rate in %
Figure 13: Results from our implementation of the Stide variant II approach with different values for n and the threshold. This variant of Stide is capable of achieving a DR of about 80% with a cost of about 18% FAR or a DR of 90% with 24% FAR. The best result from our experiments with a very low FAR of under 1% is achieved by the configuration
G-14
25. DFN-Konferenz „Sicherheit in vernetzten Systemen“
with n = 4 and a value of 0.2 for the threshold achieves 18.9% DR and 0.7% FAR.
5.3.2
Other Classifiers on n-Gram Probability Graph Results
We did similar experiments for the classifier described in section 4.2. The results are shown in the following Figures. Figure 14 shows: the nearest neighbor classifier is obviously not suitable for the given data and features and is omitted in the following considerations. However, the AABB classifier is quite promising for its simple approach.
100
90
Detection Rate in %
80 70 60
50 40 30 20 AABB Classifier
10 NN Classifier 0
0
10
20
30
40
50
60
70
80
False Alarm Rate in %
Figure 14: ROC curves of AABB and NN classifiers for different values of n.
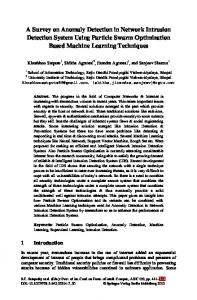
Figure 15 shows the ROC curves of the k-Center classifier for different values of n and k. For each value of n we tested several values from 1, 26, 51, 76, ..., 501. The quality of the ROC curve depends highly from n. For low values of n the DR is quite poor but rises up to over 90% at the expense of FAR with over 30%.
Grimmer et al.: Intrusion Detection on System Call Graphs
G-15
100 90
Detection Rate in %
80 70
60 50
40 30
20 10
n=1
n=2
n=3
n=4
n=5
n=6
n=7
n=8
n=9
n=10
0 0
10
20
30
40
50
60
70
80
False Alarm Rate in %
Figure 15: ROC curves of the k-Center classifier for different values of n and k.
100 90
Detection Rate in %
80 70 60 50 40 Stide 30 KCenters 20 AABB
10 Combined 0 0
10
20
30
40
50
60
70
80
False Alarm Rate in %
Figure 16: Comparison of the best configurations of the different approaches.
In Figure 16 we compared the best configurations of different approaches based on the previous experiments. The combined classifier was configured as follows: AABB classifier with n = 3, k-Center classifier with k = 26 and n = 3, NN classifier with n = 3 and Stide with n = 7 and a mismatch threshold of 0.55.
G-16
6
25. DFN-Konferenz „Sicherheit in vernetzten Systemen“
Conclusion and Future Work
Compared to the best configuration of the Stide approach for the ADFA-LD dataset, we could show that our n-gram probability graph approach can keep pace even though it uses really simple classifier and features. At the moment we have not yet been able to confirm our hypothesis from section 3. However, the current results are promising in a way that we believe further research is worthwhile. Further work should be done by testing more complex classifiers: One Class Support Vector Machine [15], Support Vector Data Description [16] or even types of artificial neural networks. In addition we want to dive deeper into feature engineering by testing more features extracted from the underlying graphs like out and in degree centralities, different quantiles of transition probabilities and transition frequencies just to name a few. We want to examine the impact of different normalization techniques and the principal component analysis. In a second step, we also want to check whether the results can be improved if not only the system calls, but also their metadata and parameters such as user ids, process names, file handles etc. are taken into account and represented in the graph.
Acknowledgements This work was partly funded by the German Federal Ministry of Education and Research within the project Explicit Privacy-Preserving Host Intrusion Detection System (EXPLOIDS) (BMBF 16KIS0522K) and Competence Center for Scalable Data Services and Solutions (ScaDS) Dresden/Leipzig (BMBF 01IS14014B).
References [1] Bundesamt für Sicherheit in der Informationstechnik. Presseinformationen des bsi - weltweite cyber-sicherheitsvorfälle durch ransomware. https: //www.bsi.bund.de/DE/Presse/Pressemitteilungen/ Presse2017/PM_WannaCry_13052017.html, 2017. [Online;
accessed 31-July-2017]. [2] David Martinus Johannes Tax. One-class classification. 2001.
Grimmer et al.: Intrusion Detection on System Call Graphs
G-17
[3] Varun Chandola, Arindam Banerjee, and Vipin Kumar. Anomaly detection: A survey. ACM Comput. Surv., 41(3):15:1–15:58, July 2009. [4] Eleazar Eskin, Wenke Lee, and Salvatore J Stolfo. Modeling system calls for intrusion detection with dynamic window sizes. In DARPA Information Survivability Conference & Exposition II, 2001. DISCEX’01. Proceedings, volume 1, pages 165–175. IEEE, 2001. [5] The Linux man-pages project. Ubuntu manpage: syscalls - linux system calls. http://manpages.ubuntu.com/manpages/trusty/ man2/syscalls.2.html, 2017. [Online; accessed 17-August-2017]. [6] Steven A Hofmeyr, Stephanie Forrest, and Anil Somayaji. Intrusion detection using sequences of system calls. Journal of computer security, 6(3):151–180, 1998. [7] Christina Warrender, Stephanie Forrest, and Barak Pearlmutter. Detecting intrusions using system calls: Alternative data models. In Security and Privacy, 1999. Proceedings of the 1999 IEEE Symposium on, pages 133– 145. IEEE, 1999. [8] Eleazar Eskin. Anomaly detection over noisy data using learned probability distributions. In In Proceedings of the International Conference on Machine Learning. Citeseer, 2000. [9] Gideon Creech and Jiankun Hu. A semantic approach to host-based intrusion detection systems using contiguousand discontiguous system call patterns. IEEE Transactions on Computers, 63(4):807–819, 2014. [10] Alexander Ypma and Robert PW Duin. Support objects for domain approximation. ICANN, 1998. [11] MASSACHUSETTS INSTITUTE OF TECHNOLOGY LINCOLN LABORATORY. 1999 darpa intrusion detection evaluation data set. https: //www.ll.mit.edu/ideval/data/1999data.html, 1999. [Online; accessed 19-July-2017]. [12] University of New Mexico Computer Science Department, Farris Engineering Center. Computer immune systems - data sets and software. https://www.cs.unm.edu/~immsec/systemcalls.htm, 1999. [Online; accessed 19-July-2017].
G-18
25. DFN-Konferenz „Sicherheit in vernetzten Systemen“
[13] G. Creech and J. Hu. Generation of a new ids test dataset: Time to retire the kdd collection. In 2013 IEEE Wireless Communications and Networking Conference (WCNC), pages 4487–4492, April 2013. The adfa [14] Australian Center for Cyber Security (ACCS). intrusion detection datasets. https://www.unsw.adfa. edu.au/australian-centre-for-cyber-security/ [Online; cybersecurity/ADFA-IDS-Datasets/, 2013.
ac-
cessed 19-July-2017]. [15] Bernhard Schölkopf, John C Platt, John Shawe-Taylor, Alex J Smola, and Robert C Williamson. Estimating the support of a high-dimensional distribution. Neural computation, 13(7):1443–1471, 2001. [16] David MJ Tax and Robert PW Duin. Support vector data description. Machine learning, 54(1):45–66, 2004.