Exploring the Relationship. Between Content Coverage and Achievement:
Unpacking the Meaning of. Tracking in Eighth Grade. Mathematics. William H.
u u u u u u u u u u u u u
Unpacking the Meaning of Tracking in Eighth Grade Mathematics
u
u
u
u u
Exploring the Relationship Between Content Coverage and Achievement:
u u u u u u u u u u u u u u u u u u
Exploring the Relationship Between Content Coverage and Achievement: Unpacking the Meaning of Tracking in Eighth Grade Mathematics William H. Schmidt Michigan State University
Exploring the Relationship Between Content Coverage and Achievement: u u u u u u u u u u u u u u u u u u u u u u u u u u u u u
2
Unpacking the Meaning of Tracking in Eighth Grade Mathematics u u u u u u u u u u u u u u u u u u u u u u u u u u u u u
TABLE OF CONTENTS
I
Introduction. . . . . . . . . . . . . . . . . . . . . . . . .
II
Background. . . . . . . . . . . . . . . . . . . . . . . . . . 7
4
III Results. . . . . . . . . . . . . . . . . . . . . . . . . . . . .
14
IV Discussion . . . . . . . . . . . . . . . . . . . . . . . . . .
34
V
References. . . . . . . . . . . . . . . . . . . . . . . . .
38
VI Endnotes . . . . . . . . . . . . . . . . . . . . . . . . . . .
42
3
Exploring the Relationship Between Content Coverage and Achievement: u u u u u u u u u u u u u u u u u u u u u u u u u u u u u
INTRODUCTION In the wake of the No Child Left Behind Act of 2001, issues of suitable standards for all children and equitable access to adequate learning opportunities have acquired a new urgency in education reform deliberations. States and individual districts are being compelled to make explicit what it means to have high standards for all children and what it means for all children to have equitable opportunities to learn necessary, important, and challenging content (Achieve, 2002b). These issues of equitable learning opportunities and challenging standards are visible nowhere more keenly than with the case of eighth grade mathematics. The great need in this area is shown, at least in part, by the mathematics performance of U.S. eighth grade students. This performance has been characterized as “lackluster” and “just not good enough” (National Commission on Mathematics and Science Teaching for the 21st Century, 2000; Riley, 1996; Schmidt et al., 1999). Given the lack of focused, coherent, and challenging standards for all eighth grade mathematics students and the somewhat “splintered vision” that appears to inform classroom instruction, this type of student performance is not surprising ( Schmidt, McKnight, & Raizen, 1997). This situation may also explain the choice of eighth grade mathematics as the first area of concerted effort and focus by Achieve, Inc., an independent organization to help states raise academic standards (Achieve, 2002a). One possible explanation for this “lackluster” mathematics performance is the widespread use of tracking in U.S. middle and secondary schools—a process that was found to be relatively rare across the more than 40 countries involved in the Third International Mathematics and Science Study (TIMSS) (Schmidt, McKnight, Cogan, Jakwerth, & Houang, 1999). Tracking in the United States has had an amorphous history, meaning different things to different people at different times (Oakes, 1985). At one point, tracking implied dividing secondary students into rigid curricular programs (e.g., college-preparatory, general, vocational) that spanned all academic subjects (Lucas, 1999; Oakes, 1985). Today, such schoolwide curricular programs are rarely overt aspects of school policy. This does not mean, however, that schools do not track students—most do. Rather, instead of overarching curricular programs that keep students in the same track across subjects, both secondary and middle schools now differentiate students within subjects (Lucas, 1999). This implies, for example, that two students in eighth grade taking mathematics may be in two substantively different mathematics classes such as basic arithmetic and algebra. Although the curricular level of one class is often associated with the curricular levels of a student’s other classes, tracking can best be understood by examining the specific courses that students take (Friedkin & Thomas, 1997; Heck, Price, & Thomas, 2004; Lucas, 1999; Lucas & Berends, 2002; Stevenson, Schiller, & Schneider, 1994).
4
Unpacking the Meaning of Tracking in Eighth Grade Mathematics u u u u u u u u u u u u u u u u u u u u u u u u u u u u u Tracking in mathematics, therefore, is considered to be the provision of substantively different mathematics content or curriculum to different students at the same grade level. Tracking is differentiated from ability grouping, where the content is common but the instructional approach, such as the pacing and depth of instruction, may differ. By definition, then, tracking provides different students different opportunities to learn mathematics content. Tracking in mathematics, as it is typically conceived, implies that some students will eventually have an opportunity to learn advanced mathematics content and some will not. Advocates of tracking argue that this type of curricular differentiation facilitates teaching and learning, as it matches students’ ability level to the most suitable curriculum. Tracking theory contends that some students would struggle immensely in high-level curricula while a low-level curriculum would confine others. Tracking, therefore, allows students to be placed into classes where they will—theoretically—make the greatest achievement gains. In turn, this theory posits that tracking, compared to non-tracking, increases overall student achievement and lessens achievement inequality (Gamoran, 1992). Most research on tracking (focusing only on secondary schooling), however, has found that differentiating the mathematics curriculum tends to adversely affect students in low-level courses compared to their high-tracked peers (Gamoran, 1987; Gamoran & Berends, 1987; Gamoran & Mare, 1989; Gamoran, Porter, Smithson, & White, 1997; Hallinan & Kubistchek, 1999; Hoffer, 1992; Lucas, 1999; Oakes, 1985, 1990; Schneider, Swanson, & Riegle-Crumb, 1998; Stevenson, Schiller, & Schneider, 1994). Students in low-tracked mathematics courses are less likely to expect to go to college, (Alexander, Cook, & McDill, 1978; Alexander & Cook, 1982; Alexander & McDill, 1976; Heyns, 1974; Vanfossen, Jones, & Spade, 1987), less likely to actually attend college, even after controlling for students’ post-secondary expectations (Alexander & Eckland, 1975; Rosenbaum, 1980; Vanfossen et al., 1987), and have lower self-images (Alexander & McDill, 1976; Oakes, 1985; Vanfossen et al., 1987). Perhaps most salient, though, is that many studies have found that mathematics tracking tends to exacerbate achievement inequalities between high- and low-tracked students (Gamoran, 1987; Gamoran & Mare, 1989; Hallinan & Kubistchek, 1999; Hoffer, 1992; Ma, 2000; Schneider et al., 1998; Stevenson et al., 1994). Many studies analyzing the effect of tracking on achievement, however, have had several limitations. To begin, studies using large, nationally representative data sets such as the National Education Longitudinal Study (NELS) or High School and Beyond (HSB)—which provide the data for most of the research done in this area—have for one thing used students’ self-reports to indicate track location. This can be problematic, though, as students may be in different curricular track-levels depending on the academic subject. How, then, should students respond to a survey question about their track if they are in a high-tracked mathematics course but a low-tracked English course? Moreover, self-reports assume that students’ perceptions of curricular tracks are similar to those of school personnel or researchers. However, Rosenbaum (1980) found that the correlation
5
Exploring the Relationship Between Content Coverage and Achievement: u u u u u u u u u u u u u u u u u u u u u u u u u u u u u between students’ perceptions of their track and their actual track was only 0.60. Later evidence found that 19.7% of the students in Rosenbaum’s study misperceived their placement1 (Fennessey, Alexander, Riordan, & Salganik, 1981). The second and more serious limitation is that the sampling plan by which students are chosen within the sampled school is not properly defined for studying the issue of tracking. 1 Research on mathematics tracking and achievement has also mostly focused on high school students. But tracking typically begins—especially in mathematics—during the middle grades (Dauber, Alexander, & Entwisle, 1996; Hallinan, 1992; Useem, 1992). Consequently, studies focusing solely on high school tracking may mask tracking’s earlier achievement effects. And although ability grouping in elementary schools may affect a student’s subsequent middle school track-location, it is in the middle grades where formal curricular differentiation typically begins. It is thus important to analyze how tracking is related to content coverage and to unpack the relationship of both to the achievement of middleschool students, as these grades are the primary root of U.S. mathematics tracking. In this paper we address these limitations by examining the effect of tracking on eighth grade mathematics achievement and by defining track location in terms of the actual mathematics content that students covered in that track. We have previously documented the extent of the variation that passes for eighth grade mathematics in terms of course titles, textbooks used, amount of instructional time devoted to specific topics, and the relative difficulty of courses from an international perspective (Cogan, Schmidt & Wiley, 2001). Here we report on a set of analyses designed explicitly to explore the effect of tracking on achievement. Using a unique nationally representative sample of seventh and eighth grade students that allows us to overcome, to some extent, the limitations due to within school sampling (by providing a full characterization of tracking within the sampled schools), we explore the relationship of tracking in eighth grade to what mathematics topics are studied during eighth grade (content exposure) and to what is learned during the year as well as to what is achieved by the end of eighth grade.
1
6
Lucas and Gamoran (2002) have shown that students’ self-reports affect mathematics achievement independent of their actual course enrollments. They therefore suggest that it is “unwise to dismiss self-reports as merely perceptual” (p. 175). Instead, they suggest that self-reports may partly measure the social-psychological dimension of tracking. This dimension includes students’ attitudes, values, and acceptance of school. Nevertheless, Lucas and Gamoran agree that self-reports are weaker measures of the structural dimension of tracking than actual course enrollments.
Unpacking the Meaning of Tracking in Eighth Grade Mathematics u u u u u u u u u u u u u u u u u u u u u u u u u u u u u
BACKGROUND Mathematics tracking is commonly practiced in the eighth grade (Cogan, Schmidt & Wiley, 2001; Hoffer, 1992). Consequently, eighth grade students often take one of several mathematics-course options, typically algebra, pre-algebra, or general math (Cogan, Schmidt & Wiley, 2001). Which course a student takes, however, is not inconsequential. Each course presents a substantively different curriculum, and in turn affects students’ achievement differently. Prior studies have highlighted two important ways that a student’s eighth grade course affects his or her subsequent mathematics achievement: positional advantages and differential achievement growth.
Eighth-Grade Tracking and Positional Advantages A student’s eighth grade mathematics course affects which mathematics courses he or she will take in high school (Atanda, 1999; McFarland, 2006; Stevenson et al., 1994). Because mathematics is typically presented as a linear sequence, where entry into one class is contingent on successfully completing the antecedent class (e.g. Algebra I and Algebra II), a student’s eighth grade course largely feeds into his or her ninth grade course. Students taking pre-algebra in eighth grade tend to take algebra in ninth grade. Similarly, students taking algebra in eighth grade tend to take geometry in ninth grade (McFarland, 2006). These ninth grade courses then affect students’ tenth grade courses, and so on, ultimately affecting “how far” a student gets in the mathematics curriculum (McDonnell, 1995; Riegle-Crumb, 2006; Schneider et al., 1998; Stevenson et al., 1994). Of course, in the absence of a national mathematics curriculum, these course sequences can vary by school (for example, see McFarland, 2006); the hierarchical nature of mathematics, however, tends to produce/result in similar course sequences across the U.S. (Stevenson et al., 1994). One’s eighth grade math course can therefore be viewed as a position in a long sequence of courses (Schneider et al., 1998; Stevenson et al., 1994). Certain positions facilitate students’ entry into advanced mathematics courses such as calculus or trigonometry. Other positions may only take students to Algebra II. Some students, then, have a positional advantage, as their position allows them to take higher-level mathematics courses— which in turn significantly increases their chance to attend college (Adelman, 1999, 2003). Rosenbaum (1978) called the progression through course sequences a tournament, where students in advantaged positions (e.g. taking algebra in the eighth grade) can “win” or “lose.” Winning entails maintaining one’s position, whereas losing represents a relegation to a lower position. Moreover, once a student is relegated, he or she cannot regain the advantaged position, and thus “the tournament is
7
Exploring the Relationship Between Content Coverage and Achievement: u u u u u u u u u u u u u u u u u u u u u u u u u u u u u over” and they “lose forever” (Rosenbaum, 1978, pp. 252). Subsequent research, however, has shown that track positions are not as inflexible as Rosenbaum’s tournament (Hallinan, 1996; Lucas & Good, 2001; McFarland, 2006). Hallinan (1996) found that some upward mobility does exist in mathematics tracks, and thus students can regain a positional advantage. Nevertheless, the track a student begins in, generally in the seventh or eighth grade, is a significant predictor of where he or she will be in twelfth grade (Hallinan, 1996; McFarland, 2006; Schneider et al., 1998; Stevenson et al., 1994). Further, students who have access to algebra before high school—typically taking it in eighth grade—have significantly greater access to advanced twelfth grade mathematics courses, even after controlling for tenth grade track location, mathematics achievement, and educational aspirations (Smith, 1996). Tracking in the eighth grade thus sets in motion high school tracking, which in turn affects college attendance; those students who have a positional advantage in eighth grade are more likely to have a similarly advantaged position at the end of high school.
Eighth-Grade Tracking and Differential Achievement Growth The fact that mathematics tracking causes students to end up in different curricular locations is not incredibly surprising. After all, a main purpose of tracking is to allocate students into the courses that best match their ability level. Tracking theory posits that these matches will improve students’ achievement growth compared to non-tracked courses. But most studies of secondary tracking have shown that tracking tends to have the opposite effect, actually increasing achievement inequalities. This tendency is no less true at the eighth grade, although it is not a consensus. Research on the effect of tracking on achievement growth generally takes two forms: one compares differences in achievement growth between tracked and non-tracked schools, while the other compares achievement growth between different track-levels. The results of research comparing tracked and non-tracked schools in the middle grades have been mixed. On one hand, Hoffer (1992) found that non-tracked students tend to make greater achievement gains than their tracked peers, although this difference was not statistically significant. On the other hand, in a meta-analysis of 27 studies, Slavin (1993) found the effects of tracking on student achievement in the middle grades to be essentially zero. Slavin did not limit his studies to mathematics achievement, however, nor did he differentiate between ability grouping and tracking.
8
This does not mean, however, that tracking similarly has a small to negligible effect on all students. Studies comparing tracked schools to non-tracked schools typically aggregate student achievement to the school level and thus mask how individual students within the tracked schools may be differentially affected. Indeed, many studies have found that the effects of tracking in the middle grades depend on the track-level. Using the nationally representative NELS date set, Hallinan and Kubistchek
Unpacking the Meaning of Tracking in Eighth Grade Mathematics u u u u u u u u u u u u u u u u u u u u u u u u u u u u u (1999) found that students in a high-tracked eighth grade mathematics class made significantly more achievement gains by the time they reached tenth grade than their general-tracked peers. Students in the lowest track, however, achieved significantly less than general-track students. Similarly, Hoffer (1992) found that eighth grade students in a hightracked mathematics course achieved significantly more and low-tracked students achieved significantly less than non-tracked students, even after controlling for seventh grade achievement. In general, most studies of within-school tracking in eighth grade mathematics have found higher rates of achievement growth among high-tracked students than lowtracked students. Positional advantages and differential achievement growth are not a dichotomy, however, in that achievement is often used to make decisions about future track placement (Useem, 1992). This is especially true when students face curricular turning points, where students can no longer remain in the same track and must choose to move upward or downward (McFarland, 2006). Early tracking decisions, such as those in the eighth grade, can therefore not only disadvantage students in low tracks by relegating them to disadvantaged curricular positions and diminishing their achievement growth, but by also making entry into a high-tracked course less likely.
How Tracking Affects Achievement Many studies have highlighted the effects of tracking on achievement but few have examined how these effects occur. Three different kinds of mechanisms have been identified that may produce the effects of tracking: social, institutional, and instructional (Gamoran & Berends, 1987; Lucas, 1999). We focus in this paper on instructional effects—specifically on the effect of content coverage. Perhaps the most salient instructional aspect of tracking is the fact that tracking differentiates students’ content exposure. This is of course expected, as the purpose of tracking is to separate students into substantively different courses. Many studies, primarily at the high school level, have found that it is precisely because students take different courses that tracking is associated with increased achievement inequality (Gamoran, 1987; Gamoran et al., 1997; Ma, 2000; Rock & Pollack, 1995; Schneider et al., 1998; Stevenson et al., 1994). These different courses provide students with different opportunities to learn specific mathematics content. Many studies posit that the curricular opportunities available in high-tracked classes facilitate higher achievement rates. Little is known, however, about the substantive nature of these differences in opportunities to learn or how they mediate the effects of mathematics tracking—especially in the eighth grade. Some studies have analyzed how different mathematics course sequences may differentially affect achievement. But this can be problematic. There is tremendous content diversity in U.S. eighth grade mathematics courses with the same title,
9
Exploring the Relationship Between Content Coverage and Achievement: u u u u u u u u u u u u u u u u u u u u u u u u u u u u u diversity which makes any attempt to define what might actually be standard for all students difficult (Cogan, Schmidt & Wiley, 2001). Eighth grade algebra in one school may present different content opportunities than eighth grade algebra in another school. Hardly any studies, however, have closely examined how specific mathematics content within the classes mediates the effects of tracking; virtually all large-scale, nationally representative data sets lack this information.ii A study of 48 mathematics classes across seven urban high schools (Gamoran et al., 1997) illuminated how differences in course content mediate the achievement effects of tracking. It, however, focused on the match of content between instruction and test and not the level of the content itself and was isolated to urban schools and was consequently nonnationally representative. Further, it focused on students in grades 9-12. Data from TIMSS allow us a unique opportunity to address these limitations. TIMSS includes a large, nationally representative sample, actual course indicators and achievement results; perhaps most importantly, within course content coverage measures were collected. These data allow us to address the following questions: how does content coverage differ between tracked and non-tracked schools? How does content coverage vary by track position? How does achievement vary by track location and between tracked and non-tracked schools? Lastly, how does a track’s content coverage affect achievement? These questions allow us to explore the role of instructional content on the effects of tracking on achievement at a pivotal point in a student’s educational career, namely eighth grade mathematics.
DATA SOURCES AND METHODOLOGY The data collected as part of the U.S. participation in the 1995 TIMSS were used in this study. The TIMSS represents an opportunity to explore these issues with a nationally representative sample of seventh and eighth grade students that employs a common framework for describing the mathematics content covered in each of the sampled classrooms. The TIMSS sample is unique for the purpose of exploring issues related to tracking because of the within school sampling frame which provides detailed within-school tracking information for all classes and students within the school—not just for those classrooms which were drawn to be in the U.S. sample for TIMSS. This provides a detailed characterization of the tracking structure within each of the randomly sampled schools. In that sense it represents a random sample of the structure of tracking, proportional to the size of the eighth grade population.3 In the U.S. a representative sample of more than 13,000 students in 183 schools was tested and surveyed and their teachers completed lengthy questionnaires about the content of their instruction.2
10
2
After the U.S. as a whole had been stratified, schools were sampled within
Unpacking the Meaning of Tracking in Eighth Grade Mathematics u u u u u u u u u u u u u u u u u u u u u u u u u u u u u
Course Differentiation The TIMSS sample was designed to be representative of the U.S. as a whole but was not explicitly stratified to deal with the widespread tracking policies of many schools. This is a limitation inherent in most other U.S. eighth grade samples as well and is why it is difficult to study the tracking question empirically in a totally suitable way at the national level. The 1995 TIMSS data, although somewhat dated, provide perhaps the only opportunity at this point to adequately explore tracking given our access to the within school class sampling frame, which is not available (at least publicly) for any other nationally representative data sets. Also, combined with the availability of detailed teacher reports of content coverage it is essentially the only data set available for exploring these issues. As part of the within-school sampling procedure, schools listed all of their seventh and eighth grade mathematics classrooms along with the class titles and the list of the students enrolled in each class. This was used to draw the sample but it also provides complete tracking information for the sampled schools. Using this information, it was possible to specify the within-school course-offering structures (Cogan, Schmidt & Wiley, 2001). It is that within-school course offering structure that defines tracks for purposes of this paper. More than 25 different patterns of school course offerings were identified in the sample, based on six types of classes: remedial, regular, pre-algebra, enriched, algebra, and geometry. Each of the six types of classes defines a track in the sense of providing different content opportunities to learn mathematics. The actual number of tracks is probably much larger.3 As very few remedial, enriched, or geometry classes appeared in the actual
3
strata with probabilities proportional to size. TIMSS sampled two eighth grade and one seventh grade mathematics classroom in each selected school and weights were assigned to each student. Sampled student weights sum to the number of U.S. students in the population at that grade (Foy, Rust, & Schleicher, 1996). This procedure yielded a sample of 7087 eighth grade students in 183 schools and 3886 seventh grade students in 179 schools. (Seventh grade students were not tested in four schools.) Additionally 127 seventh grade teachers and 241 eighth grade teachers filled out questionnaires providing data on their content coverage. The response rates for teachers in both grade levels was about 70 percent. By far the most prevalent title for a grade eight mathematics class was simply “math” or “mathematics.” A number of variations on this title were also observed—many of which incorporated the notion of tracking students according to ability. Examples of this approach included “average mathematics”, “basic mathematics”, “advanced mathematics”, “gifted” or “high “ mathematics, “LD mathematics”, “remedial mathematics”, and “resource mathematics” among others. The only other commonly occurring class titles that did not contain either “math” or “mathematics” were “arithmetic”, “pre-algebra” and “algebra.” Courses in some schools carried such unique titles that their content focus and relation to a progressively unfolding mathematics curriculum was unclear (Cogan, Schmidt & Wiley, 2001).
11
Exploring the Relationship Between Content Coverage and Achievement: u u u u u u u u u u u u u u u u u u u u u u u u u u u u u TIMSS sample, a reduced number of course types (regular, pre-algebra and algebra) were employed in these analyses to define tracks and to more fully examine their effects. Based on other data in the study which provides more extensive knowledge of course content, enriched courses were recoded as pre-algebra, remedial as regular, and geometry as algebra (there were only a few such cases). Students in TIMSS were given 90 minutes to respond to one of eight rotated assessment forms. Approximately 150 mathematics items were distributed across the eight forms providing a broad representation of student knowledge of the mathematics studied around the world at eighth grade. The eight forms were rotated within each classroom so that information on all 150 mathematics items was obtained for each classroom. The test was the same for students in both the seventh and eighth grades. Item Response Theory (IRT)-scaled mathematics scores were created across all countries to have a mean of 500 with a standard deviation of 100. In addition to the TIMSS tests, students completed a background questionnaire related to their home environment from which a composite measure of SES was developed, including education level of the parents, the number of education-related possessions in the home, and the number of books in the home (Schmidt & Cogan, 1996).
Cohort Longitudinal Analysis For analysis purposes we made the assumption that the cohort of seventh grade students in a school was essentially the same as the cohort of eighth grade students from that same school other than the eighth grade students being simply a year older and having an additional year of mathematics instruction (see Schmidt et al., 2001). This permits the use of the seventh grade score as a pseudo-pre-measure to examine the effect of tracking on student learning at the eighth grade. Through the school mathematics class tracking forms, the appropriate seventh grade class which served as the feeder to each eighth grade class could be identified. This was necessary since some tracking was also done at the seventh grade. For example, a seventh grade pre-algebra class would be an appropriate feeder to an eighth grade algebra class but not to an eighth grade regular class. Employing the appropriate seventh grade class score as a pre-test for eighth grade achievement at the class level has the impact of allowing the study to explore the effect of tracking on what students learned during eighth grade and not merely on the status of the eighth grade achievement score.4 This could only be done at the class level and not at the individual student level and only after a careful matching of seventh and eighth grade classrooms based on the school tracking form. Given that there was only one seventh grade class sampled per school, out of necessity we imputed seventh grade average achievement scores for additional classrooms necessary to serve as surrogate pre-test measures.5 Previous uses of these data support the validity of this approach (Schmidt et al., 2001).
12
Unpacking the Meaning of Tracking in Eighth Grade Mathematics u u u u u u u u u u u u u u u u u u u u u u u u u u u u u
Content Coverage TIMSS also surveyed the mathematics teachers of the sampled classes. 6 They were asked to indicate the number of periods over the year in which they taught each of 21 mathematics topics. For each content area, teachers checked a box indicating whether they had taught a topic for “1-5”, “6-10”, “11-15”, or “> 15” periods or “not taught” the topic at all during the year.7 Although the focus of this paper is solely on the U.S. practice of tracking, the TIMSS curriculum data from approximately 50 countries provided an empirical non-ideological basis on which to develop an index of topic difficulty. Such a quantitative index is essential for statistical modeling. This index is referred to as the “international grade placement” index or IGP. There is an IGP value for each specific content topic in the taxonomy. The index gives a value between 1 and 12 indicating the grade, averaged across over 40 countries, at which the specific topic received its greatest instructional focus, taking into account the grade at which it was first introduced. This scale has been found to have strong face validity as well as construct validity (Achieve, 2004; Cogan, Schmidt & Wiley, 2001). It seems a reasonable assumption that topics receiving their instructional focus in later grades are more difficult than those receiving their focus in earlier grades, given the hierarchical nature of school mathematics and the fact that this value is estimated over a large number of countries. Thus, the IGP provides an estimate of rigor for each topic, at least in terms of school mathematics. This index was used as a weight to estimate the difficulty of the delivered curriculum as described by teachers. This was done using the data from the teacher questionnaire in which they indicated the number of periods of coverage associated with a set of topics, which was in turn used to determine the content coverage profile over 21 topics by estimating the percent of the school year associated with the topic. These estimated teacher content profiles were then weighted by the corresponding IGP values and summed across all topics. This produced a single value that was an estimate of the level of demand associated with the implemented curriculum in mathematics for each teacher as illustrated in the following equation.
21
i
IGPclass = ∑ (Instruction Time for Topici x IGP for Topici)
Thus the weighted content coverage index is a multi-faceted measure that is based on three distinct aspects of Opportunity to Learn (OTL): 1) the mathematics content itself (topic coverage—yes/no), 2) instructional time for each topic, and 3) rigor or content difficulty (as estimated from international curriculum data). Therefore the IGP measure of the mathematics taught in the classroom is a measure of content-specific OTL defined at the classroom level. The metric of the index is defined in terms of grade levels and as a result is directly interpretable.
13
Exploring the Relationship Between Content Coverage and Achievement: u u u u u u u u u u u u u u u u u u u u u u u u u u u u u
RESULTS The Prevalence of Tracking in U.S. Schools An analysis of the school tracking forms revealed two types of schools. The first type offered a single type of mathematics course to all eighth grade students. The second type of school offered multiple courses or tracks into which different students were assigned. Non-Tracked Schools. Approximately 27 percent of U.S. eighth grade students attended a school in which there was only one course available to them in mathematics. Although these schools might group students into different sections based on ability, they do not formally track students using the definition employed in this paper. The content at least by policy is the same for all students attending eighth grade in that school. This included those attending schools that offered only algebra (4.3 percent); only pre-algebra (.8 percent—including .4 percent of the students who attended school with only an enriched course which we recoded as prealgebra); and only regular mathematics (21.7 percent—including .3 percent who attended school with both regular and remedial courses—the latter recoded as regular) (see Cogan, Schmidt & Wiley, 2001). For these non-tracked schools, content coverage should be the same for all eighth grade students in the same school, at least in terms of official school or district policy, even if there are multiple sections of the same course offered. One might also expect content coverage to be the same across schools that offer the same type of course. However, that is a different issue from tracking, having to do with the absence of national standards and policies of local control. As teachers define the content of their actual instruction, content coverage can and does vary across sections of the same course even within the same school. The same variation can also occur across schools even though they define eighth grade mathematics as the same course. (We explore this issue in a later section). Tracked Schools. The other type of school attended by the vast majority of eighth grade students (73 percent) offered two or more different types of mathematics courses or tracks covering different aspects of mathematics for different eighth grade students. The combinations of tracks offered within a school based on the three course types (which itself is a simplification) are many. For example the popular impression that most tracked schools offer the three basic types of courses including regular mathematics, pre-algebra and algebra was true for only 30 percent of U.S. eighth graders who attended tracked schools. Some schools did offer those three tracks (attended by around one-fourth of all eighth graders) but other schools offered different paired combinations of the three types with the most common being regular mathematics and algebra. This type of school was attended by one quarter (25.2 percent) of the eighth graders.
14
Unpacking the Meaning of Tracking in Eighth Grade Mathematics u u u u u u u u u u u u u u u u u u u u u u u u u u u u u
Track Differences in Content Coverage Previously specific-topic differences were described among the various tracks (Cogan, Schmidt & Wiley, 2001). Here, however, we employ the IGP index as an indicator of overall content demand for the entire year. Recall that the metric of the index is grade level. Statistically significant differences were evident in the IGP index across the three types of courses (whether offered within a tracked or non-tracked school): regular mathematics, pre-algebra, and algebra (p < .0001).viii The estimated contrast of the algebra course with the combination of the prealgebra and regular mathematics courses was statistically significant (see Table 1 for the summary statistics). Using a 95% confidence interval, the estimated value indicated an almost one year difference (.88) between the algebra and the other two types of courses. Perhaps what may be surprising, but is consistent with earlier analyses, is that the estimated confidence interval for the orthogonal contrast between the regular and the pre-algebra classes was not statistically significantly different from zero (p < .06). Thus, in spite of the presumed difference implied by the course titles, this result suggests that, although there may be ability differences defining who is taking which type of course, the difficulty of the content coverage is essentially the same—at least from the international perspective as reflected in the IGP index. The data then imply, relative to the issue posed at the start of this section, that there are real differences in the educational opportunities afforded students in the different types of courses—at least between algebra and the other two course types.
Table 1. Means*, standard deviations*, and sample sizes for schools and classes by type of school and class track Schools
IGP
Classes
N
Mean
Std Dev
N
Non-tracked schools Regular Pre-Algebra Algebra
47
7.28 7.27 6.70 7.51
0.57 0.43 0.65 1.02
85 70 3 12
Tracked Schools Regular Pre-Algebra Algebra Totals
134
7.45 7.11 7.28 8.20
0.84 0.63 0.76 0.75
258 132 67 59 343
181**
International Scaled Score Std Mean Dev 484 93 481 90 522 96 495 110 505 469 517 565
90 79 85 79
Students N 1822 1509 81 232 5124 2506 1356 1262 6946
*Weighted ** Two schools were dropped due to lack of information
15
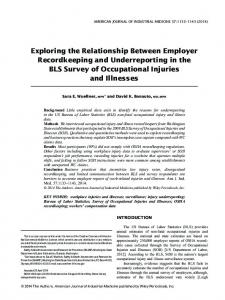
Exploring the Relationship Between Content Coverage and Achievement: u u u u u u u u u u u u u u u u u u u u u u u u u u u u u This issue may also be addressed by taking into account the school structure in which the course occurs. To do this, separate analyses of variance were done on the same IGP index for non-tracked and tracked schools. Overall there were no differences in IGP between tracked and nontracked schools (p < .09). The means were almost identical—7.45 vs. 7.28— which is equivalent to about a two month difference in content difficulty. In tracked schools, the algebra track was statistically significantly different from the other two tracks in content rigor (p < .0001). The difference between the pre-algebra and regular mathematics tracks was also significant (p < .02). The estimated contrasts indicate that the algebra track classrooms were covering content slightly over one grade level higher (1.09) than the regular track and almost one grade level (.92) more advanced than the pre-algebra track. The estimated contrast indicates about a two months (.17) difference for the content difficulty between the pre-algebra and regular tracks. These results are generally consistent with the analysis cited over all schools. Figure 1 reveals that the variation in the IGP index is very large even within each of the three tracks and that the three IGP distributions have extensive overlap. This large variation and overlap is indicative of the point made earlier that course labels can be misleading in terms of what is actually covered. Figure 1. Distribution of IGP by Track Distribution of Multi-Tracked Classroom IGP by Track
9.5 9.0 8.5
Mean District IGP
8.0 7.5 7.0 6.5 6.0 5.5 5.0 4.5
16
REG
PREALG
ALG
For the non-tracked schools the same pattern emerges with respect to algebra. The content difficulty of the coverage for classrooms in schools (n=12) that offer only algebra is not significantly different (p < .14) from the coverage for classrooms (n=70) that are in schools that offer only regular mathematics. That difference is only about a fourth of a year. However,
Unpacking the Meaning of Tracking in Eighth Grade Mathematics u u u u u u u u u u u u u u u u u u u u u u u u u u u u u the average values of the IGP index for the algebra classes offered in non-tracked schools is about three-fourths of a year (p < .03) less rigorous than for the algebra classes offered in tracked schools. On the other hand, the content of the regular mathematics classes in tracked schools is less rigorous by about two months than that of the regular classes in nontracked schools.
Classroom Variation in Content Coverage One way in which to examine how the track structure influences the variation in content coverage across classrooms is by estimating the variance components associated with each level of the school structure. Using the IGP index as a reflection of the complexity of the content coverage and hence in one sense content coverage itself, standard statistical algorithms were used to estimate the variance components associated with schools, tracks within schools and classrooms within tracks for the tracked schools (see Table 2 for a listing of the particular pairings of class types that enabled the estimation of the different variance components).9 In the case of the non-tracked schools, variance components were estimated for course type across schools, schools and classrooms within schools. Tables 3 and 4 present the results of this analysis for non-tracked schools and tracked schools respectively.x
Table 2. Types of 8th grade classes sampled by school 8th grade course offering pattern (Number of Schools=181) 8th Grade School Course Offering Pattern Regular only
Pre-Algebra only
8th Grade Sampled Class Type(s)—Number of Schools Regular 38
Algebra only
Regular/Pre-Algebra
3
Regular/Algebra
23
Regular/Pre-Algebra/Algebra
10
Pre-Algebra/Algebra Totals
74
Pre-Algebra Algebra 2
1 5 5
13
Regular/ Regular/ Pre-Algebra Algebra
Pre-Algebra/ Algebra
7
3 3 3
16
15
16 31
21 10 31
10 6
16
17
Exploring the Relationship Between Content Coverage and Achievement: u u u u u u u u u u u u u u u u u u u u u u u u u u u u u Table 3. Variation in the IGP in non-tracked schools
Source
Estimated Variance
Course Type
.019
Classrooms within schools
.302
Schools within course type Total across all classrooms
.066 .387
Estimated Percentage of Variance 5
17 78
Table 4. Variation in the IGP in tracked schools Source
Estimated Variance
Schools
.214
Classrooms within tracks
.300
Tracks within schools
Total across all classrooms
.336 .851
Estimated Percentage of variance 25 40 35
Non-tracked schools do not all offer the same course type. Some offer only regular mathematics, some only algebra and very few only prealgebra. Therefore, some of the variation among non-tracked schools in content coverage reflects the fixed differences that stem from the different courses being offered by different schools. The majority of the variance in IGP at the school level reflects variation across schools in which the same course type is offered. This likely results from different interpretations across schools as to what constitutes a course, for example, in regular mathematics (variation which is likely associated with the U.S.’s lack of a national curriculum [see Cogan, Schmidt & Wiley, 2001; Schmidt et al., 1997]. An estimate of the variance among schools in the rigor of the content coverage of eighth grade mathematics suggests that one-fourth of the total variation in the international grade placement of the topics taught is of the cross-school variety. Only about 20 percent of the total cross-school variance is related to the fact that different non-tracked schools offer different courses. The remaining three-fourths of the total variation exists within schools across classrooms, likely reflecting teacher differences in interpretation of what constitutes a particular course, from differences related to the textbook used or some form of ability grouping, or a combination of these differences.
18
The results for the tracked schools as found in Table 4 clearly reflect the impact that tracking has on content coverage. In schools with tracks, 40 percent of the total cross-classroom variation in content coverage, as
Unpacking the Meaning of Tracking in Eighth Grade Mathematics u u u u u u u u u u u u u u u u u u u u u u u u u u u u u indicated by the IGP index, is attributable to track differences. Around 25 percent of the variation is due to school differences in terms of course offerings. Around 35 percent of the variation is attributable to crossclassroom within track within school variation, mostly reflective of teacher differences in interpretation of the content or other adjustments made relative to textbooks or students characteristics. The estimated total across classrooms variation for non-tracked schools (.302) is less than half the size of the same component for tracked schools (.336 + .300). This implies that tracking actually increases the variation in content coverage across classrooms. The increased variation occurs primarily because of the track level, as the actual value of the class component within tracks is essentially the same between the tracked and non-tracked schools, thus increasing the overall cross-classroom variation.
Track Differences in Achievement Since tracking starts in the seventh grade and continues through eighth grade, it is desirable to also look at differences in the gain in achievement over the two year period for different track patterns. Given this goal, the best type of data would be longitudinal data on the same students so that the tracking effect at eighth grade could be separated from prior learning. TIMSS did not provide such longitudinal data, but did provide cohortlongitudinal data. As described previously, we assume no major cohort differences within the same school for students following the same track other than the additional year of schooling (Schmidt et al., 1999, see pp.2930). Using this assumption we paired eighth grade classrooms in each tracked school with an appropriate seventh grade feeder classroom from that same school as defined by the school course offering structure as noted in the tracking form. Here the imputed seventh grade data were used to provide the appropriate seventh grade classroom when none was sampled at that particular school. Four types of paired track patterns were formed. The first pattern was a seventh grade regular mathematics class leading into an eighth grade regular mathematics class, while a second track pattern was where the same seventh grade course led into pre-algebra at eighth grade. The other two patterns both end up with eighth grade algebra. One starts with regular mathematics at seventh grade while the other starts with seventh grade pre-algebra. These were the dominant patterns available in the data. Table 5 shows the average mathematics scores for these four track patterns. The unit for these analyses was the paired classrooms on which two measures were available—the mean seventh grade achievement score and the mean eighth grade score, both averaged over the students in the pair of classrooms and then averaged across all schools with that pattern. For each pattern, the data in the table give three values: the seventh grade mean of the feeder classroom, the eighth grade mean and the gain defined as the difference between the two means.
19
Exploring the Relationship Between Content Coverage and Achievement: u u u u u u u u u u u u u u u u u u u u u u u u u u u u u Table 5. Classroom means for four patterns of mathematics tracks, including their appropriate seventh grade feeder class, and eighth grade gain. Reg 7- Reg 8 Track 7th Grade Regular 8th Grade Mean Mean
462
469
Reg 7—PA8 track
Gain
7
7th Grade Regular 8th Grade Mean Mean
468
517
Reg 7—A8 track
Gain
7th Grade Regular Mean
8th Grade Mean
48
462
550
PA7-A8 track
Gain
7th Grade Pre-Algebra Mean
8th Grade Mean
Gain
88
524
569
45
Obvious differences are apparent in the mean achievement across the two seventh grade tracks and across the three eighth grade tracks. Seventh grade classrooms teaching “regular” mathematics scored around 60 points lower than the pre-algebra classrooms. Correspondingly, there is about an 80 to 100-point difference between eighth grade regular track classrooms and algebra track classrooms with pre-algebra classrooms falling in between (517). This nearly 100-point difference between the algebra and the regular mathematics track at eighth grade represents about a one standard deviation difference in the test score. The difference between the pre-algebra and regular mathematics track was estimated as roughly onehalf of a standard deviation. One important observation from Table 5 is that the difference in mean scores across regular seventh grade classrooms that serve as feeders for the three different eighth grade tracks is trivial. In other words, if a regular mathematics course is all that is available in seventh grade then the sorting process of who takes which kind of eighth grade mathematics does not seem particularly related to seventh grade achievement. Other research on tracking and the assignment of students to a particular mathematics track suggests that these decisions are often based on some estimation of students’ mathematical ability (Oakes et al., 1992). Certainly these data do not support the notion that eighth grade tracking assignments have been made of the basis of differences in prior achievement. This raises the question of what the basis for such assignments was in many of these schools.
20
The estimated classroom level gains point out additional interesting patterns. Very little gain appears to occur in regular eighth grade mathematics classes that have regular seventh grade mathematics as their feeder class. However, large gains of around one-half to almost one full (.9) standard deviation are noted for those students in either an eighth grade algebra or pre-algebra course when coming from a regular seventh grade mathematics course. This is especially true for the algebra course. This result, when combined with essentially no gain from a regular seventh grade class to a regular eighth grade class, calls into question the wisdom of having any student take “regular” mathematics (which is mostly arithmetic) at eighth grade. The differences among the eighth grade track gains were also statistically significant (p < .0001).
Unpacking the Meaning of Tracking in Eighth Grade Mathematics u u u u u u u u u u u u u u u u u u u u u u u u u u u u u The above analyses were done only on the tracked schools. Previously we indicated that IGP differed only slightly between the tracked and nontracked schools on average. Similarly, the difference in eighth grade mean achievement is also small (505 vs. 484)—about two-tenths of a standard deviation difference—but is statistically significant (p < .0001). See Table 1 for the summary statistics related to eighth grade achievement. A more careful examination of the pattern indicates an interaction effect. For algebra classes the 70-point difference in mean achievement between those in tracked schools versus non-tracked schools is significant (p < .003) but the differences in mean achievement for the other two types of courses are not significant. Finally, across the non-tracked schools there were no significant differences in eighth grade achievement for the three different types of courses (p < .38).
Classroom Variation in Achievement The variance components for the achievement scores are of interest here as a comparison to those reported for content coverage. This is true since the issue of tracking is not just about equality in learning opportunities but also about equality in attained learning. Tables 6 and 7 present the results of this analysis. This analysis is again estimated separately for non-tracked and tracked schools. In the case of achievement a fourth source of variation is estimable—student variation within classrooms. In the tracked schools, about 40 percent of the variation in achievement across students is related to track differences. This estimated track component is very similar in magnitude to the 40 percent estimate for topic coverage as defined by the IGP index. For achievement variation, the fourth variance component reflects within-classroom or individual student variability. This component was estimated to be around half of the total variability for both tracked and non-tracked schools. In other countries in TIMSS such as Japan, Korea, Norway and Sweden the estimated variance component for students within classrooms was around 90 percent (Schmidt, McKnight, Cogan, Jakwerth & Houang, 1999, p. 174). Taking into account track differences reduces the classroom component to under 10 percent from the 30 percent earlier reported in ( Schmidt, McKnight, Cogan, Jakwerth & Houang, 1999), where the track component was not estimated. In non-tracked schools, the class component was around one-fourth of the total variation.
21
Exploring the Relationship Between Content Coverage and Achievement: u u u u u u u u u u u u u u u u u u u u u u u u u u u u u Table 6. Variation in the mathematics scaled score in schools having no tracks. Non-Tracked Schools Source Course type Schools Classrooms within schools Students within classrooms Total across all students
Score Variance 011 1328 2179 5074 8531
Score Variance (%) 0 16 25 59
Table 7. Variation in the mathematics scaled score in schools having tracks. Tracked Schools Score Variance
Score Variance (%)
Tracks within schools
3431
40
Students within classrooms
4414
52
Source Schools
Classrooms within tracks Total across all students
0xi
652
8497
0 8
Relationship of Tracking to Achievement The pattern of achievement differences across classrooms indicates that on average the achievement level of a class is related to the track of the class. This is certainly consistent with many other studies cited in a previous section and is not particularly surprising. The analyses presented previously in Table 5 did not control for the selection bias introduced by the fact that students were not randomly distributed across the different tracks within schools. Differences in achievement levels across tracks could be attributed to the selection bias associated with who is counseled into the various tracks or who self-select into them. How to disentangle those effects from other potential effects such as a curriculum effect related to content coverage is difficult. We explore this relationship in several ways using different statistical adjustments in an attempt to understand the nature of the relationship between track as a curriculum issue and student achievement in mathematics. From a policy perspective, the disentanglement of selection bias from other interpretations of track differences is critical. Analyses in a previous section clearly demonstrated content coverage differences across tracks, as reflected in the IGP index. The estimated effects suggest a grade level
22
Unpacking the Meaning of Tracking in Eighth Grade Mathematics u u u u u u u u u u u u u u u u u u u u u u u u u u u u u difference in terms of the profile of topic complexity for the algebra track compared to the other two tracks and previous studies have amplified that difference in terms of specific-topic coverage (Cogan, Schmidt & Wiley, 2001; Schmidt et al., 1999). The critical question remains, are the observed mean level differences in achievement across tracks related to these differences in content coverage? Or do such achievement differences simply reflect an underlying difference in students’ mathematics ability? If these achievement differences are primarily the consequence of the latter, then policies requiring all students to study the profile of topics found in the algebra track might not be particularly effective, at least towards the goal of improving overall mathematics achievement in the U.S. On the other hand, if these curricular differences do play a prominent role in creating the observed achievement patterns, then such a policy would not only seem desirable but prudent. The fact that the profile of topics covered in the algebra track classrooms is more like the profiles found in the classrooms among the top-achieving countries suggests the curriculum-based argument is the more plausible of the two proposed explanations (Schmidt et al., 1999; Schmidt et al., 2001). To explore this issue more fully, a three level hierarchical linear model was fitted separately for the tracked schools. The conceptual model defining the analysis model and the particular choice of variables follows the framework defined in TIMSS (Schmidt, Jorde, Cogan, Barrier, Gonzalez et al., 1996). The three levels included schools, classrooms nested within schools and students nested within classrooms. The track designation was included as a dummy variable at the classroom level. The model also included several covariates at each of the levels in the design. The studentlevel model included racial/ethnic identity (with the contrasts centered on the other category) and the composite SES measure. The class-level model included the appropriate seventh grade pre-measure, mean SES, and track. The school-level model included the school-level mean SES, and three variables derived from the school questionnaire including the percent minority enrollment at the school, the location of the school (rural, suburban, or urban) and the size of the school as measured by the number of eighth grade students. The model was specified as follows: Student Level Model Y = P0 + P1 (White) + P2 (Black) + P3 (Hispanic) + P4 (Asian) + P5 (SES) + Є Classroom Level Model P0 = B0 + B1 (7th grade achievement for feeder class) + B2 (SES) + B3 (prealgebra) + B4 (algebra) + R0 School Level Model B0 = G0 + G1 (% minority) + G2 (8th grade enrollment) + G3 (Rural) + G4 (Urban) + G5 (SES) + U0
23
Exploring the Relationship Between Content Coverage and Achievement: u u u u u u u u u u u u u u u u u u u u u u u u u u u u u Results are presented in Table 8. At the individual student level the racial/ ethnicity identity of the student as well as the SES of the family were significantly related to their performance on the TIMSS test (p < .001). The racial/ethnic estimated coefficients indicated a large negative relationship to achievement associated with being African American or Hispanic American. After adjusting for the student level relationships, the estimated class level model indicated a statistically significant relationship for track even when controlling for the aggregate SES of the class and the mean level performance of the seventh grade feeder classroom (p < .0001). Although not an entirely perfect solution, adjusting for the prior achievement at the class level and the SES both at the class and individual level should remove a substantial portion of the likely student selection bias. This makes the estimated track effects less reflective of selection bias and, therefore, more likely to reflect differences in instruction such as content coverage and/or some other social or institutional effects related to track membership—all of which are related to schooling. The significant track effect is present both in terms of differences between the pre-algebra track and the regular track (p < .0001) as well as in achievement differences between the algebra track and the regular track (p