D'Mello, S.K., Craig, S.D., Gholson, B., Franklin, S., Picard, R.W., Graesser, A.C.: Integrating Affect. Sensors in an Intelligent Tutoring System. Workshop at 2005 ...
Exploring the Relationship between Learner EEG Mental Engagement and Affect Maher Chaouachi and Claude Frasson, Département d’informatique et de recherche opérationnelle Université de Montréal C.P 6128, succ. Centre-Ville Montréal, Québéc Canada H3C 3j7 {chaouacm,frasson} @iro.umontreal.ca
Abstract. This paper studies the influence of learner’s affective states on the well established EEG-mental engagement index during a problem solving task. The electrical activity of the human brain, known as electroencephalography or EEG was registered according to an acquisition protocol in a learning environment specifically constructed for emotional elicitation. Data were gathered from 35 healthy subjects using 8 biosensors and two video cameras. The effect of learners’ emotional states on the engagement index was analyzed as well as their impact on response time variability and performance. Results showed that the engagement index was strongly influenced by emotional states and that the former can be used in an educational setting to reliably assess learner’s engagement. Keywords: Emotion, EEG, mental engagement, ITS
1 Introduction Research on affect modeling and recognition represents a very developed and explored field considering the fact that the precise cognitive mechanisms that underlie and explain emotions are still the subject of much debate. However, few will disagree that emotions are very important and omnipresent in human life. They influence our behavior and play an important role in our every-day decision making processes [1]. Learning activity is also fundamentally related to emotions [2]. Cognitive process such as problem solving and decision making not only depend but are greatly intertwined with the individual’s emotional state [3]. Moreover, emotions are essential actors for creative thinking, inspiration as well as concentration and motivation [4, 5]. Hence, intelligent tutoring systems (ITS) should adapt their communication and interaction with learners with regards to changes taking place in this important affective dimension. A growing body of research in the field of artificial intelligence has identified and reproduced emotions using complex models and physiological sensors. Research in emotional AI for example has enabled computers to recognize emotion from speech [6], facial expressions [7] or a hybrid of both these methods [8]. Other researches tried to recognize affect by analyzing physiological signals like heart
rate, skin conductivity and respiration [9]. In the majority of these papers, emotional states were linked to various physiological manifestations in the forms of patterns with a high accuracy and performance. However, only scarce research has been conducted on studying the impact that affective changes can have on cognitive processes by means of EEG physiological sensors. Nevertheless, in the last few decades, researchers from various scientific communities have made improvements in methodologies and technologies giving insight into the brain and the learner’s physiological activity. Pope [10] at NASA developed an EEG-engagement index based on brainwave band power and applied it in a closed-loop system to modulate task allocation. Performance in a vigilance task improved when this index was used as a criterion for switching between manual and automated piloting mode [10, 11]. We believe that the integration of this index in education greatly enhances the ability of ITS to continuously detect and adjust learning to the user’s level of mental engagement. Indeed one aspect of motivation is engagement which is a necessary condition for effective learning. Several approaches for engagement tracing and detection have been suggested raging from Item response theory models to Bayesian networks [12-15]. Nonetheless, research regarding this engagement index has focused mainly on cognitive aspects. It neglects to take into account the impact that the emotional component has since emotions and cognition are strongly intertwined. Furthermore, this index has barely been used outside the field of automated cognition. To that end, we propose bringing this valuable index into the field of education by establishing its importance in modeling learner’s engagement and emotional state. In order to do so, we will address in this paper the two following research questions: (1) Can the learner’s emotional states have an impact of the evolution of this engagement index? If so, what is their influence on learners’ response time variability? (2) Can this new index, combined with the learner’s emotional state, give useful and valid insight regarding the evolution of learner’s performance? The organization of this paper is as follows: In the first section, we present previous work done in fields similar to our own. In the second section, we lay the grounds on which the core of this paper is based: the computation of the engagement index. In the third section, we detail our experimental methodology. In the fourth section, we present the obtained results and discuss them, in the last section, as well as present future work.
2 Previous Works The integration of physiocognitive data is one of the most important and promising challenges for developing and significantly improving the human interaction with technology by enhancing skill acquisition, performance and productivity in educational, military and industrial fields [16]. Indeed, several physiological sensors were incorporated in various systems for detecting and monitoring emotional and cognitive state changes [9, 17]. Having said that, the most reliable and accurate physiological signal for monitoring cognitive state changes remains the electroencephalogram (EEG). This data has a high level of time resolution and precision. In fact, EEG information and features extracted from Power spectral
distribution (PSD) bands and/or event related potential (ERP) components has served as input for linear and non linear models to identify and classify cognitive changes such as alertness, attention, workload, executive function, verbal or spatial memory and engagement [18]. However, to the best of our knowledge, the closest work we could find relevant to our present research is in bio-cybernetic systems. An EEGbased engagement index was proposed by [10, 19] and used on a closed-loop method to adjust modes of automation according to operator’s level of engagement. Performance improvement was reported using this engagement index for task allocation mode (manual or automated). This mental engagement index however has always been established without taking into consideration the emotional state of the learner. We propose to extend this index into the educational field and refine it by adding an affective analysis. We will start by explaining how to compute the mental engagement index.
3 Computing Engagement Index Before going further, let us summarize in a brief, but concise way, the nature of an EEG signal. EEG, like any electrical signal, is composed of frequencies resulting from electrical neural activity in the brain. These frequencies are often grouped in sequence and are known as bands. Theta band, for example, is the name given to frequencies ranging from 4 to 8 Hz. These bands reflect specific and different cognitive processing abilities in specific areas of the brain [20]. Thus, the computation and analysis of frequency bands within power spectral density (PSD) combined with numerous research on alertness and attention provides a powerful tool for monitoring and mapping mental engagement [20]. As previously mentioned, [10] developed an engagement index using three EEG bands: Theta (4–8 Hz), Alpha (8– 13 Hz) and Beta (13–22 Hz). The ratio used was: Beta / (Alpha + Theta). This ratio was also found as being the most effective when validated and compared to many other indices [19]. In our study, we computed the engagement index by applying a Fast Fourier transformation to convert the EEG signal from each active site into a power spectrum. Bin powers (the estimated power over 1Hz) were summed together with respect to each band in order to compute total power and produce the EEG band ratio. By combined power, we mean the sum of band power computed from each measured scalp site. The EEG engagement index at instant T is computed by averaging each engagement ratio within a 40s sliding window preceding instant T. This procedure was repeated every 2s and a new 40s sliding window is used to update the index. Two main methods exist to help interpret this index: The slope method: the slope of successively derived engagement indexes (every 2s) is computed. More importantly the sign, negative (Low engagement tendency) or positive (high engagement tendency) is also considered. The absolute method: sets an engagement threshold by averaging engagement index values over a period of time prior to testing (baseline). During task performance, engagement index exceeding the threshold is considered positive versus negative for values below the threshold.
We opted to follow the absolute method when evaluating changes in the engagement index. Henceforth, we designed and integrated this method in an experiment that will be discussed in the following section.
4 Experimental Methodology In order to assess any relation between emotions and the evolution of the engagement index, an experiment designed to provoke specific emotional reactions was conducted. In this experiment, two video feeds, an EEG headset and physiological sensors were used to monitor and record the user’s reactions throughout the learning process. All the data was synchronized. This setup is important for our investigation. It permits us to compute, offline, the engagement index from the EEG headset sensors. Furthermore, each computed index can easily be paired with the emotional state of the learner obtained from two separate physiological sensors. This pairing, as discussed in the results sections, will enable us to map and follow the evolution of both these important cognitive and emotional parameters involved in learning. Further widely used parameters were also recorded for the offline analysis, namely question response time as well as a pre and post questionnaires for general evaluation purposes. Before the beginning of the experiment, a 1 minute baseline was recorded for each participant. This widely used technique aims at establishing a neutral emotional and engagement state for comparison. During this time, learners were instructed neither to be engaged nor too relaxed. Learners were then told to respond to three series of ten successive true/false questions. Most of the questions in this experiment were relatively simple and did not require any prerequisite knowledge or specific skills. However, a good level of attention and alertness is required to avoid making easy mistakes because question response time was limited to 20 seconds. Participants were informed that a correct answer was rewarded 1 point whereas a bad or no answer was worth 0 point. The goal set to all the participants was to obtain the highest possible score within the imposed time limit. Apparently obvious questions were designed to mislead learners on purpose. Learners were sometimes so confident of their answer that they would get surprised, frustrated and even upset after discovering that they were wrong. The first series presented general knowledge questions. One sample true/false question would be “Is Rio De Janeiro the capital of Brazil?” The second series pertained to spell checking. Carefully chosen words were presented one by one on the screen. The task is to determine whether the presented word is properly spelled or not. Finally, participants were asked to respond by true or false to a series of logical statements, for example, “If X < Y-2 then X < Y.” After each given answer, the system interacted with learners by sending different textual emotional messages to inform them about the correctness of their response. When a good answer is given, the message was encouraging, for example, “Excellent answer! You seem to be very concentrated.” Conversely, in case of a wrong answer, the message could be empathic or may contain an advice, for example, “I’m sure that you know the correct answer” or “Wrong! You need to be more concentrated”.
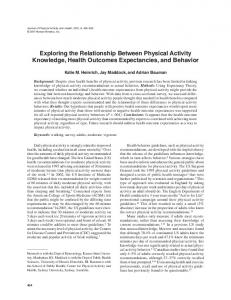
EEG recordings. During data acquisition, learners wore an electro-cap and data was recorded from six active sites, four located on the scalp at locations P3, C3, Pz, Fz as defined by the international 10-20 system and referenced to Cz. The last two actives sites are A1 and A2 and are more typically known respectively as the left and right ear. This specific setup, also called a montage, is technically referred to as a “referential linked ears montage” and is illustrated on Fig. 1. The details and specifics of this montage being out of the scope of the present paper suffice to say that the distinct advantage of a referential montage over other setups is that EEG signal is equally amplified throughout both hemispheres. Furthermore, the “linked-ears” aspect allows us to mathematically obtain a much more precise and cleaner EEG signal by correcting each scalp location signal to that of the middle of the brain. For example, the corrected C3 would become (C3=C3-(A1+A2)/2). Overall, one can say that we obtain a “centrally calibrated equally amplified” EEG signal. Electrode impedance was kept below 5 kΩ. A saline, non sticky proprietary gel from Electro-Cap was also used. The recorded sampling rate was at 256 Hz.
Fig. 1. Channel electrode placement
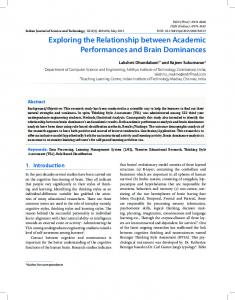
Furthermore, as the brain electrical activity is very weak (in the order of micro volts: 10-6 volts) and usually contains a lot of noise. Thus all EEG signals were amplified and filtered. Sources of noise are static electricity or electromagnetic fields produced by surrounding devices. A 60-Hz notch filter was applied to remove such environmental interference during the data acquisition phase. It is important to specify that a 50-Hz notch filter should be used in Europe where the power distribution (110 volts) differs from that of North America (120 volts). In addition to external noise, the EEG signal can be heavily contaminated by artifacts that originate from body movement or very frequent eye blinks. Therefore, a 48-Hz high pass and 1-Hz low pass filters were applied for artifact rejection. Affect detection with physiological sensors. To detect affective states, learners were equipped with blood volume pressure sensor (BVP) and skin conductance sensor (SC). BVP signals were used to derive the heart rate (HR) whereas SC sensors computed galvanic skin response (GSR). Affective data was recorded at 1024 Hz of sampling rate. These sensors are known to reliably measure specific emotional activations and are widely used for emotional detection. Indeed, as emotions can be characterized in terms of judged valence (pleasant or unpleasant) and arousal (calm or aroused), collected physiological signals were analyzed according to the arousal/dominance emotional space. GSR increases linearly with a person’s level of arousal, while HR has been shown to correlate with valence [21]. We established four quadrants, labeled Q1 to Q4, with regards to signal variations in both HR and GSR (Fig. 2). Thus, learner’s affective state is determined by normalizing HR and GSR variations with regards to the baseline. For example, a positive HR signal and a positive GSR signal will be considered in Q1. Normalization is done by mean-shifting
(subtracting current values from the baseline and dividing the difference with the standard deviation). For readability purposes, we will refer to the mean-shifted normalized values simply as mean HR and mean GSR from now on.
Fig. 2. Lang’s 2D affective space labeled by quadrants.
Participants. Thirty-five learners (13 women) with a mean age of 27.2 ± 6.91 years, ranging from 19 to 46 years, took part in the experiment. Participation was compensated with 10 dollars. All participants signed a written consent form, were French speakers with normal or corrected-to-normal vision and without any neuropsychological disorder or trouble according to self report.
5 Experimental Results and Discussion During the session and for all learners, engagement index was computed every 2s and associated with one of the four quadrants of the 2D affective space. Results will be presented in the following sub-sections. Emotional states impact the index. Our first objective was to study the impact of learners’ emotional state on the evolution of the engagement index. An analysis of variance on the engagement index with the emotional space’s four quadrants as the grouping factor indicated a significant main effect of the emotional state on the index value, F(3, 6064)=115.749, p < 0.01. This result showed that the engagement index was significantly higher when learners’ emotional state was in Q1 (Positive valence and high arousal: M = 0.769, SD = 0.085) than the other quadrants. In fact, positive emotions existing in Q1 (such as joy or excitation) seem to elicit high level of engagement. For example, the excitation arising after a series of successive correct answers might boost the learner’s engagement to maintain a high performance level. A high level of this engagement index was also registered at Q3 (Negative valence and high Arousal: M = 0.743, SD = 0.074) indicating that emotions in this state (ex: confusion or frustration) might also elicit high engagement levels. An obvious example frequently noticed on different sessions, is the following: the learner answers a question being 100% sure of the correctness of his response. The system then reveals that he was wrong, placing the learner in a confusion state. Thus, learner’s engagement increases to recoup and to better perform on the rest of the test. The two lowest mean engagement indexes were registered on Q2 (Positive valence and
negative arousal: M = 0.72, SD = 0.086) and Q4 (Negative valence and negative arousal: M = 0.712, SD = 0.105) suggesting that better engagement levels can be attained when the learner is relaxed than bored.
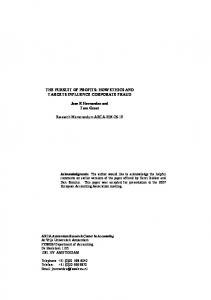
Fig. 3. EEG mental engagement index shift.
The analysis of this result indicated also that higher mean engagement index values are located within high arousal subspace (i.e. Q1 and Q3) and lower mean engagement index values can be traced to low arousal subspace (i.e. Q2 and Q4). In the light of this result, it seems interesting for intelligent tutoring systems wishing to implement this index to take into account the learner’s emotional state when planning an intervention or interaction during any given problem solving task. This will further attune the intervention thus sustaining a stronger motivational state and consequently enhancing performance. Fig. 3 shows an example of one learner’s visible engagement index increase following a positive intervention. We can clearly observe that the positive message was followed by an emotional state shift from Q2 to Q1 resulting in an increase in mental engagement. Learners’ response time: Interaction between engagement and emotion. Our second objective was to study the impact of both the emotional state and the engagement level on response time (RT) variability. To this end, an engagement level variable with two states (high and low) was established during each problem solving task (i.e. answering a question). The engagement level was considered high if the mean engagement index value was above the learner’s engagement baseline value and low otherwise. According to mean HR and GSR, one of the four quadrants of the emotional states’ space was assigned to the learner during answering each question. A two-way ANOVA performed on response time (N=1050) with engagement level and quadrant as grouping factors yielded a significant effect of emotional state on RT variability, F(3, 1042)=6.638, p < 0.01. Results indicated that learners took significantly more time resolving a problem when they were on Q2 (M = 5.926, SD = 0.354) and Q1 (M = 5.380, SD = 0.309) compared to the time spent when they were on Q3 (M = 4.378, SD = 0.220) and Q4 (M = 4441, SD = 0.222). The main effect of engagement level on RT variability was no significant, F(1, 1042)=2.005, p = n.s. nevertheless, the interaction effect was significant F(3, 1042)=49.705, p < 0.05. Results depicted on Fig. 4, showed that compared to all four quadrants, the slowest RT was registered for high and low engagement level in Q1 and Q2 respectively (High engagement: MRT = 6.202, SDRT = 0.493, Low engagement: MRT = 6.203, SDRT
= 0.538). However fastest RT for high and low engagement level was registered in Q4 and Q3 (High engagement: MRT = 4.305, SDRT = 0.279, Low engagement: MRT = 3.987, SDRT = 0.346). Results confirmed also the impact of the arousal dimension on the engagement index discussed on previous subsection. In fact, as shown on Fig. 4, two trends are visible:
Fig. 4. Mean learners’ response time according to their engagement levels and emotional states.
(1) High arousal subspace: When learner emotional sate during a question is Q1 or Q3, his RT is higher when his engagement level is higher compared to when his engagement level is low. (2) Low arousal subspace: When learner emotional sate during a question is Q2 or Q4, his RT is higher when his engagement level is low compared to when his engagement level is high. Engagement index and task performance. Can this engagement index give us useful insight regarding to the learner’s performance? Results presented in this section will point affirmative, although we believe that this is strongly influenced by task requirement. In order to analyze the impact of mental engagement on task performance, measured by the obtained score, two groups were considered: (G1) Learners whose mean engagement level was lower than the neutral baseline throughout the experiment (they were less engaged in the task) and (G2) learners whose level engagement was higher than the baseline. Results from a one-way ANOVA showed that the performance in G2 was significantly higher than in G1: F(1, 33) = 19.782, p < 0.01. Table 2 shows that learners who stayed engaged performed statistically better (M = 19.8, SD = 2.025) on average than those who were less engaged in the task (M = 16, SD = 3.120). Regression model. After studying the relationship between the engagement, emotion, RT and performance, we computed a linear regression analysis between emotional indicators and this index. The chosen dependant variable was the mean engagement index on each question. Four predictors were introduced in the model: (1) mean HR, (2) mean GSR, (3) RT while answering the current question and (4) the learner’s current question result (coded +1 for a good answer and -1 otherwise). The overall model was statistically significant F(4,947)=121.45, p < 0.01; R2 = 0.289. Furthermore, conditional main effect analysis showed an effect of the mean HR (β =- 0.001, p < 0.05), the mean GSR (β= 0.42, p