RADIOENGINEERING, VOL. 20, NO. 1, APRIL 2011
25
Extended Method of Digital Modulation Recognition and Its Testing Anna KUBANKOVA, David KUBANEK Dept. of Telecommunications, Brno University of Technology, Purkynova 118, 612 00 Brno, Czech Republic
[email protected],
[email protected] Abstract. The paper describes a new method for the classification of digital modulations. ASK, 2FSK, 4FSK, MSK, BPSK, QPSK, 8PSK and 16QAM were chosen for recognition as best known digital modulations used in modern communication technologies. The maximum value of the spectral power density of the normalized-centered instantaneous amplitude of the received signal is used to discriminate between frequency modulations (2FSK, 4FSK and MSK) on one hand and amplitude and phase modulations (ASK, BPSK, QPSK, 8PSK and 16QAM) on the other hand. Then the 2FSK, 4FSK and MSK modulations are classified by means of spectrums. The histograms of the instantaneous phase are used to discriminate between ASK, BPSK, QPSK, 8PSK and 16QAM. The method designed was tested with simulated and measured signals corrupted by white Gaussian noise.
In recent years, various methods for modulation classification have been developed. P. Li, F. Wang, and Z. Wang developed a method that is able to recognize 4ASK, 8ASK, 8QAM, BPSK, QPSK, and 8PSK [3]. Their approach combines high-order cumulants with subspace decomposition. All recognized types of modulation have a correct classification probability of more than 90%, when the signal-to-noise ratio (SNR) is 10, 15, and 20 dB. However, when SNR is less than 10 dB, this method does not provide satisfactory results.
Keywords
A. K. Nandi, and E. E. Azzouz introduce two algorithms for analog and digital modulation recognition [5]. The first one utilizes a decision-theoretic approach in which a set of decision criteria for identifying different types of modulations is developed. In the second algorithm the artificial neural network is used as a new approach in the modulation recognition process. They recognize the 2ASK, 4ASK, 2FSK, 4FSK, BPSK, and QPSK signals. Sample results have been presented for SNR of 15 and 20 dB only. In the decision-theoretic algorithm it is found that the overall success rate is over 94% for a SNR of 15 dB while the overall success rate in the artificial neural network algorithm is over 96% for a SNR of 15 dB.
Modulation recognition, modulation classification, spectrum, instantaneous phase, modulation features.
1. Introduction In connection with the requirement for faster and more reliable communication, the digital processing methods and digital communications are mainly used. Together with the rapid growth of cellular technologies, PCS (Personal Communication Services) and WLAN (Wireless Local Area Network) services in the last decade, a number of different wireless communication standards were proposed and employed, and each of them has its own unique modulation type, access technique, etc. To realize seamless inter-communication between these different systems, a multiband, multimode smart radio system, such as software radio, is becoming the focus of commercial and research interests. The automatic modulation classification technique, which is indispensable for the automatic choice of the appropriate demodulator, plays an important role in such a multimode communication system [1]. Automatic identification of the type of digital modulation has found application in many areas, including electronic warfare, surveillance, and threat analysis [2].
The algorithm by S. Gangcan, A. Jianping, Y. Jie, and Z. Ronghua utilizes the complexity approach, in which a set of values of Lempel-Ziv complexity for identifying different types of modulations is developed [4]. They recognize 2FSK, 4FSK, 2PSK and 4PSK modulation types. Their results have been presented for SNR of 10 and 20 dB only.
A number of other methods have been published, but they usually rely on the knowledge of some parameters of the received signal, are computationally very intensive, fail with a low SNR, or can distinguish only between amplitude, phase and frequency modulations [6] – [11]. This paper describes a new method of modulation classification, which is based on a decision-theory approach and spectrum analysis. This approach, compared to the previously published ones, exceeds mainly in the higher number of recognizable modulations, no need of knowledge of the received signal parameters, and functionality with low SNR. The simulated and measured results show that our method is more successful compared to the
26
A. KUBANKOVA, D. KUBANEK, EXTENDED METHOD OF DIGITAL MODULATION RECOGNITION AND ITS TESTING
recent other authors’ algorithms referenced above and also to our previously published work [12] and [13]. There we have published recognition methods based on module and phase spectrogram analysis and except that they provide worse results, they require precise determination of symbol length. The approach presented in this paper was presented in [12] and [13] only briefly on a theoretical level and without any verification. There are no probability results obtained either by simulation or by measurement. ASK, MPSK, MFSK, 16QAM, and MSK signals were chosen for the analysis because they belong to the most widely used digital modulations. These modulation types are used in modern radio telecommunication systems (GSM, WiFi, WiMAX, etc.).
2. Modulation Recognition The techniques of recognition that will be proposed in this chapter will be illustrated on simulated signals with the above mentioned modulations and the following parameters. Carrier frequency fc = 10 MHz, sampling rate fs = 100 MHz, and symbol rate rs = 500 kHz. The number of samples per symbol duration is Nb = 200, which can be determined from the symbol rate and sampling rate. The simulation time T was set to 0.2 ms, which corresponds to 100 symbols. All analyzed signals were simulated as bandlimited signals, because every communication system has a definite bandwidth. When a finite SNR is mentioned, it denotes that the signal was corrupted by additive white Gaussian noise.
max max DFTa cn i / N s 2
(5)
where Ns is the number of samples per signal and acn(i) is the value of the normalized-centered instantaneous amplitude at time instants t = i/fs, (i = 1, 2, …, Ns), and it is defined by a cn i a n i 1 , where a n i
ai ma
(6)
where ma is the average value of the instantaneous amplitude ma
1 Ns
Ns
ai .
(7)
i 1
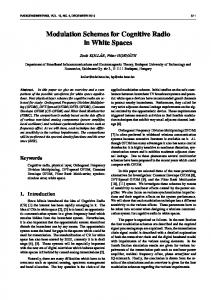
Normalization of the instantaneous amplitude is necessary to compensate the channel gain. The dependence of max on SNR was computed for each of the modulated signals. The results are presented in Fig. 1.
The real recognized signal x(t) can be represented as an analytic signal z(t) which can be expressed as z t xt jy t
(1)
where y(t) is the Hilbert transform of x(t) and j is the imaginary unit. From the analytic signal it is easy to determine the instantaneous amplitude, phase, and frequency of the recognized signal [14], which is the backbone of the proposed method. The instantaneous amplitude a(t) is defined as at z t x 2 t y 2 t .
(2)
The instantaneous phase φ(t) is given by t argz t .
(3)
Finally, the instantaneous frequency f(t) is given by f t
1 d t . 2 dt
(4)
The maximum value of the spectral power density of the normalized-centered instantaneous amplitude γmax of the signal is used for discrimination between frequency modulations (2FSK, 4FSK and MSK) and amplitude and phase modulations (ASK, MPSK and 16QAM) [4].
Fig. 1. Dependence of max on SNR.
The 2FSK, 4FSK and MSK signals have no amplitude changes and max for them is less than the threshold value tr(max) and decreases with increasing SNR. The bandlimited MPSK, ASK and 16QAM signals have amplitude changes; max for them is larger than tr(max) and increases with increasing SNR. This threshold value has to be determined appropriately in order to discriminate between the two modulation groups. While decreasing the SNR, the values of max for various kinds of modulation converge. That is why at SNR = 0 dB tr(max) was set to the value 4. From Fig. 1 it is apparent that the curves corresponding to the 2FSK, 4FSK and MSK signals fall below the chosen threshold level tr(max) = 4. This threshold level remains the same for signals with various parameters (symbol rate, carrier frequency, sampling rate). Then the spectrum analysis was used to discriminate between 2FSK, 4FSK and MSK. The power spectrum of MSK signal has only one maximum (carrier frequencies are very close to each other), the spectrum of 2FSK signal has two maximums, which correspond to two carrier fre
RADIOENGINEERING, VOL. 20, NO. 1, APRIL 2011
quencies, and the spectrum of 4FSK signal has four maximums, which correspond to four carrier frequencies. By a suitable algorithm we can count the number of these maximums and classify the MSK, 2FSK and 4FSK signals. The power spectrums are shown in Figs. 2, 3, and 4 for illustration.
27
NL i uw i
2f c i fs
where uw(i) is the unwrapped phase sequence, (2fci)/fs is the linear component of the instantaneous phase. The centered non-linear components of the instantaneous phase NL are shown for each modulated signal in Figs. 5, 6, 7, and 8.
Fig. 2. Power spectrum of MSK.
Fig. 5. Instantaneous phase NL for BPSK.
Fig. 3. Power spectrum of 2FSK.
Fig. 6. Instantaneous phase NL for QPSK.
Fig. 4. Power spectrum of 4FSK.
The instantaneous phase analysis was used to discriminate between ASK, BPSK, QPSK, 8PSK and 16QAM signals. The centered non-linear component of the instantaneous phase NL was analyzed for this purpose.
(8)
Fig. 7. Instantaneous phase NL for 8PSK.
28
A. KUBANKOVA, D. KUBANEK, EXTENDED METHOD OF DIGITAL MODULATION RECOGNITION AND ITS TESTING
As is apparent from the figures, the phase of BPSK signal stays around two constant values, QPSK around four, 8PSK eight, and 16QAM twelve. The phase of ASK signal remains around only one phase value. For the analysis of instantaneous phases, their histograms were calculated. The one, two, four, eight and twelve maximums occur in phase histograms, which correspond to the number of phase values in the signals.
3. Testing with Simulated Signals The recognition method designed was verified with signals corrupted by additive white Gaussian noise. The results at SNR of 1 and 15 dB are presented in Tab. 1 and 2 respectively.
Fig. 8. Instantaneous phase NL for 16QAM. Signal modulation ASK 2FSK 4FSK MSK BPSK QPSK 8PSK 16QAM
ASK 98.5% -
2FSK 100% 1.5% -
4FSK 98.5% -
Deduced modulation type MSK BPSK 1.5% 100% 100% -
QPSK 100% 0.5% -
8PSK 99.5% 12%
16QAM 88%
8PSK 28% 9% 12.5%
16QAM -
Tab. 1. Confusion matrix for simulated signals with SNR = 15 dB. Signal modulation ASK 2FSK 4FSK MSK BPSK QPSK 8PSK 16QAM
ASK 90.4% 1% 0.6% 3.5% 5% 6%
2FSK 98% 0.4% 0.8% -
4FSK 1% 99% -
Deduced modulation type MSK BPSK 9% 98.6% 0.2% 100% 3.5% 22% 17.5% 33.5% 45%
QPSK 0.6% 0.4% 43% 35% 36.5%
Tab. 2. Confusion matrix for simulated signals with SNR = 1 dB.
The method designed recognizes ASK, 2FSK, 4FSK, MSK, and BPSK signals with high probability (>90%) in signals with SNR = 1 dB. QPSK can still be recognized correctly with SNR = 1 dB in most cases providing that enough signal elements were analyzed. 8PSK requires SNR of at least 10 dB and 16QAM ca 15 dB for a reliable classification. Of course, the 16QAM is not suitable for a channel with low SNR and a more robust modulation shall be used in this case.
4. Testing with Measured Signals The recognition method proposed was also verified by measurement on real signals. The test setup is shown in Fig. 9. The modulated signals were generated by R&S®SMU200A Vector Signal Generator with upper frequency limit of 3 GHz. The carrier frequency of modu-
lated signals in common communication systems with digital modulations is hundreds of MHz or units of GHz. It is not easy to digitize signals at such high frequencies. Thus the AOR SR2200 wide-band receiver with input frequency range of 25 MHz to 3 GHz was used to downconvert the signals from radio frequency to intermediate frequency (IF) of 10.7 MHz. IF signals were digitized by Agilent MSO9104A oscilloscope and transferred to computer where they were recognized by the method described above. Generator
Receiver
R&S®SMU200A
AOR SR2200
Digitizer Agilent MSO9104A
Fig. 9. Configuration of the test setup for modulation recognition.
The generator used provides wide range of signal settings including adding noise, multipath propagation, and
RADIOENGINEERING, VOL. 20, NO. 1, APRIL 2011
other interferences. Thanks to the possibility of simulating non-ideal signal properties it was possible to connect the generator and the receiver directly by a cable without a necessity to use antennas. We generated ASK, 2FSK, 4FSK, MSK, BPSK, QPSK, 8PSK, and QAM16 signals with symbol rates 20 kHz, 100 kHz, and 1 MHz and carrier frequency 1.5 GHz. The receiver except the translation to IF also reduced the signal bandwidth to approximately 6 MHz, and filtered out the out-of-band noise, which resulted in improved recognition accuracy. It was found out that the signal bandwidth must be at least 6-times wider than the symbol rate and thus bandwidth limitation of the IF output results in the maximum usable symbol rate of 1 MHz. Anyway this value can be suitable in most cases. Analyses also showed that the carrier frequency must be at least four times higher than the symbol rate, which is fulfilled here (10.7 MHz > 4 MHz). The necessary oscilloscope sampling frequency can be derived from the maximum symbol rate. It was also found out that the minimum number of samples per symbol for correct recognition is 200 and thus the minimum
Signal modulation ASK 2FSK 4FSK MSK BPSK QPSK 8PSK 16QAM
ASK 100% -
2FSK 100% -
4FSK 72% 17% -
29
sampling frequency is 200 MSa/s. The oscilloscope was set to the sample rate of 200 MSa/s and the averaging was enabled which ensures an equivalent of at least 12-bit conversion accuracy. The memory depth was chosen regarding the lowest possible symbol rate. The system requires at least 100 symbols for correct recognition and for a lowest symbol rate of 10 kHz the memory depth is 1 MSa. The results of real signal recognition are shown in Tab. 3 and 4. The results with measured signals are comparable with the simulated ones. For higher SNR (15 dB) the measured signals 4FSK, MSK, 8PSK, and 16QAM are correctly recognized only with slightly lower probability than the simulated ones. ASK, 2FSK, BPSK, and QPSK are recognized correctly with 100% probability. Measured ASK is recognized even better than simulated. For lower SNR (1 dB) the results with measured signals are again only slightly worse in most cases. On the other hand, measured 8PSK signal is recognized more successfully than the simulated one and the probability of correct recognition of ASK, BPSK, and QPSK signals is even 100%.
Deduced modulation type MSK BPSK 28% 83% 100% -
QPSK 100% 11% -
8PSK 89% 28%
16QAM 72%
8PSK 38% 15%
16QAM 12% -
Tab. 3. Confusion matrix for measured signals with SNR = 15 dB. Signal modulation ASK 2FSK 4FSK MSK BPSK QPSK 8PSK 16QAM
ASK 100% -
2FSK 83% 28% -
4FSK 57% 17% -
Deduced modulation type MSK BPSK 17% 15% 83% 100% 12% 53%
QPSK 100% 38% 32%
Tab. 4. Confusion matrix for measured signals with SNR = 1 dB.
5. Conclusion A method for recognition of digital modulation of signals was presented. In the first step frequency modulations are discriminated from amplitude and phase modulations by the maximum value of the spectral power density of the normalized-centered instantaneous amplitude of the
received signal. Then the type of frequency modulation is classified by means of spectrums and the type of phase or amplitude modulation is determined by the histograms of the instantaneous phase. This approach distinguishes from the previously published ones mainly in the higher number of recognizable modulations and no necessity of knowledge of signal parameters. The verification with simulated and measured signals proved the correct functionality of the method even with noisy signals.
30
A. KUBANKOVA, D. KUBANEK, EXTENDED METHOD OF DIGITAL MODULATION RECOGNITION AND ITS TESTING
Acknowledgements This work was supported by the Ministry of Education of the Czech Republic research project No. MSM0021630513, by the Czech Science Foundation project No. GP102/09/P626, and by the Brno University of Technology project No. FEKT-S-10-16.
References [1] DAI, W., WANG, Y., WANG, J. Joint power estimation and modulation classification using second- and higher statistics. In WCNC 2002 - IEEE Wireless Communications and Networking Conference. Orlando (FL, USA), 2002, no. 1, p. 767 – 770. [2] HONG, L., HO, K. C. Identification of digital modulation types using the wavelet transform. In MILCOM 1999 - IEEE Military Communications Conference. Atlantic City (New Jersey), 1999, no. 1, p. 427 – 431. [3] LI, P., WANG, F., WANG, Z. Algorithm for modulation recognition based on high-order cumulants and subspace decomposition. In Proceedings of ICSP2006. Vienna (Austria), 2006.
[11] KAVALOV, D., KALININ, V. Improved noise characteristics of SAW artificial neural network RF signal processor for modulation recognition. In Ultrasonics Symposium. Atlanta (GA, USA), 2001, p. 19-21. [12] KUBANKOVA, A., KUBANEK, D. Methods of digital modulation recognition and their testing. In 14th WSEAS International Conference on Communications. Corfu (Greece), 2010, p. 234-237. [13] KUBANKOVA, A., KUBANEK, D. Algorithms of digital modulation classification and their verification. WSEAS Transactions on Communications, vol. 9, no. 9, September 2010, p.563-572. [14] JAN, J. Digital Signal Filtering, Analysis and Restoration. IEE Press London, 2000. ISBN 0 85296 760 8, 407 p. [15] XIONG, F. Digital Modulation Techniques. London: Artech House, 2000. ISBN 0-89006-970-0. [16] YU, Z., SHI, Y. Q., SU, W. M-ary frequency shift keying signal classification based on discrete Fourier transform. In MILCOM 2003 - IEEE Military Communications Conference. Boston (MA, USA), 2003, p. 1167 – 1172. [17] HATZICHRISTOS, G., FARGUES, M. P. A hierarchical approach to the classification of digital modulation types in multipath environments. In Conference Record of the Thirty-Fifth Asilomar Conference on Signals, Systems and Computers. Pacific Grove (CA, USA), 2001, p. 1494-1498.
[4] GANGCAN, S., JIANPING, A., JIE, Y., RONGHUA, Z. A new key features extraction algorithm for automatic digital modulation recognition. Wireless Communications, Networking and Mobile Computing, 2007, p. 2306 – 2309. [5] NANDI, A. K., AZZOUZ, E. E. Algorithms for automatic modulation recognition of communication signals. IEEE Transactions on Communications, 1998, vol. 46, no. 4, p. 431-436. [6] YAQIN, Z., GUANGHUI, R., XUEXIA, W., ZHILU, W., XUEMAI, G. Automatic digital modulation recognition using artificial neural networks. In IEEE Int. Conf. Neural Networks & Signal Processing, 2003. [7] WU, Z., WANG, X., GAO, Z., REN, G. Automatic Digital Modulation Recognition Based on Support Vector Machines. [8] HUNG, C.Y., POLYDOROS, A. Likelihood methods for MPSK modulation classification. IEEE Trans. on Communication, COM 1995, vol. 43, no. 2/3/4, p. 1493–1503. [9] SILLS, J. A. Maximum-likelihood modulation classification for PSK/QAM. In MILCOM 1999 - IEEE Military Communications Conference. Atlantic City (New Jersey), 1999, p. 217-220. [10] LOPATKA, J., PEDZISZ, M. Automatic modulation classification using statistical moments and a fuzzy classifier. In Proc. of the 5th WCCC- International Conf. on Signal Processing 2000. Bejing (China), 2000, p. 1500-1506.
About Authors Anna KUBANKOVA was born in 1983 in Izhevsk, Russian Federation. She graduated at the Faculty of Instrumentation Engineering, Izhevsk State Technical University, in 2005 and received Ph.D. from the Brno University of Technology (BUT), in 2008. Since 2008, she has been an assistant professor at the Dept. of Telecommunications, BUT. Her research interests include signal processing and digital modulation recognition. David KUBANEK was born in 1978 in Prerov, Czech Republic. He graduated at the Faculty Electrical Engineering and Communication, BUT in 2002 and received Ph.D. from the same university, in 2006. Since 2006, he has been an assistant professor at the Dept. of Telecommunications, BUT. His research interests include active filters, analog and digital signal processing, and digital modulation recognition.