Hypothesis and Theory published: 15 February 2018 doi: 10.3389/fsufs.2018.00003
E
Jan-Olof Drangert1*, Karin Tonderski2 and Jennifer McConville3 1 Department of Thematic Studies—Water and Environmental Studies, Linköping University, Linköping, Sweden, 2 IFM Biology, Linköping University, Linköping, Sweden, 3 Department of Energy and Technology, Swedish University of Agricultural Sciences, Uppsala, Sweden
Edited by: Paula Alvarenga, Instituto Superior de Agronomia (ISA), Portugal Reviewed by: Ariel A. Szogi, Agricultural Research Service (USDA), United States João Coutinho, University of Trás-os-Montes and Alto Douro, Portugal *Correspondence: Jan-Olof Drangert
[email protected] Specialty section: This article was submitted to Waste Management in Agroecosystems, a section of the journal Frontiers in Sustainable Food Systems Received: 03 November 2017 Accepted: 24 January 2018 Published: 15 February 2018 Citation: Drangert J-O, Tonderski K and McConville J (2018) Extending the European Union Waste Hierarchy to Guide Nutrient-Effective Urban Sanitation toward Global Food Security—Opportunities for Phosphorus Recovery. Front. Sustain. Food Syst. 2:3. doi: 10.3389/fsufs.2018.00003
With growing urbanization cities become hotspots for nutrients. Food items are imported, and food residues, including excreta and not-eaten food, are often exported to landfill sites and water bodies. However, urban sanitation systems can be designed to achieve a high degree of nutrient recovery and food security while counteracting current nutrient resources depletion, environmental degradation, and wasteful energy use. This article illustrates how an extended solid waste hierarchy also including human excreta and wastewater can guide actions to save and recover phosphorus (P) by the three sectors: food industry, households, and waste utilities. P use in diets and agricultural production is not part of the analysis, despite the potential to save P. Novel systems thinking and material flow analysis show that waste prevention can replace over 40% of mined P presently used for making fertilizers. Reuse and recycling of P in excreta and food waste can replace another 15–30%, depending on P efficiency from mine to plate. Keeping excreta separated from other wastewater facilitates such measure. Incineration and land filling are deemed the least appropriate measures since mainly P is recovered in the ashes. The European Union (EU) waste management policy is analyzed for real barriers and opportunities for this approach. The EU Parliament policy guidelines were watered down in the EU Commission’s Directives, and today most biowastes are still being landfilled or incinerated instead of recovered. An anticipated overcapacity of incineration plants in Europe threatens to attract all combustible materials and therefore, irrevocably, reduce nutrient recovery. On the other hand, reduced generation and enhanced recovery can delay exhaustion of P resources by several centuries and simultaneously reduce environmental degradation. Keywords: biowaste, European Union waste hierarchy, food security, human excreta, nutrient reuse/recycling, phosphorus, urban sanitation
INTRODUCTION This article addresses the urban challenge to recover nutrients contained in organic solid and liquid waste (including human excreta) for agricultural use. The focus is on developing measures based on an “extended waste hierarchy” and life cycle thinking to improve the existing management of nutrient-rich waste in order to close the loop between urban food consumption and rural food
Frontiers in Sustainable Food Systems | www.frontiersin.org
1
February 2018 | Volume 2 | Article 3
Drangert et al.
Extended Waste Hierarchy to Recycle P
production. Estimates are made of the potential to replace a substantial part of the mined phosphate rock in fertilizers and thus secure future supply of phosphorus (P). The European Union (EU) policy on waste management is used as a case to indicate barriers and opportunities. The framework can assist stakeholders to formulate policies and strategies to implement and assess resource-effective and ecologically sustainable nutrient management systems. The production and consumption of food have fundamentally changed during the last century and so has the handling of foodrelated wastes in its widest sense. A century ago, a majority of the population was engaged in food production (Krausmann et al., 2008). Today, less than 5% of the population in highincome countries produces food for the other 95%. Furthermore, urbanization and life style changes have increased the geographical and psychological distance between food production in rural areas and food consumption in urban areas. This trend has been reinforced by global trading of food commodities. Today, the food we consume may have been produced far away, possibly in another country. As a result of these disconnections, urban food waste and human excreta, which were traditionally returned to food production, are now largely landfilled or contribute to eutrophication of water bodies (Senthilkumar et al., 2012) while imported food, animal feed, and mineral fertilizers compensate for reduced locally available nutrients. With a global population approaching 10 billion, we need for the first time in history to consider the global availability of resources. Rockström et al. (2009) introduced the concept of planetary resource boundaries providing a novel synthesis of the most pertinent global environmental challenges by analyzing the risk of crossing critical “tipping points” of the Earth system’s processes. They identified nine boundaries: climate change, atmospheric aerosol loading, ocean acidification, chemical pollution, stratospheric ozone depletion, nitrogen and P cycles, biodiversity loss, global freshwater use, and land use change. On a global scale, three resource boundaries have already been crossed (biodiversity loss, nitrogen cycle, and P cycle). Quantitative measures for three other boundaries are in the process of being developed (Steffen et al., 2015). The design and management of the urban sanitation sector impact most of the nine boundaries, not least those related to nutrient cycles and water resources. Various measures are available for key stakeholder groups to keep the sanitation system within a “safe operating space” for nutrients. In coming decades, the availability of nutrients, not least P, will be crucial for food security (Cordell et al., 2009a,b). Over the last two decades or so, food production in many OECD countries has partly relied on P accumulated in the soil from earlier overdosage. In addition, European livestock in countries with high livestock densities (e.g., Netherland, Malta, Belgium, Cyprus, and Denmark) continue to be fed by feed imported from the South, while the manure remains in Europe, resulting in an indirect import of nutrients (Senthilkumar et al., 2012; Eurostat, 2017). This has, temporarily, resulted in a reduced demand for P fertilizers in the North—e.g., the use levels in 2015 were below 50% of the amount spread per hectare in 2006 in Belgium, Croatia, Italy, and Netherlands—which in turn has helped to keep mineral fertilizer prices from escalating (Eurostat, 2017).
Frontiers in Sustainable Food Systems | www.frontiersin.org
However, the use of commercial P fertilizers is already increasing in some European countries, e.g., Bulgaria, Latvia, and Lithuania, thus pushing the price of fertilizers and food. The phosphate rock price tripled between 2007 and 2010, but has been rather stable since then (World Bank, 2017). Therefore, poor countries cannot access mineral P at as affordable cost as was the case during the temporary slump in demand from the North. Sub-Saharan Africa cannot sustain good yields by using only 16.9 kg (11 + 4.9 + 1.5 of NPK) of fertilizers per hectare as it did in 2009 (FAO, 2013). The global average is 109.9 kg/ha (69.3 + 25.8 + 14.8 of NPK). It seems opportune to restructure the entire management of nutrient-rich solid and liquid wastes from urban areas to ensure a sustainable supply of nutrients for future global food security. Global estimates show that, for example, only one fifth of the total 17.5 Mt input of P in mineral fertilizers end up in food consumed by humans and next leaves the human body in urine and feces (Cordell et al., 2009a,b). This indicates substantial losses of P in all steps from the mine to the plate (Schröder et al., 2010). Furthermore, through a redress of present sanitation systems, the more than 3 Mt of P annually excreted by humans could be recovered and used as input for food production. Such changes would open up for a win–win situation with reduced pollution of the environment and replacement of otherwise mined P and energy-demanding mineral nitrogen. Not only have cities moved away from short-loop recovery of material in the previous century to linear flows, but the composition and volume of waste have also overpowered our ability to handle waste streams. Despite efforts to keep industrial and household waste streams separated, as well as not mixing storm water and sewage, most solid wastes are mixed, and much of the liquid waste is found in combined sewers and open drains. This makes recovery and treatment troublesome. However, a paradigm shift is clearly underway in the sector dealing with solid waste (UN-Habitat, 2010; EC, 2012). In this article, the ongoing paradigm shift is extended to include the management of all nutrientrich wastes, also human excreta and wastewater. The focus is on P, and only in passing is nitrogen brought into the picture, while appreciating its high economic and environmental impact. The aim of this study was to illustrate how an extension of the solid waste hierarchy to include human excreta and wastewater can guide actions to achieve reduced generation and enhanced recovery of nutrients. The examples deal with P recovery by taking advantage of recent greater availability of data. First, the steps of an “extended waste hierarchy” are described. Practical examples are given of how the first three steps of management can be implemented by three important sectors, i.e., the food industry, households, and waste utilities, and reintegrated with the agricultural sector. Finally, in order to understand real barriers and opportunities for this approach, an assessment of the current EU waste management policy versus actual practice is outlined.
METHODOLOGY AND THE “EXTENDED WASTE HIERARCHY” This article develops a method to operationalize data from material flow analysis of the recovery of P nutrients in urban waste into
2
February 2018 | Volume 2 | Article 3
Drangert et al.
Extended Waste Hierarchy to Recycle P
an agricultural resource by transforming the urban sanitation system. A systems-based and life cycle thinking approach is applied to manage nutrient-rich urban waste flows. Here, an extended waste hierarchy is introduced and applied to the handling of both solid and liquid nutrient-rich wastes (EC, 2012). Actions begin where waste originates, rather than where it ends up. Previous main focus on “end-of-pipe” treatment is thus avoided, and initial attention goes to controlling the making of products. The five steps of the “extended waste hierarchy” are as follows:
et al., 2007). Using recovered local fertilizers improves national and global food security (Cordell et al., 2009a,b; EC, 2012). The following sections use the example of P recovery to illustrate opportunities for resource recovery through application of the first three steps in the extended waste hierarchy. Four interdependent sectors play a vital role: industries, households/ eating places, waste handling agencies, and agriculture (EC, 2012; McConville et al., 2015). The agricultural sector plays an important role as a recipient of urban nutrients and provider of food products but is not analyzed here in its own right, as the focus is on urban nutrient flows. Food and feed industry has been singled out because ever-more food and feed are being pre-prepared, and they use P extensively. The only other industry using substantial amounts of mined phosphate is the detergent industry. Households/eating places decide what items to buy and how to dispose of them within a given infrastructure. Waste-handling sanitation systems manage the big waste flows from urban areas.
Step 1: Reduce (a) waste generation and (b) harmful contents in products and flows; Step 2: Reuse the waste more or less as it is; Step 3: Recycle the waste as input to new products (including biogas production); Step 4: Incinerate to extract the energy content in the remaining waste; Step 5: Safely landfill residues remaining after exhausting the previous steps.
POTENTIAL TO RECOVER P IN URBAN LIQUID AND SOLID WASTE
Step 1 is the most important step in the hierarchy. Step 1a reduces generation of solid and liquid waste containing nutrients, and thus, the need to tap mineral nutrient reserves. Perhaps more importantly, Step 1b minimizes harmful and unwanted substances in products and materials that end up in nutrient waste streams. This ensures safer recovery of waste products. By not mixing various waste streams, it becomes both easier and safer to reuse (Step 2) nutrient-rich products right away. For example, human urine may be applied directly on farmland. Some kind of conversion into a new product is required (Step 3) if the desired compounds in the waste are not safe or not in a state that allows reuse. Such recycling will also save on virgin resources. Incineration of organic waste is the next option (Step 4). Incineration is mainly used to reduce the volume of solid waste and to recover some energy. Switzerland has mandated such recycling of P in ash in a law introduced in 2016. However, studies have suggested that when organic waste is incinerated at temperatures above 800°C, the amount of plant-available P in the ashes decreases (Zhang et al., 2001, 2002). Also, all carbon, nitrogen, and sulfur are lost which makes the resulting products less valuable for agricultural use. Putting waste on a landfill (Step 5) should be resorted to only after having exhausted the previous four steps. Currently, the most common practices employed globally for solid waste and wastewater sludge management are Steps 5 and 4, whereas what is needed for food security is to shift the focus toward the first three steps applied to both solid and liquid wastes. Reduced generation of nutrient-rich waste and enhanced recovery of P have wide environmental benefits such as cleaner cities and reduced eutrophication of water bodies. Also, substantial amounts of mine wastes generated as by-products in the mining and processing of phosphate rock are avoided. Likewise, greenhouse gas emissions from the energy-demanding manufacturing of nitrogen mineral fertilizers (often natural gas) are reduced. Thus, replacing mineral fertilizers with local fertilizers derived from slightly processed nutrient-rich solid and liquid wastes produces both environmental and economic benefits (Tidåker
Frontiers in Sustainable Food Systems | www.frontiersin.org
There is no substitute for P in plants and animals, and accessible global resources of phosphate are limited. Thus, there is no reason to waste P and endanger food security (Cordell et al., 2009a,b). The selection of measures below reflects that they will have an impact large enough to be considered in most local circumstances. Quantifications of the impact on P of steps 1–3 of the extended waste hierarchy are collected from the existing research data sources, and the results are indicative. Applying the same methodology while using national data with coherent definitions and known local conditions would allow for more detailed recommendations (Kabbe et al., 2014; Vallin et al., 2016; Van Dijk et al., 2016). The main sources of nutrients in urban wastes are found in excreta, wastewater, and solid organic wastes (Jönsson et al., 2012). Human excreta contains some 80 and 60% of the total amounts of N and P, respectively, leaving a European household (Hellström et al., 2007)—making excreta a critical part of overall urban nutrient recovery. For instance, the annual total content of nitrogen, P, and potassium in all toilet water in Sweden amounts to 20, 50, and 55% of the annually sold mineral fertilizers of N, P, and K, respectively, in the country (Jönsson et al., 2012). Such high figures are expected, since the human body essentially uses the energy in eaten food while the nutrients are excreted (Drangert, 1998). Creating short and down-sized nutrient loops takes time and is likely to require a paradigm shift: from the current focus on waste and wastewater treatment to a system of reducing, reusing, and recycling nutrients. In this way, urban and rural areas would be gainfully reconnected through an intentional nutrient exchange between nutrient-rich urban waste and inputs to food production.
Step 1: Reduce Waste Generation and Harmful Substances
The potential to generate less nutrient-rich waste (Step 1a) varies greatly between countries and social groups and so does use of
3
February 2018 | Volume 2 | Article 3
Drangert et al.
Extended Waste Hierarchy to Recycle P
P additives in food and animal feed (Schoumans et al., 2015). However, the amount of P in detergents is likely to differ little between countries. An important option to generate less nutrient waste is through lifestyle changes. A meat-based diet requires about three times as much input of P compared to a vegetarian diet. Thus, a reduction of meat and dairy products in the diet would substantially lower the need for mineral fertilizers (Foresight, 2011). However, the present dietary trend is to eat substantially more meat and dairy products. Also, the kind of meat has a bearing on nutrient requirement. The World Bank estimates that producing a kilogram of beef requires three times more grain and oilseeds than a kilogram of pork and five times more than chicken meat (cited in OCP, 2010; Vallin et al., 2016). In a global review for FAO, Gustavsson et al. (2011) concluded that much more food is wasted in the industrialized world than in the developing countries. They estimate that consumers in Europe and North America waste 95–115 kg per year per capita, while the amount is only 6–11 kg in sub-Saharan Africa and South and Southeast Asia. Most losses in high-income countries occur at markets and in households, while low-income country losses occur mainly at the farm level and during transport to market places because of inadequate infrastructure. Current reporting on food wastes addresses different aspects. Gustavsson et al. (2011) estimated that 20–25% of the demand for mined P could come from nutrient waste, excluding savings from changes in diets. Parfitt et al. (2010) concluded that the available data suggest that between 10 and 40% of the total amount of food produced is wasted, but data are quite uncertain, and figures up to 50% have been cited. Quested and Johnson (2009) estimated that about 40% of the household wastage in the UK was due to cooking and serving more food than could be consumed. A recent study in Sweden estimated that about 20–25% of the food wasted in households could be related to packaging, e.g., too big and difficult to empty packages (Williams et al., 2012). Remedial measures taken by food industry, distributors, shops, and households to improve this situation include the following: increasing awareness of the quantity of food wasted and money lost, improving shopping planning, increasing life span of food through proper storage and instructions, and making best use of leftovers (JRC, 2011). In addition, P is widely used as an additive in food as a stabilizing or preserving agent or to influence taste. It is also used in animal feed to enhance growth. Winger et al. (2012) cited several studies suggesting that 50% of the daily P intake in the Western world is from food additives. At the same time, research has shown that added inorganic phosphate salts may have negative health impacts ranging from liver problems to fragile bones and arteriosclerosis (Calvo and Uribarri, 2013). A sharp reduction in the use of additives could lower the demand for mined phosphate rock (Schoumans et al., 2015) and have positive impacts on human and environmental health (Vallin et al., 2016). Since 1950s, manufacturers of detergents have used phosphate salts as an active ingredient to remove dirt. In a move to save on P resources and reduce eutrophication of water bodies, the EU banned the use of phosphates and limited the content of other P compounds in consumer laundry detergents from 30 June 2013.
Frontiers in Sustainable Food Systems | www.frontiersin.org
A global ban on P in detergents would reduce the mining of rock phosphate by some 7–8% (Cordell et al., 2009a,b). Manufacturers can replace P with harmless zeolite in combination with other chemicals such as polycarboxylates, which have the same positive washing effect as the phosphate compounds. Therefore, customers see no difference in washing results. The recovery rate of nutrients in organic waste and wastewater can only be improved if the waste generated is of good enough quality (Step 1b), with chemical and pathogen concentrations close to or below background levels (Foresight, 2011). However, national legislation on chemicals is seriously lagging behind with control of new substances entering the market. For instance, the EU Chemicals Agency (ECHA) leaves most of the evaluation of health and environmental risks to the industry itself according to rules outlined in the REACH regulation (ECHA, 2007). ECHA estimates that hundreds of new chemical substances are registered every year and, already after the first preregistration phase in 2008, 143,000 chemicals were listed as being used in the EU (Hahnkamper-Vandenbulcke, 2017). For example, there are more than 3,000 active human and animal pharmaceutical substances that may end up in the waste stream (Weiss et al., 2016). Another dimension of the problem is the large stocks of metals in current urban infrastructures and buildings that will cause long-term emissions of potentially harmful compounds such as heavy metals that may end up in the organic waste (e.g., Gerst and Graedel, 2008). Waste and wastewater utilities are strategically positioned to become watchdogs over harmful waste content that hampers recovery. Utilities can notify chemical agencies on problematic ingredients and thus contribute to reduced use of such compounds (Bergbäck and Jonsson, 2008). The task to replace harmful chemicals with safer ones or with safer alternative technologies not entailing the use of such chemicals is formidable (ECHA, 2007). To achieve this, Kümmerer (2013) urged that chemicals should be designed to comply with both the application and environmental standards along their life cycle. There is scope to reduce the number of harmful substances and substitute hazardous ones with non-toxic ones or fast degrading compounds (Kümmerer, 2007; Bergbäck and Jonsson, 2008; Boxall, 2012). The basic design principle for a sanitation infrastructure should be to keep both nutrient-rich organic waste and excreta (blackwater and urine) separated from harmful substances. Then, each flow becomes easier to recover, treat, and utilize. The changed composition of toilet paper illustrates a successful example of how waste quality can be improved. In 1990s, manufacturers of toilet paper stopped using toxic bleach agents (chlorine gas and hypochlorite) to whiten toilet paper and substituted with the less harmful chlorine dioxide in combination with oxygen-based bleaching agents. The intention was to reduce environmental damage, but at the same time it improved the quality of recovered blackwater and fecal matter and made these more suitable for application on soil. Another example is the EU ban of Bisphenol A in plastic baby bottles and nappies in 2011. Ingestion of this odorless, non-visible, and vaguely hormonedisturbing substance may contribute to a number of diseases, before it is released with the urine and may follow the nutrients 4
February 2018 | Volume 2 | Article 3
Drangert et al.
Extended Waste Hierarchy to Recycle P
back to arable land when recycled. A likely next step is to ban some plastic coating materials for food packaging, which releases Bisphenol A to its content of, e.g., meat or margarine. Such ban would reduce the spread of Bisphenol A along the food chain to waste flows.
Japan provides an example of food waste recycling promoted by national policy and legislation. Some 20 million tons of food waste are recycled each year (METI, 2003; MOE, 2010), and most of the recycling is in the form of compost and animal feed products. The recycling presents very clear benefits for Japan, including a decreased dependence on imported fertilizers and animal feed, as well as reduced space for landfills. Japan, like most countries, faces a chronic lack of landfill sites. In 2001, the Japanese government, therefore, introduced a food recycling law under which food-related businesses that discard more than 100 tons of food wastes were to recycle at least 20% of their refuse by 2006 (MOE, 2001). The law applies to the entire food industry, including food production and food-related businesses, e.g., retailers and restaurants. In 2007, the rate of recycling was already 54% for the entire food industry (MOE, 2010). However, there are interestingly large disparities between the different business categories. Relatively large volumes of wastes with stable composition allowed the feed production industry to achieve a high recycling rate of 86%. In contrast, only 40% of the food wastes derived from retailers and restaurants are being recycled. Different wastes have different characteristics and thus differ in expected fertilizer effect (EFMA, 2000). For example, Delin et al. (2012) found that composted food waste from a hotel gave similar wheat yields to chemical fertilizers, but resulted in a slightly lower nutrient uptake by the plants. Clear declarations of the nutrient content of different kinds of processed waste fractions are fundamental to convince farmers and achieve an efficient nutrient recycling. In Sweden, for example, the Swedish Waste Management Agency issues certification rules for quality assurance, in which the content of N, P, K, Mg, S, and Ca is declared for biofertilizers from anaerobically digested organic wastes. Direct application of P-rich sludge and wastewater on agricultural fields is economically favorable, but environmental concerns about possible contamination with undesirable chemicals may restrict this recycling practice (e.g., Lundin et al., 2004; Boxall, 2012). This is a strong argument for the need to reduce the general use of harmful substances in manufactured products (Step 1b) and to keep some waste flows separate. For example, separate pipes for toilet flush water with subsequent treatment allows for recycling of the sludge and effluent on agricultural land knowing that little heavy metals is added compared to applying mineral fertilizers. But operators need to remain vigilant to ammonia release (Fidjeland et al., 2013; Spångberg et al., 2014). Other recycling methods include converting organic waste, such as fecal matter and treated sludge, into a multinutrient fertilizer product through composting and sanitization processes. Alternatively, organic wastes may be digested anaerobically to produce methane gas while retaining the nutrients in the digestate for agricultural use. Such recycled nutrient inputs often save on energy usage in the production and transport of mineral nitrogen and P fertilizers. A renewed interest to increase the nutrient efficiency in meat production is to let earthworms or fly larvae process manure and organic waste into protein-rich animal feed (Sheppard et al., 1994; Lalander et al., 2013). This kind of nutrient recycling is in line
Step 2: Maximum Reuse of Non-Processed Solid and Liquid Nutrient-Rich Waste
If organic waste and excreta are not mixed with contaminants (Step 1b), the nutrients therein can be gainfully recovered and used in agriculture with no other treatment than storage for sanitizing purposes (WHO, 2006). A novel method to dehydrate the urine with wood ash causes a very low loss of nitrogen and reduces volume by 90% which minimizes transport costs (Senecal and Vinnerås, 2017). An example of direct reuse is to collect urine separately from urine-diverting toilets and urinals and apply this urine as it is. Treatment of the urine through the specified storage period ascertains a very low hygienic risk for farmers and produced food items (WHO, 2006). Urine is a balanced fertilizer which can conveniently be spread with the same equipment and techniques being used for spreading liquid manure. In Ouagadougou, the capital of Burkina Faso, over 1,000 urine-diverting toilets have been built. A functional system to collect and store urine was combined with training of gardeners and farmers in how to minimize nutrient losses. The fertilizing value of urine showed comparable results to mineral fertilizers, and acceptance levels among urban farmers were high (Dagerskog et al., 2008). Another example of direct reuse is when pigs and chickens are fed with discarded vegetables collected separately from food markets and food industries. Already sugar factories sell molasses waste as animal feed, while abattoirs and fish industries can grind preheated bones and sell the bone meal as a phosphate fertilizer. However, the use of any animal by-products as animal feed is forbidden by EU regulation (EG no 1774/2002) as part of an attempt to limit the spread of disease. Processing and treatment methods need to be developed in order to guarantee the safety of such reuse. With the right certification systems and supporting regulations, the food industry would be able to commercialize unused materials and production waste for feed and other uses. The potential is high to reuse nutrients in separated organic waste and in wastewater fractions, if the sanitation infrastructure is designed for this purpose. Such reuse would reduce harmful emissions proportionally.
Step 3: Maximum Recycling of Processed Solid and Liquid Nutrient-Rich Waste
Nutrient-rich waste that has not been possible to reuse usually requires conversion to different products of which one or more can be recycled (Schoumans et al., 2015). However, treatment may significantly alter the composition of nutrients in the liquid and solid wastes. For example, composting of organic wastes implies that most of the nitrogen is lost through ammonia volatilization, and in wastewater treatment plants microorganisms convert ammonium in urine to nitrogen gas (nitrification and denitrification).
Frontiers in Sustainable Food Systems | www.frontiersin.org
5
February 2018 | Volume 2 | Article 3
Drangert et al.
Extended Waste Hierarchy to Recycle P
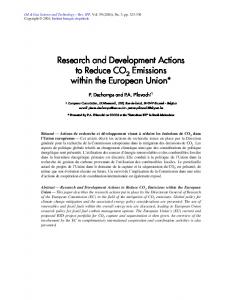
included in the calculations behind the graph in Figure 2. Van Dijk et al. (2016) provided P flow and sink data for EU27. Their primary data from 2005 show that mined P ends up in: fertilizers (78%), feed additives (14%), food additives (2%), and detergents (6%), as shown in Figure 1.
with FAO’s aim to increase insect-based food production in order to feed the growing global population (van Huis et al., 2013).
Prolonged Life of Global P Resources by Recovered Liquid and Solid Wastes
The above briefing on P usage is brought together in a comprehensive format in Figures 1 and 2, in order to estimate the potential recovery of P resources by applying the three initial hierarchy steps. Data from the EU are being used in the calculations below. Food waste includes not eaten food, edible materials such as stale bread or potato skins, as well as inedible materials such as banana skins or egg shells. Excreta are also included since they contain most of the P (and N) in urban waste flows. But, P in biodegradable paper, board, and wood waste is excluded since these flows are already recycled to a large extent for non-agricultural purposes. Garden waste is not considered due to a lack of reliable data; however, this waste is in practice easily composted and recycled on site. European Union data regarding flows of P-rich wastes are steadily improving (Van Dijk et al., 2016) and show that the enduse of mined P is changing substantially over time (Schmid-Neset et al., 2010; Senthilkumar et al., 2012). The purpose of Figure 1 is to show the fate of the original input of mined P and to ascertain that no savings or deductions are left out or duplicated. The calculated values are specifically not concerned with the losses “from the P mine to the table,” but only consider the potential to save and recover the mined P. The losses are estimated and
Step 1: The EU has recently banned the use of P in detergents and therefore the 6% of the mined P can be saved and left in the ground (in green). The authors suggest that food and feed additives are reduced from a combined 16% to 2%, assuming that there remains a valid need for some additives (Step 1a). Hence, the other 14% can be left in the ground. According to Gustavsson et al. (2011) one-third of food is not eaten, and a part of the 26% (1/3 of 78%) of the mined P that is used to produce this food can be saved. The authors propose that it is possible to reduce food waste in the EU from the current 33% to 20%, e.g., by buying less and eating more of the food that is bought and prepared. In this way, approximately 10% [(0.33–0.2) of 78%] of the initial input of mined P is saved and can be left in the ground. A change toward more vegetarian diets could save substantial amounts of mined P in Step 1a, but is not proposed here because such change is deemed difficult to achieve (Foresight, 2011). However, arresting the ongoing increased consumption of meat and milk products may be within reach.
Figure 1 | Potential to recover the phosphorus (P) that ends up in the food products, food and feed additives, human excreta, and detergents with the help of the “extended waste hierarchy.” Green areas = saved/recovered P and red areas = unavoidable losses of P. In Step 1, the term recovery means reduced usage. Note that the percentages are rounded and do not add up across all steps. 1Food waste reduced to 20%, detergents down to zero, and use of additives reduced to 2%. 2 Reuse 90% of all urine, and 30% of remaining food waste from Step 1. 3Recycle 90% of fecal matter and 70% of remaining food waste from Step 2.
Frontiers in Sustainable Food Systems | www.frontiersin.org
6
February 2018 | Volume 2 | Article 3
Drangert et al.
Extended Waste Hierarchy to Recycle P
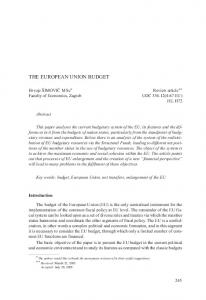
and in most countries the rate is likely to be in the range indicated by the dashed box. With an assumed loss from mine to plate of X%, the amount of P recovered through reuse and recycling in Steps 2 and 3 are as follows: Step 2: Saved P in urine given same food intake with a 90% recovery rate 31 × (100 − X)/100 + saved P in reused food waste (30% of remaining) 30 × (26 − 10)/100 × (100 − X)/100 = (31 + 5) × (100 − X)/100 U. Step 3: Saved P in feces given same food intake with 90% recovery rate 16 × (100 − X)/100 + saved P in recycled waste (70% of remaining) 70 × (26 − 10 − 5)/100 × (100 − X)/ 100 = (16 + 8) × (100 − X)/100 U. The measures in Steps 1–3 have a major impact on the need to mine P irrespective of what assumptions are made about recovery rates. The smaller the losses are from mine to plate, the more can be recovered and replace mined P. Figure 2 shows that measures in Step 1 have the greatest impact and are essentially independent of P-losses from mine to table, while providing the same amount of eaten food. Figure 2 also shows that if, for example, the P-loss is 60% from mine to plate, then only 32% of the currently mined P is needed for the food production. The rest of the currently mined P (68%) is substituted by recovered P and can be left in the ground for future needs. If the P-loss is 80% instead, still only about 43% of present-day mining is required. This saving occurs each year. Therefore, food production is secured and the easily available global P resource will last two to three times longer, and the transgression of the planetary P resource boundary is delayed by several hundreds of years. This is a major reason for the EU to engage in recovery of resources and become a recycling society. Incinerating all organic wastes (Step 4) instead of the abovementioned measures in Steps 2 and 3 could also substitute mined P. Zhang et al. (2002) found that 29–46% of the total P in different ashes from combustion was in plant available form. This indicates that incineration will recover less P than reuse and recycling and lead to a permanent loss of most organic material. Challenges are likely to appear when trying to reap the potential gains described in Figure 2. The next section deals with experiences from the EU when embarking on redesigning mainly urban sanitation systems to become a recycling society.
Figure 2 | Proportion of mined phosphorus (P) for fertilizer production being replaced by P saved from reduced food waste, food/feed additives, and use of detergents (Step 1), reuse of P in urine and food waste (Step 2), and recycling of P in feces and food waste (Step 3) as a function of the percentage losses from mine to plate. The dashed box indicates the interval where most countries are likely to be.
Step 2: All eaten food are subsequently excreted, and 33% of the excreted P is in the feces and 67% in the urine (Drangert, 1998). A well-designed city infrastructure can realistically recover 90% of the P in urine for direct reuse. This recovered amount required 31% of current total P. In addition, the authors suggest that 30% of the food waste remaining after Step 1 (required 5% of the total P) is reused directly in Step 2, e.g., as feed for animals. Step 3: The P in feces or blackwater can—after treatment—be recycled in Step 3. With a well-designed infrastructure an estimated 90% of the P could be recovered. Furthermore, 70% of the food wastes remaining after Step 2 could be recycled in Step 3 (required 8% of the current total P). In the abovementioned case, the same amount of food is eaten, and diets remain the same and are not affected by measures in Steps 1, 2, and 3. Given the assumptions for each step in Figure 1, Figure 2 shows how the potential to save/recover P and to use this to substitute part of the currently mined P. The lowered wastage of food in Step 1 results in a 10% reduced need for P in food production, from 78 to 68%. The saved P in Step 1 can therefore be made available to substitute 44% [30/ (78–10)] of the P needed for today’s level of eaten food (and less food waste). Alternatively, this P could be used for increased food production or be left in the ground to extend the lifetime of mines. The actual recovered amount of P in Steps 2 and 3, on the other hand, depends on the P-efficiency or rate of losses from mine to plate. Such losses are country specific in a wide sense and related to the kind of crop, soil, farming method, animal husbandry, transportation, storage, handling, food industry, etc. (Malingreau et al., 2012; Nykvist et al., 2013; Vallin et al., 2016; Van Dijk et al., 2016). Van Dijk et al. (2016) estimated that for each 1 kg of P output in food required an input of 4–6 kg of mined P; in other words, the P-losses from mine to plate are in the range of 75–85%. These differences in losses are captured in Figure 2,
Frontiers in Sustainable Food Systems | www.frontiersin.org
MANAGEMENT OF NUTRIENT-RICH WASTE IN THE EU CONTEXT Solid and liquid waste management has been on the EU agenda since its inception in 1960s. For instance, the revised EU Waste Framework Directive of November 2008 seeks to position the EU as a “recycling society,” with broad aims “to avoid waste generation and to use waste as a resource” (EC, 2012:13). The Directive introduced a five step “waste hierarchy” putting the highest priority on waste prevention. The EU Parliament (EUP) requested its Commission (EC) to produce a proposal on sustainable use and management of 7
February 2018 | Volume 2 | Article 3
Drangert et al.
Extended Waste Hierarchy to Recycle P
natural resources and wastes already for the environmental program for 2001–2010. However, the EUP noted that “even eight years later no legislative proposal has been forthcoming, which is unacceptable” (EUP, 2011:53). The EUP resolution sets out the steps to make the EU a flagship recycling society, with a simplified harmonized legislation between all sectors (EUP, 2011:50). This resource-effective recycling society was to be based on a solid waste hierarchy, the precautionary principle, and lifecycle thinking to protect human and environmental health (EC, 2011a). The EU roadmap for 2011 set “aspirational targets” and visions to be achieved by 2020: “Waste generated per capita is in absolute decline. Recycling and re-use of waste are economically attractive options for public and private actors due to widespread separate collection and the development of functional markets for secondary raw materials. More materials, including materials having a significant impact on the environment and critical raw materials, are recycled. Waste legislation is fully implemented. Illegal shipments of waste have been eradicated. Energy recovery is limited to nonrecyclable materials, landfilling is virtually eliminated and high quality recycling is ensured” (EC, 2011a:5). More than half-way through the timeframe for achieving the vision, it is worth a look at how well the policy is being put into practice.
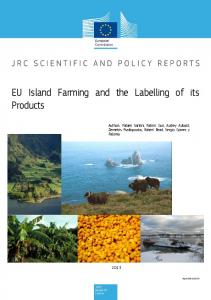
(Step 5) has decreased by about 55%, while incineration (Step 4) has doubled, composting tripled, and recycling (Steps 2 + 3) nearly tripled. These achievements fall short of the road-map targets, in particular since more than half is still being incinerated or landfilled. Furthermore, an estimated 60–70% of the municipal solid waste is biodegradable, more than half of which is wasted on landfills (EC, 2010b). Despite the EU ban on landfilling of organic waste, 40% of the bio-waste was still landfilled in 2010 (EC, 2010b). Eurostat provides data on the kind of waste that is handled. Biowaste comprises “biodegradable garden and park waste, food and kitchen waste from households, restaurants, caterers and retail premises, and comparable waste from food processing plants.” It excludes forestry residues, manure, natural textiles, paper and related products, sewage sludge, as well as by-products of food production that never become waste. Biowaste accounts for more than 30% of solid urban waste or 118–138 Mt annually (EC, 2010b). Furthermore, 42% of food waste originated from households (average 76 kg per capita), 39% from food processing, 14% from food service/catering, and 5% from retail/ wholesale (EC, 2010a). The Waste Framework Directive (EC, 2008a,b) encourages Member States to collect biowaste separately since such waste is considered free of pollutants and needs to be regarded as a valuable natural resource that can be used to produce quality compost. Human excreta constitute a case in its own right, and in no shape is it considered part of biowaste by the EU. Urine and fecal matters are not regulated separately by the EU, apart from being banned in organic farming. The EU has yet to consider the World Health Organization Guidelines on reuse of treated urine and fecal matter in agriculture (WHO, 2006), where WHO applies a combination of risk assessment and risk management
Solid and Liquid Waste Generation and Disposal in the EU
European Union statistics on management of municipal solid and liquid wastes is fragmented and rarely singles out nutrient content. Figure 3 provides an overview of various treatment activities for municipal solid waste. The per capita volume in 2014 is about the same as in 1995, but since 2008 there has been a 10% reduction in waste volumes. Over the 20-year period, landfilling
Figure 3 | Municipal solid waste treatment, EU-27 (kg per capita) (Eurostat, 2016).
Frontiers in Sustainable Food Systems | www.frontiersin.org
8
February 2018 | Volume 2 | Article 3
Drangert et al.
Extended Waste Hierarchy to Recycle P
to control both water-related diseases and exposure/spread of potentially harmful chemicals and pathogens. On the other hand, the EU deals extensively with sewage containing excreta. Modern treatment plants are designed to take care of nutrients in excreta by separating P into the sludge, while other nutrients such as nitrogen and potassium remain dissolved in the effluent. Sewage sludge is governed by the Sewage Sludge Directive (1986) which encourages application on agricultural fields. This Directive (EC, 2013) seeks to regulate the quality and use of sewage sludge. It provides values of allowed concentrations of heavy metals in the sludge and the maximum annual quantities of heavy metals to be introduced into soil intended for agriculture, given the prior concentrations of heavy metals in soils to which sludge is applied. Since the directive was adopted, several Member States have enacted and implemented stricter limit values for heavy metals and set requirements for other contaminants as well to reduce potential human health and environmental risks. Septic tank sludge is classified as waste (code 200304) and is governed by the Waste Water Directive which allows it to be used in agriculture subject to any conditions by the Member State. Milieu Ltd and others estimated that “sludge contributes less than 5% of the total amount of organic manure used on land (most of which is of farm animal origin), and sludge is applied to less than 5% of agricultural land in the EU” (Milieu Ltd, WRC, and RPA, 2008:4). In three EU27 Member States, no sludge is recycled to agriculture, and four other Member States recycle less than 5% of their total sludge production. However, Milieu Ltd and others expected sludge management methods to change between 2010 and 2020 as follows: recycled to land from 42 to 44%, incineration from 27 to 32%, landfill down from 14 to 7%, while other methods remain at 16%.
quality, and to achieve carbon sequestration. However, the EUP remarks that this is not currently promoted by the Directive on Electricity Production from Renewable Energy Sources, which encourages biowaste to be used to replace fossil fuels and thus “actually indirectly encourages incineration” (EUP, 2011:51). The EUP called on the EC to elaborate on an improved system for the management of bio-waste regarding “the recycling of separately collected bio-waste, the use of composting for agricultural and ecological benefit, the mechanical/biological treatment options, and the use of bio-waste as a source for generating energy” (EUP, 2011:53). The EUP deems anaerobic digestion to be especially useful for biowaste because it yields nutrient-rich soil improver and the renewable energy source biogas. Furthermore, the Parliament wants the Commission to use the impact assessment as a basis for preparing a new EU legal framework on biodegradable waste. In addition, the Parliament asked the EC to consider that treated biowaste should be used to conserve organic matter to preserve soil productivity, increasing the soil’s water retention and carbon storage capacity, and complete nutrient cycles, especially for phosphate, by recycling it into the soil. The EC commissioned the EU Joint Research Center (JRC) to address the abovementioned policy guidelines on biowaste. The result was the report “Supporting Environmentally Sound Decisions for Bio-Waste Management—A practical Guide to Life Cycle Thinking and Life Cycle Assessment” (JRC, 2011). The Guide states, initially, that “recycling measures suffer from the waste being easily contaminated, being unstable and having a variable moisture level, and generally being a source of nuisance” (JRC, 2011:15). These recognized problems are addressed only for composting and anaerobic treatment processes. As will be shown in the following examination of the five steps of the waste hierarchy, the Guide frequently ends up indirectly promoting the incineration solution. The Guide deals briefly with waste prevention (Step 1a), the most prioritized method by the EUP and makes the following remark: “One of the reasons bio-waste prevention may not be beneficial for the environment is that bio-waste management can lead to the production of energy and compost. Use of these recovered materials and energy can avoid the consumption of other resources including fossil fuels and other emissions to the environment that may, in some cases, otherwise be necessary. This explains why in some cases preventing bio-waste generation may not always be beneficial for the environment. Chapter 3.2.2 expands on the environmental consequences of bio-waste prevention” (JRC, 2011:15). The Guide does not, however, return to this issue in Chapter 3.2.2. The EC Roadmap to a Resource Efficient Europe addresses Step 1b by writing “avoiding, wherever possible, the use of dangerous chemicals and promoting green chemistry to help protect key resources like soil and water, and making materials and nutrients safer, and easier and less costly to recycle and reuse” (EC, 2011a:6). The Guide avoids this challenge and stresses instead the need to keep biowaste separate from harmful chemicals. But the Guide does not make use of other directives such as the Eco-design Directive, which applies life cycle thinking to product design to optimize their environmental performance, while maintaining their functional qualities (Directive 2009/125/EC). Applying this line of thinking to food products and medicines would have the
EUP Environmental Policy versus a Published Practical Guide
In 2010, the EC reported on the progress of its 10-year program toward strategy flagship status (EC, 2011b) and found large implementation and enforcement differences between Member States and also that “the Strategy has played an important role in guiding policy development. Significant progress has been achieved on a number of fronts, particularly in the improvement and simplification of legislation, the establishment and diffusion of key concepts such as the waste hierarchy and life cycle thinking, on setting focus on waste prevention, on coordination of efforts to improve knowledge, and on setting new European collection and recycling targets” (EC, 2011b:7). Based on such experiences, the new EU environmental strategy will set minimum standards for recycling activities in order to ensure the proper functioning of the internal market for recycling and spreading good practices across the EU, particularly for biowaste derived products (EC, 2011b). With full implementation of existing regulations, the EC anticipates that recycling of solid waste would increase from 38% in 2008 to 49% in 2020. So far, there is no corresponding goal or commitment for biowaste or organic waste. The EUP states that biowaste can contribute to combating climate change by recycling this waste into compost, to improve soil
Frontiers in Sustainable Food Systems | www.frontiersin.org
9
February 2018 | Volume 2 | Article 3
Drangert et al.
Extended Waste Hierarchy to Recycle P
potential to contribute to a safer recycling of nutrients in urban waste. On several occasions, the Guide makes statements about the inappropriateness of recycling methods (Steps 2 and 3) without making a distinction between inputs of clean separated biowaste and mixed inputs. An example relates to compost and digestate and the Guide states that “bio-waste may possess characteristics that require appropriate solutions for its management” with no mentioning of what that refers to JRC (2011). The EU goal is to only incinerate what cannot be recycled (Step 4). However, incineration has been on the rise, even for sludge (Milieu Ltd, WRC, and RPA, 2008). Today, there is an overcapacity of incinerators in some European countries, and an increasing share of all waste is incinerated in sharp contrast to the EU policy objective. Given the high investment cost for incinerators, they are likely to be in operation for many decades and create a technology lock-in effect and retard the implementation of a recycling society. However, the Guide reports no negative effects related to incineration. There is, for instance, no mention of potential problems connected with the process, such as fly ashes occasionally escaping the exhaust gas cleaning system, or the content of metals and salts in slag and ashes. Or more importantly, there is no mentioning that waste incineration permanently withdraws valuable resources (N and carbon) from the nutrient cycles. Instead, the Guide suggests that ashes can be disposed of in multiple productive ways (roads, bunds, etc.) without leaching to the groundwater. Nowhere does the Guide suggest similar alternative end-uses of recycled polluted compost or digestate. The Guide notes that the landfill option (Step 5) is against the EU biowaste policy. However, the Guide states that “new technologies reduce the duration of active operation required at the landfills. In addition, active landfill technologies (i.e. leachate recirculation, waste flushing and air injection) often use the collected gas for electricity and/or heat generation, thus bringing environmental benefits compared to older technologies (the overall environmental value changes according to the efficiency of energy recovery)” (JRC, 2011:30). After having planted this rather positive evaluation of new landfill technologies, the Guide continues “However, it should be stressed that landfilling of biodegradable waste is an option that can only be employed as an interim solution” (JRC, 2011:30). The abovementioned discrepancies between the EC Guide and EUP policy statements indicate the need for a joint focus of the legislative and executing powers. The EC Guide explores and makes full use of the Waste Framework Directive (2008) exemptions to detract from EUP policy recommendations. The exemption states “Member States may depart from this hierarchy for specific waste streams, if this is justified by life cycle thinking on the overall environmental impacts of the different waste management options” (JRC, 2011:13). The EC progress report (2011) on the strategy of prevention and recycling of waste concludes by stating “Without further and complementary initiatives, opportunities will be missed to reduce greenhouse gas emissions and environmental impacts in general, create jobs and meet the future demands for resources” (EC, 2011b:7). Thus, it appears that policy has yet to have a strong bearing on practice. Without a stronger policy to practice link, the long-term objective to become a recycling society will remain a vision.
Frontiers in Sustainable Food Systems | www.frontiersin.org
The quantitative impacts of measures in Steps 1–3 presented in Figure 2 provide a strong support for the EUP policy and strategy. The underlying systems’ thinking deals with detergents and P-additives and provides low-cost improvements of P effectiveness. Figure 2 also indicates potential quantitative impacts of contributions from the agricultural sector as well as mining and food industries to lower the need to mine P for fertilizers. These measures also save most other macro- and micronutrients and organic material in food waste and human excreta. A lower recovery rate for P in Steps 2 and 3 can be achieved by incineration, but in this case all other useful macronutrients (except K) and humus will be lost. The economic value of losses of N is about 10 times higher than the value of recovered P. Therefore, it is costly and irreversible to feed incinerators with food waste and excreta/sludge.
CRITICAL ISSUES FOR NUTRIENTEFFECTIVENESS IN SECURING FOOD PRODUCTION For the first time in history, global sustainable resources use and food security set the scene for the sanitation sector. Supportive guidelines and coherent policy documents are needed to overcome knowledge and perception barriers in order to improve nutrient resource effectiveness within key sectors. Many of these issues deal with anchoring the guidelines, legitimizing actions, and mitigating negative impacts. As shown for the EU, such policy work is time-consuming, and much pressure is needed for successful implementation. Step 1b can illustrate this point. No one is opposed to reducing pathogen content in waste, but there may be strong vested interest to resist reduction or substitution of toxic chemical substances in products (EC, 2007). Overcoming this resistance may require a range of measures taken by different actors, such as research cooperation with industries, ecodesign, improved product standard and legislation, ban on certain products, market intervention, and consumer boycotts. Today, perceptions may form a stumbling block for transformation. Legislation sometimes directly or indirectly discourages nutrient reuse and recycling. For example, the term biowaste excludes human excreta, clean sludge, and animal manure. Human urine and feces are currently not permitted by the EU regulation for organic farming, which means that farmers cannot be certified as organic farmers if they use human urine. At the same time, EU allows manure (which contains large amounts of medical and hormone residues) and, sometimes, untreated sludge to be incorporated in agricultural soil (EC, 2007; ECHA, 2007). Therefore, exclusion of human excreta is likely to be a cultural construction rather than a scientific distinction. The authors perceive human excreta as a nutrient-rich organic resource with an elevated concentration of pathogens, higher than what food waste usually contains (UN-Habitat, 2010). Yet, treatment standards exist for removing these pathogens and reducing associated risks (WHO, 2006). Current legislation needs to be reviewed to ensure that it does not prohibit nutrient reuse/recycling or makes such practices difficult. Policy-makers and others need to appreciate a range of tradeoffs affecting decisions involving the food supply and ecosystem
10
February 2018 | Volume 2 | Article 3
Drangert et al.
Extended Waste Hierarchy to Recycle P
services. Life cycle and system perspectives help to balance various impacts to achieve best possible nutrient effectiveness. EU policies show that there is scope to develop new regulations and management models that could promote productive end use of sanitation sector products, improve quality control, and improve linkages between the sanitation and agriculture sectors. The extended waste hierarchy and life cycle thinking serve the dual purpose to enhance sustainability of nutrient resources and to improve global food security. Applying the hierarchy in this way can assist stakeholders to identify wasteful handling of nutrients in urban waste and to suggest measures to better manage those nutrients (McConville et al., 2015). A systems thinking approach can provide substantial inputs for problem-solving to ensure food security. In our chemical societies, the long-term affordable solution to securing good-quality solids, sludge, and urine/feces/blackwater is to design systems that avoid mixing flows. Just like polluting industries today have to collect their sewage in separate sewers and treat it separately, households should also dispose of polluted greywater (often containing more varied chemical composition than industrial wastewater) in a separate sewer and treat it separately. Proposals to change infrastructure are inherently open to criticism concerning costs and acceptance. The authors take the long view that appropriate collection and recycling sanitation systems for solid and liquid waste are affordable in new urban developments, while some measures can wait till it is time to retrofit anyway in already built up areas. In the case of EU, a large number of new buildings will be built in the next generation, and large stretches
of worn-out sewer lines need replacement. If an extra pipe for excreta is laid at the same time, a high-quality nutrient waste will be available at low cost in the future. Refurbishment of the existing houses, in particular bathrooms, are ongoing and if separate pipes for urine or blackwater are legally required from now, the total cost for an alternative sanitation system will be reasonably low. At a global level, the situation is even more favorable. Now is a window of unprecedented opportunity to design sustainable urban infrastructure since houses and infrastructure for an additional 5.5 billion urban residents in the 21st century have not yet been planned. If embarked on now, two-thirds of the world population will have sustainable waste management systems at the end of the century without additional investments. A win–win situation is present, providing both food security and reduced harmful emissions to air, water, and soil.
AUTHOR CONTRIBUTIONS J-OD is the main author, KT and JM contributed to sections and figures.
FUNDING The authors are grateful to the Swedish International Development Cooperation Agency (Sida) for financial support through the SanWatPUA network. This article has benefited from inputs from members of the SanWatPUA network. Sida has in no way influenced the writing of this article.
REFERENCES
EC. (2008b). Waste Framework Directive 2008/98/EC. Available at: http://eur-lex. europa.eu/LexUriServ/LexUriServ.do?uri=CELEX:32008L0098:EN:NOT EC. (2010a). Communication from the Commission to the Council and the European Parliament on Future Steps in Bio-Waste Management in the European Union. Brussels: COM, 235. EC. (2010b). Guidelines on the Preparation of Food Waste Prevention Programmes. BioIntelligence Services and the European Commission DG ENV.G.4/ FRA/2008/0112. Available at: http://ec.europa.eu/environment/waste/prevention/pdf/prevention_guidelines.pdf EC. (2011a). Communication from the Commission to the European Parliament, the Council, the European Economic and Social Committee and the Committee of the Regions Roadmap to a Resource Efficient Europe. Brussels: COM, 571. Available at: http://eur-lex.europa.eu/legal-content/EN/TXT/ HTML/?uri=CELEX:52011DC0571&from=EN EC. (2011b). Report from the Commission to the European Parliament, the Council, the European Economic and Social Committee and the Committee of the Regions on the Thematic Strategy on the Prevention and Recycling of Waste SEC (2011) 70 Final. Available at: http://eur-lex.europa.eu/LexUriServ/LexUriServ. do?uri=CELEX:52011DC0013:EN:NOT EC. (2012). Preparing a Waste Prevention Programme. Guidance Document. Paris: Drafted by BioIntelligence Services. Available at: http://ec.europa.eu/environment/waste/prevention/pdf/Waste%20prevention%20guidelines.pdf EC. (2013). Sewage Sludge Directive. EU Commission Home Page. Available at: http://ec.europa.eu/environment/waste/sludge/ ECHA. (2007). REACH in Brief. Brussels: Environment Directorate General, European Commission. Available at: http://ec.europa.eu/environment/chemicals/reach/pdf/publications/2007_02_reach_in_brief.pdf EFMA. (2000). Understanding P and Its Use in Agriculture. Brussels: European Fertilizer Manufacturers Association (EFMA). Available at: www.efma.org EUP. (2011). European Parliament Resolution of 6 July 2010 on the Commission Green Paper on the Management of Bio-Waste in the European Union (2009/2153(INI)) (2011/C 351 E/07) In C 351 E/48-55 Official Journal of the European Union 2.12.2011. 48–55.
Bergbäck, B., and Jonsson, B. (2008). Stockholm – Towards a Non-Toxic Environment. Stockholm: Environmental Department, Stockholm Water Company. Boxall, A. B. A. (2012). New and Emerging Water Pollutants Arising from Agriculture. Paris: OECD Publishing. Calvo, M. S., and Uribarri, J. (2013). Public health impact of dietary phosphorus excess on bone and cardiovascular health in the general population. Am. J. Clin. Nutr. 98, 16–15. doi:10.3945/ajcn.112.053934 Cordell, D., Drangert, J.-O., and White, S. (2009a). The story of phosphorus: food security and food for thought. Global Environ. Change 19, 292–305. doi:10.1016/j.gloenvcha.2008.10.009 Cordell, D., Neset, T. S. S., White, S., and Drangert, J. O. (2009b). “Preferred future phosphorus scenarios: a framework for meeting long-term phosphorus needs for global food demand,” in International Conference on Nutrient Recovery from Wastewater Streams, Vancouver, 10–13th May, 2009, eds D. Mavini, K. Ashley, and F. Koch (London, UK: IWA Publishing). Dagerskog, L., Kenfack, S., and Jönsson, H. (2008). ECOSAN fertilizers with potential to increase yields in West Africa. Urban Agric. Mag. 20, 41–43. Delin, S., Stenberg, B., Nyberg, A., and Brohede, L. (2012). Potential methods for estimating nitrogen fertilizer value of organic residues. Soil Use Manag. 28, 283–291. doi:10.1111/j.1475-2743.2012.00417.x Drangert, J.-O. (1998). Fighting the urine blindness to provide more sanitation options. Water SA 24, 2. EC. (2007). Regulation No 834/2007 of 28 June 2007 on Organic Production and Labelling of Organic Products and Repealing Regulation (EEC) No. 2092/91. Available at: http://eur-lex.europa.eu/legal-content/EN/TXT/?uri= celex%3A32007R0834 EC. (2008a). Regulation No 889/2008 of 5 September, 2008 Laying Down Detailed Rules for the Implementation of Council Regulation (EC) No 834/2007 on Organic Production and Labelling of Organic Products with Regard to Organic Production, Labelling and Control. Available at: http://eur-lex.europa.eu/eli/ reg/2008/889/oj
Frontiers in Sustainable Food Systems | www.frontiersin.org
11
February 2018 | Volume 2 | Article 3
Drangert et al.
Extended Waste Hierarchy to Recycle P
Eurostat. (2016). Municipal Waste Statistics. Eurostat Statistics Explained. Available at: http://ec.europa.eu/eurostat/statistics-explained/index.php/ Municipal_waste_statistics#Municipal_waste_treated_in_Europe Eurostat. (2017). Agri-Environmental Indicators. Available at: http://ec.europa.eu/ eurostat/statistics-explained/index.php/Agri-environmental_indicators FAO. (2013). Statistical Yearbook. Rome: Food and Agricultural Organization. Fidjeland, J., Magri, M., Jönsson, H., Albihn, A., and Vinnerås, B. (2013). The potential for self-sanitation of faecal sludge by intrinsic ammonia. J. Water Resour. 47, 6014–6023. doi:10.1016/j.watres.2013.07.024 Foresight. (2011). The Future of Food and Farming: Challenges and Choices for Global Sustainability. London: The Government Office for Science. Available at: http:// www.bis.gov.uk/assets/foresight/docs/food-and-farming/11-547-future-offood-and-farming-summary.pdf Gerst, M. D., and Graedel, T. E. (2008). In-use stocks of metals: status and implications. Environ. Sci. Technol. 42, 7038–7045. doi:10.1021/es800420p Gustavsson, J., Cederberg, C., and Sonesson, U. (2011). “Global food losses and food waste – extent, causes and prevention,” in A Study Commissioned by FAO for the International Congress SAVE FOOD at Interpack (Dusseldorf, Germany). Hahnkamper-Vandenbulcke, N. (2017). Chemicals. Fact Sheets on the European Union. Available at: http://www.europarl.europa.eu/atyourservice/en/displayFtu.html?ftuId=FTU_2.5.8.html Hellström, D., Baky, A., Jeppsson, U., Jönsson, H., and Kärrman, E. (2007). Comparison of environmental effects and resource consumption for different wastewater and organic waste management systems in a new city area in Sweden. Water Environ. Res. 80, 708–718. doi:10.2175/106143008X276705 Jönsson, H., Hallin, S., Bishop, K., Gren, I.-M., Jensen, E. S., Rockström, J., et al. (2012). Många skäl att återvinna mer fosfor (Several Reasons to Recover More Phosphorus). Stockholm: Dagens Nyheter. JRC. (2011). Supporting Environmentally Sound Decisions for Bio-Waste Management – A Practical Guide to Life Cycle Thinking (LCT) and Life Cycle Assessment (LCA). Luxemburg: EUR 24917 EN – Joint Research Centre – Institute for Environment and Sustainability. Kabbe, C., Bäger, D., and Mancke, R. (2014). Abschlussbericht Phosphorpotenzial im Land Berlin. Berlin: Kompetenzzentrum Wasser Berlin. Krausmann, F., Schandl, H., and Sieferle, R. P. (2008). Socio-ecological regime transitions in Austria and the United Kingdom. Ecol. Econ. 65, 187–201. doi:10.1016/j.ecolecon.2007.06.009 Kümmerer, K. (2007). Sustainable from the very beginning: rational design of molecules by life-cycle engineering as an important approach for green pharmacy and green chemistry. Green Chem. 9, 899–907. doi:10.1039/b618298b Kümmerer, K. (2013). “The issue of micropollutants in urban water management,” in Source Separation and Decentralisation for Wastewater Management, eds T. A. Larsen, K. M. Udert, and J. Lienert (London: IWA Publishing), 71–84. Lalander, C., Diener, S., Magri, M., Zurbrügg, C., Hellström, A., and Vinnerås, B. (2013). Faecal sludge management with the larvae of the black soldier fly (Hermetia illucens) – from a hygiene aspect. Sci. Total Environ. 458-460, 312–318. doi:10.1016/j.scitotenv.2013.04.033 Lundin, M., Olofsson, M., Pettersson, G. J., and Zetterlund, H. (2004). Environ mental and economic assessment of sewage sludge handling options. Resour. Conserv. Recycl. 41, 255–278. doi:10.1016/j.resconrec.2003.10.006 Malingreau, J.-P., Hugh, E., and Albino, M. (2012). NPK: Will There Be Enough Plant Nutrients to Feed a World of 9 Billion in 2050? Foresight and Horizon Series. Luxemburg: JRC Science and Policy Reports. EUR 25327. McConville, J., Drangert, J.-O., Tidåker, P. S., Neset, T.-S., Rauch, S., Stride, I., et al. (2015). Closing the food loops – guidelines and criteria for improving nutrient management. Sustainability Sci. Pract. Policy 11, 33–43. doi:10.1080/ 15487733.2015.11908144 METI. (2003). Handbook on Resource Recycling Legislation and 3R Trends in 2003. Ministry of Economy, Trade and Industry, Government of Japan. Available at: http://www.meti.go.jp/policy/recycle/main/data/pamphlet/pdf/cRecycle3R. pdf Milieu Ltd, WRC, and RPA. (2008). Environmental, Economic and Social Impacts of the Use of Sewage Sludge on Land. Final Report Part I: Overview Report. European Commission, DG Environment under Study Contract DG ENV.G.4/ ETU/2008/0076r. Available at: http://ec.europa.eu/environment/archives/waste/ sludge/pdf/part_i_report.pdf MOE. (2001). Law for Promotion of Recycling and Related Activities for Treatment of Cyclical Food Resources (Outline). Ministry of the Environment, Government of Japan. Available at: http://www.env.go.jp/en/laws/recycle/
Frontiers in Sustainable Food Systems | www.frontiersin.org
MOE. (2010). 3R – Establishing a Sound Material Society. Ministry of the Environment, Government of Japan. Available at: http://www.env.go.jp/en/recycle/smcs/ a-rep/2010gs_full.pdf Nykvist, B., Persson, Å, Moberg, F., Persson, L., Cornell, S., and Rockström, J. (2013). National Environmental Performance on Planetary Boundaries. A Study for the Swedish Environmental Protection Agency. Report 6576. The Swedish Environmental Protection Agency. Available at: www.naturvardsverket.se/ publikationer OCP. (2010). Annual Report on Sustainable Development 2009. Casablanca, Morocco: Office Cherifien des Phosphates (OCP) Group. Available at: https:// vdocuments.site/ocp-rapport-annuel-2009-fr.html Parfitt, J., Barthel, M., and Macnaughton, S. (2010). Food waste within food supply chains: quantification and potential for change to 2050. Philos. Trans. R. Soc. Lond. B Biol. Sci. 365, 3065–3081. doi:10.1098/rstb.2010.0126 Quested, T., and Johnson, H. (2009). Household Food and Drink Waste in the UK. Banbury, UK: Waste and Resources Action Programme WRAP. Rockström, J., Steffen, W., Noone, K., Persson, Å, Chapin, F. S. C. III, Lambin, E. F., et al. (2009). A safeoperating space for humanity. Identifying and quantifying planetary boundaries that must not be transgressed could help prevent human activities from causing unacceptable environmental change. Nature 461, 472–475. doi:10.1038/461472a Schmid-Neset, T.-S., Drangert, J.-O., Bader, H.-P., and Scheidegger, R. (2010). Recycling of phosphorus in urban Sweden. A historical overview to guide a strategy for the future. Water Policy 12, 611–624. doi:10.2166/wp.2009.165 Schoumans, O. F., Bouraoui, F., Kabbe, C., Oenema, O., and van Dijk, K. (2015). Phosphorus management in Europe in a changing world. Ambio 44(Suppl. 2), S180–S192. doi:10.1007/s13280-014-0613-9 Schröder, J. J., Cordell, D., Smit, A. L., and Rosemarin, A. (2010). Sustainable Use of Phosphorus. Wageningen: Stockholm Environment Institute and Wageningen University and Research Centre, 357. Senecal, J., and Vinnerås, B. (2017). Urea stabilization and concentration for urine-diverting dry toilets: urine dehydration in ash. Sci. Total Environ. 586, 650–657. doi:10.1016/j.scitotenv.2017.02.038 Senthilkumar, K., Nemse, T., Mollier, A., and Pellerin, S. (2012). Conceptual design and quantification of phosphorus flows and balances at the country scale: the case of France. Global Biogeochem. Cycles 26, GB2008. doi:10.1029/ 2011GB004102 Sheppard, D. C., Newton, L., Thompson, S., and Savage, S. (1994). A value added manure management system using the black soldier fly. Bioresour. Technol. 50, 275–279. doi:10.1016/0960-8524(94)90102-3 Spångberg, J., Tidåker, P., and Jönsson, H. (2014). Environmental impact of recycling nutrient in human excreta to agriculture compared with enhanced wastewater treatment. Sci. Total Environ. 493, 209–219. doi:10.1016/j.scitoenv. 2014.05.123 Steffen, W., Richardson, K., Rockström, J., Cornell, S. E., Fetzer, I., Bennett, E. M., et al. (2015). Planetary boundaries: guiding human development on a changing planet. Science 347, 1259855. doi:10.1126/science.1259855 Tidåker, P., Sjöberg, C., and Jönsson, H. (2007). Local recycling of plant nutrients from small-scale wastewater systems to farmland – a Swedish scenario study. Resour. Conserv. Recycl. 49, 388–405. doi:10.1016/j.resconrec.2006.05.004 UN-Habitat. (2010). Solid Waste Management in the World’s Cities. Water and Sanitation in the World’s Cities 2010. United Nations Human Settlements Programme. London: Earthscan Publishing. Vallin, A., Grimvall, A., and Sundblad, E.-L. (2016). Changes in Four Societal Drivers and Their Potential to Reduce Swedish Nutrient Inputs into the Sea. Report. Stockholm: Swedish Institute for the Marine Environment, 3. Van Dijk, K. C., Lesschen, J. P., and Oenema, O. (2016). Phosphorus flows and balances of the European Union Member States. Sci. Total Environ. 542, 1078–1093. doi:10.1016/j.scitotenv.2015.08.048 van Huis, A., Itterbeeck, J. V., Klunder, H., Martens, E., Halloran, A., Muir, G., et al. (2013). Edible Insects; Future Prospects for Food and Feed Security. FAO Forestry Paper. Rome: FAO, 171. Weiss, F. T., Leuzinger, M., Zurbrügg, C., and Eggen, R. I. L. (2016). Chemical Pollution in Low- and Middle-Income Countries. Dübendorf, Switzerland: Swiss Federal Institute of Aquatic Science and Technology. WHO. (2006). WHO Guidelines for the Safe Use of Wastewater, Excreta and Greywater. Vol. 4: Excreta and Greywater Use in Agriculture. Geneva: World Health Organisation. Available at: http://www.who.int/water_sanitation_health/ publications/gsuweg4/en/
12
February 2018 | Volume 2 | Article 3
Drangert et al.
Extended Waste Hierarchy to Recycle P
characteristics. Sci. Total Environ. 264, 205–214. doi:10.1016/S0048-9697(00) 00715-4
Williams, H., Wikström, F., Otterbring, T., Löfgren, M., and Gustafsson, A. (2012). Reasons for household food waste with special attention to packaging. J. Clean. Prod. 24, 141–148. doi:10.1016/j.jclepro.2011.11.044 Winger, R. J., Uribarrib, J., and Lloyd, L. (2012). Phosphorus containing food additives: an insidious danger for people with chronic kidney disease. Trends Food Sci. Technol. 24, 92–102. doi:10.1016/j.tifs.2011.11.001 World Bank. (2017). Commodity Markets Outlook. Available at: http://worldbank. org/commodities Zhang, F.-S., Yamasaki, S., and Nanz, M. (2002). Waste ashes for use in agricultural production: I. Liming effect, contents of plant nutrients and chemical characteristics of some metals. Sci. Total Environ. 284, 215–225. doi:10.1016/ S0048-9697(01)00887-7 Zhang, F.-S., Yamasaki, S., and Nanzyo, M. (2001). Application of waste ashes to agricultural land – effect of incineration temperature on chemical
Frontiers in Sustainable Food Systems | www.frontiersin.org
Conflict of Interest Statement: The authors declare that the research was conducted in the absence of any commercial or financial relationships that could be construed as a potential conflict of interest. Copyright © 2018 Drangert, Tonderski and McConville. This is an open-access article distributed under the terms of the Creative Commons Attribution License (CC BY). The use, distribution or reproduction in other forums is permitted, provided the original author(s) and the copyright owner are credited and that the original publication in this journal is cited, in accordance with accepted academic practice. No use, distribution or reproduction is permitted which does not comply with these terms.
13
February 2018 | Volume 2 | Article 3