Extracting Composite Cartographic Area Features in Low-Quality Maps Stefan Leyk and Ruedi Boesch ABSTRACT: We describe an extraction method for area features defined by composite cartographic elements and derived from historical, manually produced maps of low graphical quality. Composite elements appear in many topographic maps of the 19th and 20th century which provide unique information about the landscape of the past. We develop a method from prior research for extracting forest areas from the historic Siegfried Map, on which they are represented by sets of circular forest symbols within boundary regions. First, a prototype search identifies forest symbols characterized by a combination of geometric attributes of connected components, shape descriptions of the local neighborhood, and patterns formed by similar graphic elements. Next, the complete set of forest symbols is iteratively determined by testing forest symbol candidates in the vicinity of the prototypes if they belong to a group of sufficient other candidates. Finally, spatial expansion determines the forest net area described by the composition of recognized forest symbols and continues to fill gaps between forest areas and their boundaries, as well as larger objects within the forest area. Automated extraction from three map pages resulted in an accuracy of K = 95 percent, which indicates high robustness for automated processing of entire map series. The new approach presented in this paper represents a general methodological framework for the extraction of area features from composite map elements in low-quality maps. KEYWORDS: Cartographic pattern recognition, historical maps, composite elements, feature extraction, land cover change.
P
Introduction
attern recognition in cartographic documents aims at the delineation and extraction of spatial information and its incorporation into GIS as raster or vector data (Chen et al. 1999). Methods for recognition in maps are particularly challenging due to the complexity of map content (Cordella and Vento 2000; Watanabe 2000) and the presence of both single and composite map elements (Llados et al. 2002). Composite elements consist of different graphic elements whose spatial distribution and patterns can define higher-level spatial objects such as paths (Gamba and Mecocci 1999), linework (Yamada et al. 1993; Zhong 2002), or areas (Leyk et al. 2006). The recognition of such complex objects is particularly problematic in maps of low quality, such as historical cartographic documents, which are often hand-drawn with
Stefan Leyk, Department of Geography, University of Colorado, Boulder. UCB 260, Boulder, Colorado 80309, E-mail: . Ruedi Boesch, Federal Research Institute for Forest, Snow and Landscape (WSL). Zuercherstrasse 111, Birmensdorf, CH-8903, Switzerland. Email:
[email protected] .
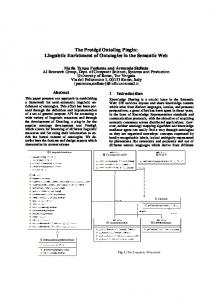
only vague information about the underlying concepts for map production. Such historical maps are valuable sources for land-cover change analysis and represent the most reliable spatial data source of historical land cover before aerial photography. Many historical map series exist for different regions (Figure 1), which indicates the potentially high demand for successful extraction methods. The depiction of forest areas on the Siegfried Map—the Swiss national topographic map of the 19th century—is a typical example of composite spatial information. The representation of forest consists of distributed, individual circular symbols bounded by line objects or not, for closed or open forests respectively. Line objects, which represent the boundaries of forest areas, are frequently fragmented, merged with other objects, or are missing due to the manual drawing process. This results in inherent inconsistency and requires the description of such objects by combining geometric and structural map attributes. The Siegfried Map also serves as an example of low graphical quality due to aging and blurring and of false and mixed coloring. Recent research efforts resulted in a first prototype for multi-step forest extraction from these maps (Leyk et al. 2006). This prototype was an attempt
Cartography and Geographic Information Science, Vol. 36, No. 1, 2009, pp. 71-79
to recognize all relevant map objects such as text, bedrock, line-work, and buildings. A drawback of this approach was its complexity, which resulted in a lack of robustness if map properties such as font size of map text differed between map pages. The most important outcome of developing the prototype was that it provided the fundamental principles necessary to successfully extract forest areas as area objects and indicated limitations that needed to be overcome. Follow-up research to these earlier efforts has aimed at a more robust and adaptable forest extraction process, one that does not require the recognition of objects of any other map category. The extraction process described here is based on the combination of different information domains such as geometric attributes of objects (connected components), the presence of patterns of similar objects, and shape characteristics within the local neighborhood. The methodological approach can be transferred to similar recognition problems for different maps where composite map elements have to be extracted. We demonstrate and test our approach on maps of low graphical quality in order to demonstrate its potential for extracting spatial composite information from other historical maps of similar time periods (Figure 1).
Data and Materials The Siegfried Map was the national topographic map series of Switzerland of the 19th century. It was published at a scale of 1:25,000 in the Swiss Plateau and 1:50,000 in the mountainous regions. Forest was assigned to the black color separation. The graphical representation of the black layer is characterized by merged objects of different categories, inconsistent shapes, and varying dimensions of map symbols, all of which are the consequence of manual production techniques (engraving). In addition to these problems the scanned maps suffer from aging effects—blurring, false and mixed coloring—and thus result in low image quality (e.g., Figure 1d). The map documents were scanned with a resolution of 508 dpi, which resulted in image sizes of 7000 × 4800 pixels and a pixel dimension equivalent of 1.25 m on the ground at a map of scale of 1:25,000. The map data in this paper are preprocessed to achieve the desired color image segmentation using a method described in a forthcoming paper (Leyk and Boesch (in press). The result of this segmentation process is an image that contains the reconstructed black, red, and blue map color layers (Figure 2a). 72
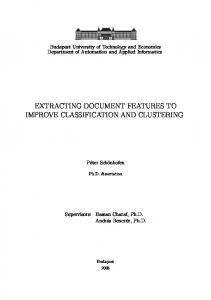
Figure 1. Subsections of historical topographic map series with composite elements describing forest area: (a) Military Geographical Institute, Poland 1930, p. 1:25 000; (b) Royal Prussian Surveying Unit, Map of Western Russia, 1915, p. 1:100 000; (c) Imperial and Royal Military Geographical Institute, Austria, Map of the Austrian-Hungarian Monarchy and foreign map pages, Russia, 1878, p. 1:75 000, (d) Swiss Federal Topographic Bureau, Swiss Topographic Map (Siegfried Map) 1912, p. 1:25 000.
Methods The method uses geometric attributes of connected components and shape descriptions in the local neighborhood and tests the presence of patterns of similar graphic elements in the local neighborhood. The distances and window sizes used in this section are the results of preliminary experiments on the map series to find consistent parameters for extraction. The stages of the extraction process are: • Recognition of individual prototypes (graphic elements representing forest symbols); • Definition of the composition of individual symbols and the spatial extent of the resulting net forest area; and • Identification of boundary and embedded “large” non-forest objects to expand net forest area.
(A) Recognition of Individual Prototypes In the first step, forest symbol prototypes are identified based on geometric properties of connected components, shape descriptors in the local neighborhood, as well as tests for spatial inclusion and the presence of similar objects in the local neighborhood of a candidate. This combination of composition and object-related measures is used to ensure that only well shaped Cartography and Geographic Information Science
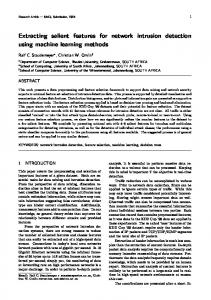
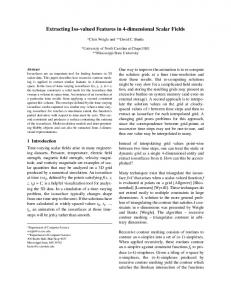
“first-level” candidates (Figure 2c) if they meet the general geometric constraints of idealized forest symbols. We used wide ranges of acceptable attribute values to ensure that all individual symbols belong to the set of “first-level” candidates regardless of their fragmentation and distortion. This set of “first-level” candidates is filtered based on the same attribute space to define a subset of “direct prototype candidates” (Figure 2c). A prototype candidate holds geometric properties, which describe a well-shaped, nondistorted and nonfragmented forest symbol. Shape Description in the Local Neighborhood of Pixels Forest symbols are frequently merged, distorted, or fragmented. Hence, the description of their shape using geometric properties is not a reliable measure for recognition in many cases. For this reason, it was necessary to develop a specific morphological test for the local neighborhood which is independent of the connected components. We developed an “Octopus” test, which has some similarity to methods relying on concepts of the generalized Hough-transformation (Ballard 1981). Instead of using a functional model, a geometric model was combined with a Figure 2. Prototype search and symbol composites: (a) Color-segmented spectral model to describe shapes image; (b) Labels of approved Octopus tests (blue); (c) Types of candidates in the local neighborhood of a after the prototype search (prototypes: red, prototype candidates: blue, pixel and to evaluate the similarity remaining first-level candidates: green); (d) Composition of forest symbols of those shapes to shapes that are after iterative testing for similar graphic elements in the local neighborhood typical of forest symbols. A forest (red) and large objects (yellow). symbol is characterized by a group of bright pixels in the center from forest symbols of certain dimensions are identiwhich a rising and falling edge fied as prototypes. transition can be observed in eight search directions analogous to the eight limbs of an octopus (Figure 3). In contrast to common edge models Region-based Candidate Search in computer vision, which depend on second Connected components or regions of the black order derivatives, we used a weaker edge model. layer in the color-segmented image (Figure 2a) Starting from the center, a valid edge is identiare processed to derive geometric and topofied if a transition from bright to dark is followed logical attributes such as area, number of holes, by a transition from dark to bright (e.g., direcperimeter, dimensions in the horizontal and tion E in Figure 3). Intermediate dark pixels vertical directions, and circularity. Based on the between rising and falling edge transitions resulting attribute space, regions are labeled as Vol. 36, No. 1
73
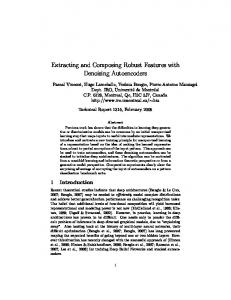
are valid (e.g., direction W). A center is considered bright if there is a majority of bright pixels (here 8 of 9 pixels within the central 3 × 3 box). Direction SE represents a valid edge transition; directions S and SW are invalid because there is no transition to dark. Dark and bright are based on value ranges in lightness and hue. Due to the coarse resolution and the small size of forest symbols (typical box size is between 11 × 11 and 15 × 15 pixels) a finer differentiation of angles for search directions is not meaningful and would result in highly increased computational burden. In imitation of the Hough space, the accumulator space of the Octopus is defined by the edge test in eight directions. If a sufficient number of edge evaluations are valid (six in Figure 3), the distorted shape in the local neighborhood is still recognized as a circular symbol, which meets the morphological constraints of forest symbols, and the central pixel is labeled as a center (Figure 2b).
Figure 3. Illustration of the Octopus test to examine for edges in eight different directions.
Tests for Inclusion and the Presence of Groups of Similar Objects To identify regions for which both the object-related geometric attributes as well as the shape descriptions in the local neighborhood meet the requirements of prototype candidates, a spatial inclusion test is carried out. This test examines whether an Octopus-labeled pixel is located within the area defined by the horizontal and vertical extents of one of the direct prototype candidates, an approximation of the physical boundary of this region. If this inclusion condition is true, the region containing this pixel remains a prototype candidate and is further examined; if not, the region is degraded to a first-level candidate. Next the local neighborhood of each prototype candidate is examined for the presence of a minimum number of other candidates (first-level candidates, prototype candidates, or prototypes). We examined for the presence of at least three other candidates within a 50 × 50 pixel window. If this condition is also reached, the candidate is labeled as a prototype (Figure 2c).
(B) Definition of the Composition of Individual Symbols and the Spatial Extent of the Resulting Net Forest Area The primary forest symbol prototypes represent the starting points to classify remaining firstlevel candidates, which also belong to the spa74
tial composition of forest symbols. The iterative process thus established can be used to test the first-level candidates in the vicinity of prototypes as to whether they belong to a group that contains a sufficient number of other candidates or prototypes. Once the complete set of forest symbols is identified, the spatial extent described by these symbols is determined to derive the forest net area. Iterative Analysis of Symbol Composites First-level candidates in the vicinity (less than 15 pixel distance) of the primary prototypes are labeled as prototype candidates (Figure 2c) to conduct the same test for a sufficient number of similar objects in the local neighborhood (at least three first-level candidates, prototype candidates, or prototypes) as described above. The purpose of the test is to identify the primary prototypes, but within a smaller search box (30 × 30 pixel). The reason for the smaller box is that these prototype candidates are already known to be located in the vicinity of other candidates or prototypes and thus a stricter rule is needed for a reliable iterative examination. If this condition is reached, the prototype candidate is labeled as a prototype (Figure 2c); otherwise the candidate is not considered as a member of the spatial forest symbol composition and is eliminated from the set of potential candidates. Cartography and Geographic Information Science
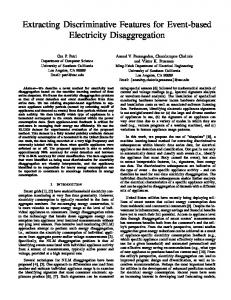
defined threshold in eight directions. If a forest pixel can be identified along the path, all search path locations between the starting pixel and this forest pixel are labeled as forest. The only constraint included in this expansion is the treatment of regions that are labeled as “large” objects. Large objects are connected components, defined by 4-neighbor connectivity, which have an area greater than 100 pixels; these include, for example, road segments and boundary regions. If a pixel of a large object is encountered, the search path is examined in full length. If a forest pixel is found along the search path after encountering the large object, expansion is carried out but it is restricted to the pixels between the starting position and the encountered large-object pixel. If no forest can be found, nothing is done. This constraint ensures that large objects in forest areas are completely embedded but not crossed by the expansion process if forest symbols are identified on two opposite sides. This ensures that forest is not expanded in an uncontrolled manner. Spatial expansion continues, iteratively, until no new location is labeled as forest. The result is the spatially expanded forest net area that is described by the spatial composition of forest symbols (Figure 4a). In a next step the remaining Octopus labels Figure 4. Stages of spatial expansion: (a) based on the set of forest located in the vicinity of the margin of the symbols; (b) including nearby Octopus labels (clipped study area); forest net area are included in the expan(c) after filling gaps between forest and marginal large objects in sion process (Figure 4b). Thus those forest the vicinity; (d) after filling embedded large objects of low local symbols that did not fulfill the geometrical object-related requirements needed because dimension. they were merged with forest boundary fragments, bedrock, text, or remaining color The remaining first-level candidates found in layer segments can still be used for expansion. If the search box are labeled as prototype candithe Euclidean distance between an Octopus label dates and are used to initiate the next iteration. and the closest forest pixel is less than a given This procedure is repeated until no new protothreshold (10 pixels), the Octopus label is contype candidate is labeled. The aim is to identify verted to forest color and included in the iterative a complete set or spatial composition of forest expansion process. Forest net area is thus further symbols (Figure 2d). expanded towards marginal large objects without completely closing the gaps between forest and Spatial Expansion potential boundary segments (Figure 4b). The spatial extent of the forest net area is determined by expanding a forest color between indi(C) Boundary Identification and Filling vidual pixels of the identified forest symbols Embedded Objects (prototypes) if the Euclidean distance between In an intermediate step, the derived forest net them is less than a predefined threshold (18 area is buffered using the observed mean dispixels) (Figure 4a). The expansion takes place tance between the boundary and the closest nonalong search paths of length equal to this preVol. 36, No. 1
75
merged forest symbols, multiplied by two, that is 24, pixels. The whole image is clipped using this buffer as a clip area to constrain the boundary search to this region (Figure 4b). This step increases the efficiency of the extraction process and prevents incremental extraction errors. To find forest boundary fragments, forest pixels that have a background pixel in the direct neighborhood are identified and search paths of eight pixels are defined in the same direction where the background pixel was found. If a large object is encountered along this search path, the pixels between the starting position and the first largeobject pixel are labeled as forest without further examination. This process is repeated until no new forest pixels are labeled (Figure 4c). The final step aims at filling line-like large objects that are completely embedded in the expanded forest area. If a forest pixel has a large-object pixel in the direct neighborhood, search paths are defined in the same direction. If another forest pixel is found within a very short distance (3 pixels) the local dimension of the large object encountered is considered very low and the pixels along this search path are labeled as forest (Figure 4d).
Results and Discussion We compared the automated forest extraction with manual delineation by experienced cartographic interpreters to evaluate the performance of the method. The underlying presumption is that human vision results in the most reliable interpretation of cartographic information due to the ability of humans to visually explore spatial and topological relationships, even if the graphical representation lacks completeness, quality, or precision. To define a consistent rule of the minimum mapping unit, the interpreters identified groups of forest symbols as a forest patch if the number of individual symbols that represented this patch was greater than five.
Accuracy Assessment We tested three whole map pages of the Swiss Plateau (scale 1:25,000), each at 7000 × 4800 pixels, to obtain some first estimations of the robustness of the extraction approach which was developed using a different set of map pages. A confusion matrix was established and different class-specific and global accuracy measures were derived. Sensitivity and specificity (Fielding and Bell 1997) are the conditional probabilities that forest and non-forest, respectively, are correctly 76
classified. Positive predictive power (PPP) and negative predictive power (NPP) (Fielding and Bell 1997) indicate the probabilities that a pixel is forest or non-forest if the extraction classifies it as forest or non-forest, respectively. To estimate the overall classification accuracy, global measures were calculated, i.e., percent correctly classified (PCC); Kappa coefficient of agreement (K) (Cohen 1960); and normalized mutual information criterion (NMI) (Forbes 1995). K and NMI account for specific agreement by making full use of the information contained in the confusion matrix. NMI represents the most conservative global accuracy measure, which remains robust if the size of one class far exceeds the sizes of other classes.
Performance The results (Table 1) demonstrate a high global accuracy of K = 95 percent on average. The parameters defined proved to be valid for each map page tested, confirming the robustness of the extraction process. This process remained partially independent from the quality of the color segmentation process, except in some situations described below. Sensitivity (0.98) and specificity (0.98) indicated high conditional probabilities that forest and non-forest, respectively, were correctly classified. PPP represents the smallest class-specific probability measure in Table 1 (PPP=0.95). This can be partly explained by a trend of the extraction process to “over-detect” forest symbols. Existing small groups or chains of forest symbols were very likely to be detected and extracted as forest area (Figures 5 and 6). In some instances, the interpreter did not delineate these symbol groups as forest because of their small size or elongated shape (Figure 6). This effect resulted in a slight decrease in PPP. A subsequent filtering step to eliminate forest patches with areas below a threshold value would further improve the accuracy. The processing times for the automated extraction of a whole map page can vary between 90 and 180 min using a common computer model (2.4 GHz Intel Core 2), and it will depend on the complexity of the map contents. In comparison, the time for the manual delineation of one map page is approximately 4 hr.
Observed Minor Problems Some problems occurred where map text crossed forest boundary regions. The expansion process Cartography and Geographic Information Science
Confusion matrix derived measures
Map page 042 (1913) Canton Zurich
Map page 043 (1919) Canton Zurich
Map page 211 (1912) Canton Zurich
Total
Sensitivity
0.97
0.98
0.97
0.98
Specificity
0.98
0.98
0.97
0.98
Positive predictive power NPP
0.95
0.96
0.93
0.95
Negative predictive power NPP
0.99
0.99
0.99
0.99
PCC/ACC
0.98
0.98
0.97
0.98
Kappa (K)
0.95
0.96
0.93
0.95
Normalized Mutual Information (NMI)
0.85
0.86
0.79
0.83
Table 1. Extraction results for three whole map pages of 7000 × 4800 pixels each. were located outside the forest boundary but were falsely identified as boundary objects (Figure 6). Where color layer segments of, for example, elevation contours remained in the image they were normally embedded in forest areas after spatial expansion. In cases where such segments were located in the direct vicinity of the forest boundary, however, they were falsely treated as a boundary object in some instances, decreasing NPP and sensitivity. Another problem observed was the false recognition of forest area where lawn signatures around buildings showed geometric properties similar to forest symbols. This problem could be solved if the extraction process were combined with a topological analysis that included building symbols. Similarly riverbanks—which have a punctuated signature but occasionally show geometric properties similar to forest symbols—were misclassified as forest in some cases. These two problems resulted in decreasing PPP and specificity. Some examples were observed where forest area was expanded across forest boundaries because of gaps in boundary regions. These “overshoots” mainly occurred where forest symbols were detected outside but close to the forest boundary (Figure 6). Figure 5. Forest/non-forest classifications of map page 042 (a) automati- However, this remained a minor problem (decreasing PPP and specificity) due to a cally extracted and (b) manually delineated. strict expansion control. did not allow objects of this size to be bridged in The most important drawback is the lack some instances, resulting in underestimations of of ability to differentiate between bedrock and text, forest area (decreasing NPP). In other cases, text which requires different actions during extraction objects might have been the reason for overes(expansion vs. clipping). These objects vary marktimation of forest area (decreasing PPP) if they edly in shape and size and are frequently merged
Vol. 36, No. 1
77
with other objects. This makes a reliable differentiation based on geometry nearly impossible. In addition, text is often curved or rotated and has varying character spacing within the same label word. One feasible solution to this problem would be to label these locations Figure 6. Detail of the extraction: (a) Color-segmented image; (b) Automated extraction of conflict, treat them (green, superimposed over the map); (c) Manual delineation (green, superimposed over as described in this the map). paper, but include an documents impose significant problems of inherinteractive component ent uncertainty (Leyk and Zimmermann 2007), at the end of the automatic extraction process. The retrospective landscape research for land-cover analyst would have the ability to return to these change, urban development, or conservation planlocations and correct the result if the large object ning can greatly benefit from gaining access to encountered represented bedrock. This interacsuch unique historical information for large areas. tion would be at the cost of full automation but More research efforts to access the spatial informawould ensure a minimum recognition error, espetion in these historical cartographic documents cially in mountainous regions where bedrock can for GIS-based analysis may now be feasible. have considerable spatial extent. Figure 5 shows In the near future we will develop an improved small holes in the extracted forest area. They are test for the presence of patterns of similar objects examples where text elements created a bright in the local neighborhood by taking into account spot similar to bedrock; an analyst would have to the directions in which similar objects are found. revisit this location to verify the category of the This will improve the differentiation between encountered object. forest symbols that are located within a forest area and those located at the margin of forest Conclusions patches and, thus, the determination of forest boundaries. Further steps will be taken to focus A framework and procedure for robust autoon the problem of differentiating between bedrock mated extraction of areas defined by composite and text elements in forest areas. While this study cartographic elements from hand-drawn historifocused on forest extraction, we will also examine cal map documents is presented. The strength the extraction of other composite elements such of this approach is that extraction proceeds in as wetlands or vineyards. a very class-oriented manner without attempting the recognition of other map categories—a problem in recent research efforts to develop a recognition prototype for the same map (Leyk et al. 2006). The conservative testing strategy of strictly evaluating combined salient attributes using different information domains before adding an object to the set of forest symbols allowed the minimization of extraction errors. Consequently, the extraction performed equally well in maps where color image segmentation lacked in quality and resulted in remaining segments or the fragmentation of forest boundaries. In general the results, the method’s reproducibility, and its automation level justify the continuation of such extraction efforts not just for the Siegfried Map but also for other historical map series (see Figure 1). Whereas such historical
78
REFERENCES Ballard, D.H. 1981. Generalizing the Hough Transform to Detect arbitrary shapes. Pattern Recognition 13: 111-22. Chen, L., H. Liao, J. Wang, and K. Fan. 1999. Automatic data capture for geographic Iinformation systems. IEEE Transactions on Systems, Man and Cybernetics. Part C, Applications and Reviews 5(2): 205-15. Cohen, J. 1960. A coefficient of agreement for nominal scales. Educational and Psychological Measurement 20: 3746. Cordella, L., and M. Vento. 2000. Symbol recognition in documents: A collection of techniques? International Journal of Document Analysis and Recognition 3: 73-88. Fielding, A.H., and J.F. Bell. 1997. A review of methods for the assessment of prediction errors in conservation Cartography and Geographic Information Science
presence/absence models. Environmental Conservation 24(1): 38-49. Forbes, A.D. 1995. Classification algorithm evaluation: Five performance measures based on confusion matrices. Journal of Clinical Monitoring and Computing 11: 189-206. Gamba, P., and A. Mecocci. 1999. Perceptual grouping for symbol chain tracking in digitized topographic maps. Pattern Recognition Letters 20: 355-65. Leyk, S., and R. Boesch. Colors of the past: Color image segmentation in historical topographic maps based on homogeneity. GeoInformatica (in press). DOI for “online first article” 10.1007/s10707-008-0074-z. Leyk, S., R. Boesch, and R. Weibel. 2006. Saliency and semantic processing—Extracting forest cover from historical topographic maps. Pattern Recognition 39(5): 953-68. Leyk, S., and N. Zimmermann. 2007. Improving land change detection based on uncertain survey maps using fuzzy sets. Landscape Ecology 22: 257-72.
Vol. 36, No. 1
Llados, J., E. Valveny, G. Sanchez, and E. Marti. 2002. Symbol recognition: Current advances and perspectives. In: Blostein, D. and Y.-B. Kwon (eds.), Fourth IAPR Workshop on Graphics Recognition. Lecture Notes in Computer Science, 2390. Berlin, Germany: Springer. pp. 104-28. Watanabe, T. 2000. Recognition in maps and geographic documents: Features and approach. In: Chhabra, A.K. and D. Dori (eds.), Third IAPR Workshop on Graphics Recognition. Lecture Notes in Computer Science, 1941. Berlin, Germany: Springer. pp. 39-49. Yamada, H., K. Yamamoto, and K. Hosokawa. 1993. Directional mathematical morphology and reformalized Hough Transformation for the analysis of topographic maps. IEEE Transactions on Pattern Analysis and Machine Intelligence 15(4): 380-7. Zhong, D. 2002. Extraction of embedded and/or linetouching character-like objects. Pattern Recognition 35: 2453-66.
79