Jan 4, 2016 - The material has been developed for the mini-course Extrema of log-correlated ... walks and the two-dimensional Gaussian free field. In particular ..... An illustration of a binary branching random walk with incre- ments Yv(l) at ...
EXTREMA OF LOG-CORRELATED RANDOM VARIABLES: PRINCIPLES AND EXAMPLES
arXiv:1601.00582v1 [math.PR] 4 Jan 2016
LOUIS-PIERRE ARGUIN Abstract. These notes were written for the mini-course Extrema of log-correlated random variables: Principles and Examples at the Introductory School held in January 2015 at the Centre International de Rencontres Math´ematiques in Marseille. There have been many advances in the understanding of the high values of log-correlated random fields from the physics and mathematics perspectives in recent years. These fields admit correlations that decay approximately like the logarithm of the inverse of the distance between index points. Examples include branching random walks and the twodimensional Gaussian free field. In this paper, we review the properties of such fields and survey the progress in describing the statistics of their extremes. The branching random walk is used as a guiding example to prove the correct leading and subleading order of the maximum following the multiscale refinement of the second moment method of Kistler. The approach sheds light on a conjecture of Fyodorov, Hiary & Keating on the maximum of the Riemann zeta function on an interval of the critical line and of the characteristic polynomial of random unitary matrices.
Contents 1. Introduction 1.1. Statistics of extremes 1.2. Log-correlated fields 1.3. Relations to statistical physics 2. Examples and general properties 2.1. Branching random walk 2.2. 2D Gaussian free field 3. Order of the maximum 3.1. Leading order of the maximum 3.2. Subleading order of the maximum 4. Universality classes of log-correlated fields 4.1. Maximum of the Riemann zeta function on an interval 4.2. Maximum of the characteristic polynomial of random unitary matrices References
1 3 6 8 10 10 12 15 15 19 23 23 26 29
1. Introduction There has been tremendous progress recently in the understanding of the extreme value statistics of stochastic processes whose variables exhibit strong correlations. The purpose 2000 Mathematics Subject Classification. 60G70, 60G60. Key words and phrases. Extreme Value Theory, Gaussian Fields, Branching Random Walk. L.-P. A. is supported by the NSF grant DMS 1513441, the PSC-CUNY Research Award 68784-00 46, and partially by a NSERC Discovery grant and FQRNT Nouveaux chercheurs grant. 1
2
L.-P. ARGUIN
of this paper is to survey the recent progress in this field for processes with logarithmically decaying correlations. The material has been developed for the mini-course Extrema of log-correlated random variables: Principles and Examples at the Introductory School held in January 2015 at the Centre International de Rencontres Math´ematiques in Marseille for the trimester Disordered systems, Random spatial processes and Applications of the Institut Henri-Poincar´e. The study of extreme values of stochastic processes goes back to the early twentieth century. The theory was developed in the context of independent or weakly correlated random variables. The first book regrouping the early advances in the field is the still relevant Statistics of Extremes by E.J. Gumbel [43] published in 1958. Gumbel credits the first work on extreme values to Bortkiewicz in 1898, which is one of the first paper emphasizing the importance of Poisson statistics. After progress by Fisher and Tippett in understanding the limit law of the maximum of a collection of IID random variables, the theory culminated in 1943 with the classification theorem of Gnedenko [42] which showed that the distribution of the maximum of N independent and identically distributed (IID) random variables when properly recentered and rescaled can only be of three types: Fr´echet, Weibull or Gumbel. Prior to this, von Mises had shown sufficient conditions for convergence to the three types. All in all, it took the theory sixty years between the first rigorous results and an essentially complete theory as it appears in Gumbel’s review. There are now many excellent textbooks on extreme value statistics, see e.g. [19, 28, 49, 54]. The classical theory however does not apply to collections of random variables that exhibit strong correlations, i.e. correlations of the order of the variance. As Gumbel points out at the very beginning of Statistics of Extremes: Another limitation of the theory is the condition that the observations from which the extremes are taken should be independent. This assumption, made in most statistical work, is hardly ever realized. In the last thirty years, there have been important breakthroughs in mathematics and in physics to identify universality classes for the distributions of extreme values of strongly correlated stochastic processes. One such class that has attracted much interest in recent years is the class of log-correlated fields. Essentially, these are stochastic processes for which the correlations decay logarithmically with the distance. Even though the theory has not reached a complete status as in the IID case, there has been tremendous progress in identifying the distribution of extremes in this case and to develop rich heuristics that describe accurately the statistics of large values. There are already excellent survey papers on the subject by Bovier [20] and Zeitouni [57], all offering a different perspective on log-correlated fields. The present paper modestly aims at complementing the growing literature on the subject by focusing on the techniques to obtain precise estimates on the order of the maximum of log-correlated fields and their potential applications to seemingly unrelated problems: the maxima of the characteristic polynomials of random matrices and the maxima of the Riemann zeta function on an interval of the critical line. The approach we take is based on Kistler’s multiscale refinement of the second moment method introduced in [46]. The presentation is organized as follows. In Section 1, we review the basic theory in the case of IID random variables and will introduce log-correlated fields in generality. Section 2 focuses on two important examples of log-correlated fields: branching random walks and the two-dimensional Gaussian free field. In particular, three properties of these
EXTREMA OF LOG-CORRELATED RANDOM VARIABLES:
PRINCIPLES AND EXAMPLES
3
fields (and of log-correlated fields in general) are singled out as they play a crucial role in the analysis of extremes. In Section 3, we describe the general method of Kistler to prove fine asymptotics for the maximum of log-correlated fields [46]. Finally, in Section 4, we will explain how the method is expected to be applicable to study the high values of the characteristic polynomials of random matrix ensemble as well as the large values of the Riemann zeta function on an interval of the critical line. Acknowledgements I am grateful to Jean-Philippe Bouchaud, Pierluigi Contucci, Cristian Giardina, Pierre Nolin, Vincent Vargas, and Vladas Sidoravicius for the organization of the trimester Disordered systems, Random spatial processes and Applications at the the Institut HenriPoincar´e in the spring 2015. I also thank the Centre International de Rencontres Math´ematiques and its staff for the hospitality and the organization during the Introductory School. This work would not have been possible without the numerous discussions with my collaborators on the subject: David Belius, Paul Bourgade, Anton Bovier, Adam J. Harper, Nicola Kistler, Olivier Zindy, and my students Samuel April, Fr´ed´eric Ouimet, Roberto Persechino, and Jean-S´ebastien Turcotte. 1.1. Statistics of extremes. We are interested in the problem of describing the maxima of a stochastic process in the limit where there are a large number of random variables. For example, consider the process consisting of IID centered Gaussian random variables. One realization of this process for 210 variables is depicted in Figure 1 with a particular choice of the variance. The maximum of the rugged landscape of this realization lies around 6. If we repeat this exercise for several realizations, we would observe that this is the case for every realization: the maximum has fluctuations roughly of order one around a deterministic value which is close to 6. 6
4
2
0.2
0.4
0.6
0.8
1.0
-2
-4
-6
Figure 1. A realization of 210 centered Gaussian random variables of variance 12 log 210 . Now consider a drastically different stochastic process: let U be a random 210 × 210 unitary matrix sampled uniformly from the unitary group and consider the modulus of the characteristic polynomial on the unit circle PU (θ) = det(eiθ − U) .
A realization of the logarithm of this quantity on the interval [0, 2π] is given in Figure 2. This random process is of course qualitatively very different from the IID process above.
4
L.-P. ARGUIN 6 4 2
1
2
3
4
5
6
-2
-4
-6
-8
Figure 2. A realization of PU (θ) on [0, 2π] of a random unitary matrix U of size 210 × 210 . It is not Gaussian and it is a continuous process with singularities at the eigenvalues of U . However, perhaps by coincidence, the maximum of the landscape lies also around 6. In fact, if we repeat the experiment, we would again observe that the maximum fluctuates around a deterministic value close to 6. If we were precise enough, we would see that the deterministic value is close to the one for IID variables but there is a slight discrepancy. The conjecture of Fyodorov-Hiary-Keating [39, 40] makes a detailed prediction for the maximum of PU (θ). The distribution of the maximum is different in the limit of a large number of variables from the one of IID, though it is close. However, it is a perfect match with the distribution of log-correlated Gaussian field. This conjecture is still open (even to first order). However, the mechanism that would be responsible for this conjecture to hold is now quite clear. This is the goal of this review to illustrate the techniques for log-correlated fields in the forthcoming sections and their relations to PU (θ) in Section 4. Throughout the paper, the framework will be as follows. The random field will be indexed by a discrete space Vn with 2n points. One important example is Vn = {−1, 1}n representing the configurations of n spins. In most examples, Vn will be equipped with a metric that we denote d(v, v 0 ), v, v 0 ∈ Vn . We consider the random field X(n) = {Xv (n), v ∈ Vn } . defined on a probability space (Ω, P ). We will suppose without loss of generality that E[Xv (n)] for all v ∈ Vn . In most examples, the variance will be the same for every v ∈ Vn . This is not true for the two-dimensional Gaussian free field because of the boundary effect. However, the variance is almost uniform for most points which ultimately does not affect the results, but complicate the analysis. With this in mind, we choose to parametrize the variance as E[Xv (n)] = σ 2 n , for some σ 2 . This turns out to be the correct physical parametrization: it gives a a non-trivial limit for the free energy per spin in the limit n → ∞, cf. Section 1.3. Even though the analysis we present are not limited to Gaussian fields, it is convenient to present the ideas in this setting. There are many advantages to do so. First, the distribution of the field X(n) is then entirely determined by the covariances E[Xv (n)Xv0 (n)] .
EXTREMA OF LOG-CORRELATED RANDOM VARIABLES:
PRINCIPLES AND EXAMPLES
5
Second, estimates for the probability of large values for Gaussians are very precise: it is not hard prove the Gaussian estimate for Xv (n) ∼ N (0, σ 2 n), √ � � √ a2 (1 + o(1)) σ 2 n √ exp − 2 for a > σ 2 n. (1) P (Xv (n) > a) = a 2σ n 2π Finally, comparison results for Gaussian processes can be used in some instances to bound functionals of the processes above and below with functionals of processes with simpler correlation structures. The central question of extreme value theory is to describe the functional max Xv (n) in the limit n → ∞. v∈Vn
As for other global functionals of a stochastic process such as the sum, it is reasonable to expect universality results for the limit, i.e. results that depend mildly on the fine details of the distributions of X(n). From a physics perspective, this question corresponds to describing the ground state energy of a system with state space Vn and energy −Xv (n) for the state v. The system is said to be disordered because the energies depend on the realization of the sample space Ω. A realization of the process as depicted in Figures 1 and 2 from this point of view represents the energy landscape of the system for a given disorder. With a perhaps naive analogy with the limit theorems for sum of IID random variables, one might expect a corresponding law of large numbers and central limit theorems for the maximum. More precisely, the problem is to: (2) Xv (n) − an converges in law. Find a recentering an and rescaling bn such that max v∈Vn bn If these sequence exist, it suggests that there is a non-trivial random variable M independent of n such that the approximate equality holds: max Xv (n) ≈ an + bn M . v∈Vn
In this regard, the recentering an is the term analogous to the law of large numbers whereas bn sizes the magnitude of the fluctuations with distribution M, thus belongs to the central limit theorem regime. Of course, an should be unique up to an additive constant and bn , up to a multiplicative constant. We refer to an as the order of the maximum. We shall focus on general techniques to rigorously obtain the order of the maximum an for log-correlated fields in Section 3. The proofs of fluctuations are technically more involved, but the heuristics developed for the order of the maximum are crucial to the analysis at a more refined level. The starting point of our analysis is the result when Xv (n) are IID Gaussians with variance σ 2 n. In this case, the problem (2) is a simple exercise and has a complete answer. Proposition 1. Let X(n) √ = (Xv (n), v = 1, . . . , 2n ) be IID centered Gaussians with variance σ 2 n. Then for c = 2 log 2σ and (3)
an = cn −
1 σ2 log n, 2 c
bn = 1,
6
L.-P. ARGUIN
we have � lim P
n→∞
� max Xv (n) ≤ an + bn x v∈Vn
σ/c = exp(−Ce−cx ) , with C = √ . 2π
In other words, the maximum converges in distribution to a Gumbel random variable also known as double-exponential. The order of the maximum is linear in n at first order √ with velocity c = 2 log 2σ. The subleading order is logarithmic in n. The proof of this is simple but is instructive for the case of log-correlated fields. The same type of arguments can be used for the order statistics, i.e. the joint distribution of first, second, third, etc maxima. It converges to a Poisson point process with exponential density. Proof of Proposition 1. Clearly, since the random variables are IID, we have � � � �2n 2n P (Xv (n) > an + bn x) P max Xv (n) ≤ an + bn x = 1 − . v∈Vn 2n This implies that the convergence of the distribution reduces to show that 2n P (Xv (n) > an + bn x) converges for an appropriate choice of an and bn . The right side is exactly the expected number of exceedances, that is E [N (y)] ,
where N (y) = #{v ∈ Vn : Xv (n) > y}
for y = an + bn x. It is not hard to prove using the Gaussian estimate (1) that the choice 2 an = cn − 21 σc log n and bn ensures the convergence. In fact, the leading order cn lies in the large deviation regime for the distribution Xv (n). It compensates exactly the entropy 2 term 2n . As for the subleading order − σ2c , it balances out the fine asymptotics √ σ2n σ2n = = O(n−1/2 ) an cn(1 + o(1)) in the Gaussian estimate. � It is a real challenge to achieve precise results of the kind of Proposition 1 for a stochastic X(n) with correlations of the order of the variance. Correlations should affect the order of the maximum and its fluctuations, but to which extent ? It is reasonable to expect the statistics of extremes of such processes to retain features of the IID statistics if we look at a coarse-enough scale. When correlations are present the expected number of exceedances is no longer a good proxy for the correct level of the maximum, since by linearity of the expectations, it is blind to correlations and is the same as IID. The expected number of exceedances turns out to be inflated by the rare events of exceedances far beyond the right level of the maximum. As we will see in Section 3, the number of exceedances need to be modified to reflect the correct behavior of the maxima. 1.2. Log-correlated fields. In the framework where X(n) = (Xv (n), v ∈ Vn ) is a stochastic process on a metric space Vn with distance d, a log-correlated field has correlations (4)
E[Xv (n)Xv0 (n)] ≈ − log d(v, v 0 ) .
In particular, the correlation decays very slowly with the distance! Slower than any power. We emphasize that the covariance might not be exactly logarithmic for the field to exhibit a log-correlated behavior. For one, the covariance matrix must be positive definite, hence the covariance might be exactly the logarithm of the distance. Moreover, the logarithmic behavior might only be exhibited in the bulk due to some boundary effect. As we will see in Section 2, this is the case for the two-dimensional Gaussian free
EXTREMA OF LOG-CORRELATED RANDOM VARIABLES:
PRINCIPLES AND EXAMPLES
7
field. Other important examples of processes in this class are branching random walks and models of Gaussian multiplicative chaos. It is good to re-express (4) in terms of the size of neighborhoods with a strong correlations with a fixed point v. More precisely, for r > 0, consider the number of points v 0 whose covariance is a fraction r of the variance. The logarithmic nature implies that 1 � 0 E[Xv (n)Xv0 (n)] (5) > r ≈ 2−rn . # v ∈ Vn : n 2 2 E[Xv (n) ] In other words, it takes approximately 2rn balls to cover the space Vn with neighborhoods where correlations between points is greater than r times the variance. In particular, the size of these neighborhoods lies at the mesoscopic scales compared to the size of the systems. This will play an important role in the analysis of Sections 2 and 3. The motivations for the study of log-correlated fields are now plenty. On one hand, in the physics literature, the work of Carpentier & Ledoussal [26] spurred a lot of interest in the study of such processes as energy landscapes of disordered systems. We mention in particular the works of Fyodorov & Bouchaud [38] and Fyodorov et al. [41]. These papers develop a statistical mechanics approach to the problem of describing the extreme value statistics of the systems that are applicable to a wide range of systems. Second, these processes play an essential role in Liouville quantum gravity as well as models of threedimensional turbulence. We refer to the excellent review on Gaussian Multiplicative Chaos of Rhodes & Vargas [55] and references therein for details in these directions. Third, many models of volatility in finance are now built on the assumption that the timecorrelations of the returns are log-correlated, see also [55] for more details on this. Finally, as we shall see in Section 4, log-correlated fields seem to provide the right structure to study the local maxima of the Riemann zeta function on the critical line as suggested in [39, 40]. It is argued in the physics literature that the distribution of the maximum of logcorrelated fields is a borderline case where the features of IID statistics should still be apparent. In fact, it is expected that the following should hold for log-correlated fields that are close to Gaussians in some suitable sense. Conjecture 1 (Informal). Let X(n) = {Xv (n), v ∈ Vn } be a log-correlated field in the √ 2 2 sense of (4) with E[Xv (n)] = 0 and E[Xv (n) ] ≈ σ n. Then for c = 2 log 2σ and an = cn −
(6) we have
3 σ2 log n, 2 c
� lim P
n→∞
bn = 1, �
max Xv (n) ≤ an + bn x v∈Vn
= E[e−CZe
−cx
].
for some constant C and random variable Z called the derivative martingale. This is to be compared with Proposition 1 for IID random variables. Perhaps surprisingly, the first order of the maximum is the same as for IID with the same velocity. The correlations start having an effect in the subleading where 12 for IID is changed to 3 . This seemingly small change hides an important mechanism of the extreme value sta2 tistics that will be explained in Section 3.2. For now, let us just observe that under the 2 recentering an = cn − 32 σc log n, the expected number of exceedances diverges like n. To get the correct order, it will be necessary to modify the exceedances with a description of the values at each scale of the field. Finally, the fluctuations are not exactly Gumbel as for IID Gaussians. The distribution is a mixture of Gaussians, the mixture being on
8
L.-P. ARGUIN
the different realizations of the random variables. This in fact changes qualitatively the nature of the distribution as it is expected that the right tail behaves like xe−cx for x large whereas as it is e−cx for double exponential distribution. Conjecture 1 was proved in many instances of log-correlated fields. The most important contribution is without a doubt the seminal work of Bramson [25] who proved the result for branching Brownian motion (see Lalley & Sellke [47] for the expression in terms of the derivative martingale). For branching random walks, it was proved in great generality by A¨ıdekon [3], see also [1,14,24]; for the two-dimensional Gaussian free field, by Bramson et al. [23] (see Biskup & Louidor [17] for the expression in terms of the derivative martingale), for a type of Gaussian Multiplicative Chaos by Madaule [50], and finally in great generality for log-correlated Gaussian fields by Ding et al. [35]. We will not have time in this review paper to touch the subject of the order statistics or extremal process of log-correlated fields. Again, it turns out that the statistics retain features of the IID case. In fact, it is expected that the extremal process is a Poisson cluster process or Poisson decorated point process. This was proved for branching Brownian motion in [4, 8–10], for branching random walks in [51], and partially for the two-dimensional Gaussian free field in [17]. 1.3. Relations to statistical physics. Questions of extreme value statistics such as Conjecture 1 can be addressed from a statistical physics point of view. In that case the object of interest is the partition function X (7) Zn (β) = exp(βXv (n)), β > 0. v∈Vn
(Observe that we use β as opposed to the customary −β since we are interested in the maximum and not the minimum of X(n).) By design, the points v with a high value of the field have a greater contribution to the partition function, and the continuous parameter β (the inverse temperature) adjusts the magnitude of the contribution. The free energy per particle or normalized log-partition function is also of importance: (8)
fn (β) =
1 log Zn (β) . βn
In particular, in the limit n → ∞, the free energy contains the information on the first order of the maximum. Indeed, we have the elementary inequalities maxv∈Vn Xv (n) log 2 maxv∈Vn Xv (n) ≤ fn (β) ≤ + , n β n therefore maxv∈Vn Xv (n) = lim lim fn (β), whenever the limits exist. n→∞ β→∞ n→∞ n lim
To obtain finer information on the maximum such as subleading orders or fluctuations, one could study directly the partition functions Zn (β). For example, one could compute the moments of Zn (β) and try to infer the distribution of Zn (β) from it. This is the approach taken in [38, 41] for example, but there are major obstacles to overcome to make this type of arguments fully rigorous.
EXTREMA OF LOG-CORRELATED RANDOM VARIABLES:
PRINCIPLES AND EXAMPLES
9
For log-correlated fields, it is possible to compute rigorously the free energy by the Laplace method. We have by rearranging the sum over v that X 1 exp(βnE + nSn (E)) , (9) fn (β) ≈ log n E∈[0,c]
where (10)
Sn (E) =
1 1 log Nn (En) = log #{v ∈ Vn : Xv (n) > En} . n n
is the entropy or log-number of high points, i.e. En. In the limit, it is possible to prove in some log-correlated fields ( 0 (11) S(E) = lim Sn (E) = E2 n→∞ log 2 − 2σ 2
the log-number of exceedances at level cases, see e.g. [27] and [12, 13], that for if E ≥ c in probability, if E ∈ [0, c]
√ where c = 2 log 2σ. We will see a general method to prove this in Section 3.1. Note that this is exactly the result one would obtain for IID random variables by applying (1)! The free energy is then easily calculated like a Gibbs variational principle � � ( 2 2 E2 if β < σc2 log 2 + β 2σ (12) lim fn (β) = max βE + log 2 − 2 = n→∞ E∈[0,c] 2σ cβ if β ≥ σc2 .
Again, not suprisingly, the free energy of log-correlated fields corresponds to the one for IID variables also known as the Random Energy Model (REM) as introduced by Derrida [30]. In particular, the free energy exhibits a freezing phase transition, i.e. for β > σc2 , the free energy divided by β is constant reflecting the fact the partition function is supported on the maximal values of the field. Equation (12) was first proved for branching random walks by Derrida & Spohn [32] who pioneered the study of log-correlated random fields as disordered systems. Equation (12) was also proved for other log-correlated Gaussian fields in [12, 13]. Another important object in statistical physics is the Gibbs measure which in our context is a random probability measure on Vn defined as (13)
Gn,β (v) =
exp βXv (n) , v ∈ Vn . Zn (β)
This contains refined information on the order statistics of the field X(n). We only mention here that the limiting distribution of the Gibbs measure depends on the parameter β. In particular, the annealed Gibbs measure Gann n,β (v) =
exp βXv (n) E[Zn (β)]
should have a non-trivial continuous limit for high temperature β < σc2 [55], whereas for low temperature β ≥ βc , the quenched Gibbs measure as in (13) is the relevant limiting object and should be singular [12, 13].
10
L.-P. ARGUIN
2. Examples and general properties Branching random walk serves as a guiding example to prove rigorous results for logcorrelated fields. In particular, we will use it to illustrate three important properties of log-correlated fields. We will refer to these as the multi-scale decomposition, the dichotomy of scales and the self-similarity of scales. As we will see these properties do not hold exactly for general log-correlated fields, like the 2D Gaussian free field. However, they hold approximately enough to reproduce the extremal behavior. 2.1. Branching random walk. We will focus on a simple example of branching random walk (BRW), where the branching is binary and the increments are Gaussian. This process is sometimes called hierarchical Gaussian field. More specifically, let Vn be the leafs of a binary rooted tree with n generations. The field is indexed by Vn and thus has 2n random variables. As before, we denote the field by X(n) = {Xv (n) : v ∈ Vn } . The random variables Xv (n) are constructed as follows. We consider {Ye } IID centered Gaussian random variables of variance σ 2 indexed by the edges of the binary tree. The parameter σ 2 will be adjusted when we compare log-correlated fields to approximate branching random walks. For a given leaf v ∈ Vn , the random variable Xv (n) is given by the sum of the Ye ’s for the edges e on the path from the root ∅ to the leaf v, i.e. , X Xv (n) = Ye . e: ∅→v
We will often abuse notation and write Yv (l) for the variable Ye for the leaf v at level l in the tree. In other words, (14)
Xv (n) =
n X
Yv (l) .
l=1
We refer to Yl (v) as the increment at scale l of Xv (n). With this definition, it is easy to see that the variance of each variable is n X 2 E[Xv (n) ] = E[Yv (l)2 ] = σ 2 n . l=1 0
As for the covariance for v, v ∈ Vn , we need to define
v ∧ v 0 , the level of the tree where the paths of v and v 0 to the root split.
We call v ∧ v 0 the branching time or branching scale of v and v 0 . Note that 0 ≤ v ∧ v 0 ≤ n. See Figure 3 for an illustration. It then follows directly from the definition (14) that 0
E[Xv (n)Xv0 (n)] =
v∧v X l=1
E[Yv2 (l)] = σ 2 (v ∧ v 0 ) .
The covariance matrix completely determines the distribution of the centered Gaussian field X(n). Why is the field X(n) log-correlated ? The best way to see this is to think in terms of neighborhood with a certain covariance as in equation (5). Indeed, let 0 ≤ r ≤ 1, and
EXTREMA OF LOG-CORRELATED RANDOM VARIABLES:
l=0
PRINCIPLES AND EXAMPLES 11
;
Scales l
Yv (1) v ^ v0 Yv (2)
Yv0 (2)
Yv (3)
Yv (4) l=n
v
v0
Figure 3. An illustration of a binary branching random walk with increments Yv (l) at each scale 0 ≤ l ≤ n. suppose for simplicity that rn is an integer. Then the size of the neighborhood of a given v with covariance rσ 2 n with v is exactly � E[Xv (n)Xv0 (n)] ≥ r = 2n−rn . # v 0 ∈ Vn : 2 σ n 0 It corresponds to those v which branched out from v at level rn ! It is a ball of size 2n(1−r) and is of mesoscopic scale compared to the size of the systems. There are three elementary properties of BRW which will have their counterpart for any log-correlated field. These properties will be key to guide our analysis in more complicated models. • Multiscale decomposition: The first property simply refers to the decomposition (14) into independent increments. 1
Xv (n) =
n X
Yv (l) .
l=1
• Dichotomy of scales: Another simple consequence of the definition of BRW is the fact that for scales before the branching points of v and v 0 , the increments are perfectly correlated whereas after the branching point, they are exactly independent. In other words: ( σ 2 if l ≤ v ∧ v 0 , (15) E[Yl (v)Yl (v 0 )] = 0 if l > v ∧ v 0 . We refer to this abrupt change in correlations for the increments as the dichotomy of scales. • Self-similarity of scales: In the case of BRW, the increments at each scale are identically distributed. In particular, together with the property of P dichotomy, this property implies that for a given 0 < l < n, the variables Xv (l) = lk=1 Yv (k) define a process X(l) with 2l distinct values. Moreover, this process is exactly a BRW with l levels. Similarly, for a given v, we can define the variables {Xv0 (n) − Xv0 (l) : v 0 ∧ v ≥ l} .
12
L.-P. ARGUIN
This defines a BRW on 2n−l points corresponding to the subtree with the common ancestor at level l acting as the root. We point out that the above construction leads to a natural generalization of fields by modifying the variance of the increments in the multiscale decomposition at each scale. The self-similarity is lost in these models. The study of such types of models go back to Derrida who introduced the Generalized Random Energy Models [31]. In the case of BRW, these are called time-inhomogeneous BRW. They were studied in [21, 22,36, 37, 52]. A similar scale-inhomogenous field for the Gaussian free field was introduced and studied in [11, 13]. 2.2. 2D Gaussian free field. The discrete two-dimensional Gaussian free field (2DGFF) is an important model of random surfaces. Let Vn be a finite square box of Z2 . To emphasize the similarities with BRW, we suppose that #Vn = 2n . The 2DGFF is a centered Gaussian field X(n) = {Xv (n), v ∈ Vn } defined as follows. Let Pv be the law of a simple random walk (Sk , k ≥ 0) starting at v ∈ Vn and Ev , the corresponding expectation. Denote by τn the first exit time of the random walk from Vn . We consider the covariance matrix given by "τ # n X (16) E[Xv (n)Xv0 (n)] = Ev 1Sk =v0 = Gn (v, v 0 ) . k=0
The right-hand side is the expected number of visits to v 0 of a random walk starting at v before exiting Vn . It is not hard to show, using the Markov propery of the random walk, that the right-hand side is the Green’s function of the discrete Laplacian on Vn with Dirichlet boundary conditions. More precisely, for f a function on the vertices of Vn , the discrete Laplacian is 1X −∆f (v) = f (ω) − f (v) = Ev [f (S1 ) − f (v)] , 4 ω∼v where ω ∼ v means that ω and v share an edge in Z2 . The Green’s function can be seen as the inverse of the discrete Laplacian in the sense that it satisfies ( 1 if v = v 0 , −∆Gn (v, v 0 ) = δv0 (v) = 0 if v 6= v 0 . In particular, the Green’s function is symmetric and positive definite, since the Laplacian is. The density of the 2DGFF is easily obtained from the covariance (16). Indeed, by rearranging the sum, we have X 1X (xv − xv0 )2 = xv (−∆)xv . 4 v v∼v 0 Again, since the Green’s function is the inverse of −∆, we have that (17)
1 1X P (Xv (n) ∈ dxv , v ∈ Vn ) = exp − (xv − xv0 )2 Z 8 v∼v0
! ,
for the appropriate normalization Z. Why is this field log-correlated ? It is reasonable to expect this since the Green’s function of the Laplacian in the continuous setting decays logarithmically with the distance.
EXTREMA OF LOG-CORRELATED RANDOM VARIABLES:
PRINCIPLES AND EXAMPLES 13
This analogy can be made rigorous using random walk estimates. In fact, it is possible to show, see e.g. [48], that "τ # n X (18) Gn (v, v 0 ) = Ev 1Sk =v0 = Ev [a(v 0 , Sτn )] − a(v, v 0 ) k=0
where a(v, v) = 0 and if v 6= v
0
1 log d(v, v 0 )2 + O(1) + O(d(v, v 0 )−2 ) , π where d(v, v 0 ) is the Euclidean distance in Z2 . In particular, this implies that for points 2n not too close to the boundary, the field is log-correlated: Gn (v, v 0 ) = π1 log d(v,v 0 )2 + 0 −2 O(d(v, v ) ). Moreover, we get the following upper bound on the variance: a(v, v 0 ) =
1 log 2n + O(1) . π Again, a matching lower bound follows from (18), but only for points far from the boundary. As first step towards a connection to BRW, these estimates already suggest that the BRW parameter σ 2 should be taken to be Gn (v, v) ≤
log 2 . π To make the connection with an approximate BRW more precise, we shall need three fundamental facts. First, it is not hard to prove from the density (17) that the field satisfies the Markov property, that is for any finite box B in Vn , (19) {Xv (n), v ∈ B} is independent of the field in B c given the field on the boundary ∂B. σ 2 −→
Here the boundary ∂B refers to the vertices in B c that share an edge with a vertex in B. This property essentially follows from (17) since the correlations are expressed in terms of nearest neighbors. Second, it follows from the Markov property that the conditional expectation of the field inside v given the boundary is simply a linear combination of the field on the boundary. More precisely, we have X (20) E[Xv (n)|{Xv0 (n), v 0 ∈ B c }] = pu (v)Xu (n) u∈∂B
where pu (v) is the probability of a simple random walk starting at v to exit B at u. The specific form of the coefficient of the linear combination is proved using the strong Markov property of the random walk. A similar argument shows that the process is self-similar. Namely, if we write Xv (B) = E[Xv (n)|{Xu (n), u ∈ ∂B}] for the harmonic average of Xv (n) on the boundary of B, we have o (21) {Xv (n) − Xv (B), v ∈ B is a 2DGFF on B, in the sense that it is a Gaussian free field with covariance (16) restricted to B. The third property shows that if v and v 0 are in B, then Xv (B) and Xv0 (B) should be close, if they are not too close to the boundary of B. More precisely, say B is a square box or a disc containing 2l points for some l. Estimates of the Green’s function as in (18) can be used to show that, see e.g. Lemma 12 in [18], (22)
E[(Xv (B) − Xv0 (B))2 ] ≤ O(d(v, v 0 )2−l/2 )
14
L.-P. ARGUIN
whenever the distance of v and v 0 to the center of B is of the order of 2(l−1)/2 or less, to avoid boundary effects. The connection between the 2D Gaussian free field and an approximate BRW is made through Equations (19), (21), and (22). For each v ∈ Vn and 0 ≤ l ≤ n, we define [v]l , a neighborhood of v containing 2n−l points. For simplicity, suppose that [v]l is a square box. If such a neighborhood is not entirely contained in Vn , we define [v]l to be the intersection of the neighborhood with Vn . Note that these neighborhoods shrink as l increases. By convention, we take [v]0 = Vn and [v]n = {v}. The boundary is denoted ∂[v]l and the union of ∂[v]l with its boundary will be denoted by [v]l . The connection of 2DGFF with BRW is illustrated in Figure 4 and is as follows. For simplicity, we assume that all vertices v are not too close to the boundary of Vn . Multiscale decomposition: The decomposition here is simply a martingale decomposition. Namely, we define the field of v ∈ Vn at scale l as Xv (l) = E[Xv (n)|{Xv0 (n) : v 0 ∈ [v]cl }] = E[Xv (n)|{Xu (n) : u ∈ ∂[v]l }] ,
where the second equality is by the Markov property. Note that for each v ∈ Vn , (Xv (l), 0 ≤ l ≤ n) is a martingale by construction. Define the increments at scale l as the martingale difference Yv (l) = Xv (l) − Xv (l − 1) , 1 ≤ l ≤ n . These increments are orthogonal by construction. Since the field is Gaussian, so are the conditional expectations. In particular, the increments are independent of each other for a given v. Thus, the decomposition (23)
Xv (n) =
n X l=1
Yv (l) , v ∈ Vn ,
seems so far to be the right analogue of the multiscale decomposition of BRW. It remains to check the other two properties. Self-similarity of scales: First, note that the increments are Gaussian by definition. The fact that the increments have approximately the same variance follows from (21). Indeed, for 0 ≤ l ≤ n, the variance of Xv (n) − Xv (l) is by (18)
log 2 + O(1) , π Because Xl (v) is orthogonal to Xv (n) − Xv (l), we deduce that E[(Xv (n) − Xv (l))2 ] = (n − l)
log 2 + O(1) . π In particular, since Xv (l + 1) admits the orthogonal decomposition Xv (l) + Yv (l + 1), this implies log 2 E[Yv (l)2 ] = + o(1) π where o(1) is summable, so the contribution of the sum over l of the error is O(1). This justifies the choice σ 2 = log 2/π for the comparison with BRW. Of course, here, the increments are not exactly identically distributed, but since the error is summable, it will not affect the behavior of the extremes. Dichotomy of scales: It remains to establish the correlations of the increments between two distinct v, v 0 . For this purpose, it is useful to define the branching scale v ∧ v 0 as E[Xv (l)2 ] = l
EXTREMA OF LOG-CORRELATED RANDOM VARIABLES:
PRINCIPLES AND EXAMPLES 15
follows (24)
v ∧ v 0 = min{0 ≤ l ≤ n : [v]l ∩ [v 0 ]l = ∅},
that is the smallest scale for which the neighborhoods of v and v 0 (including their boundaries) are disjoint. Note that because the neighborhoods have size 2n−l , the branching scale v ∧ v 0 is related to the distance by 0
d(v, v 0 )2 ≈ 2n−v∧v .
For small scales, a direct application of the Markov property (19) yields E[Yv (l)Yv0 (l)] = 0 if l > v ∧ v 0 .
This is because if l > v ∧ v 0 , then the neighborhoods of v and v 0 do not intersect and are contained in each other’s complement. For scales larger than the branching scale, we expect the increments to be almost perfectly correlated. To see this, note that by definition, for l = v∧v 0 −1, then the neighborhoods intersect but for larger neighborhoods, that is l < v ∧ v 0 − 1, v and v 0 must be contained in each other’s neighborhood. In particular, an application of (22) gives E[(Xv (l) − Xl (v 0 ))2 ] = O(1) .
In other words, the vectors Xv (l) and Xl (v 0 ) are close in L2 . Since these vectors are sums of orthogonal increments, these increments must be also close. In particular, we get E[Yv (l)Yv0 (l)] =
log 2 + o(1) if l < v ∧ v 0 − 1, π
where o(1) is summable in l. This completes the construction of an approximate BRW embedded in 2DGFF. We remark that the dichotomy of scales is not as clean cut as the one of BRW in (15). In particular, nothing precise can be said for the correlation between exactly at the branching scale l = v ∧ v 0 . It turns out that the coupling and decoupling of the increments do not have to be perfect as long as they occur fast enough. The same will be true for nonGaussian models in Section 4. 3. Order of the maximum In this section, we explain a general method to show the leading and subleading orders of the maximum for log-correlated fields in Conjecture 1. We will prove them in the case of Gaussian branching random walk on the binary tree, following the treatment in [46]. We will also prove the convergence of the log-number of high points or entropy, cf. (11). The heuristic is (or expected to be) the same for more complicated log-correlated models, such as the two-dimensional Gaussian free field. The multiscale decomposition of the field plays a fundamental role in the proof. This is also true when proving more refined results such as the convergence of the maximum and of the extremal process. In a nutshell, to prove such results on the maximum, one needs to understand the contribution of the increments at each scale to a large value of the field. 3.1. Leading order of the maximum. Recall the definition of the Gaussian BRW X(n) on a binary tree defined in Section 2.1. The following result yields the leading order of the maximum
16
L.-P. ARGUIN
l
0 scales l l Yv (l)
v0
1 l
2n
v^v 0
v
v ^ v0
k
k Yv (k)
Yv0 (k)
1
k
1
k l l
n v
v
1
0
Figure 4. An illustration of the approximate branching structure defined by the 2DGFF. The grey area represents the increments at each scale. Theorem 2. Let X(n) = {Xv (n) : v ∈ Vn } be a branching random walk on a binary tree with n levels as in (23) with Gaussian increments of variance σ 2 . Then maxv∈Vn Xv (n) p = 2 log 2 σ in probability. lim n→∞ n The theorem goes back to Biggins for general BRW [16]. The analogue for the 2DGFF was proved by Bolthausen, Deuschel & Giacomin [18]. We point out that Kistler greatly simplified the proof in both cases [46] using a multiscale refinement of the second moment method. This approach also makes the analysis amenable to non-Gaussian models. We refer the reader directly to [46] for a proof of the theorem. We shall instead use Kistler’s method to prove a very similar result on the log-number of high points or exceedances. Theorem 3. Let X(n) = {Xv (n) : v ∈ Vn } be a branching random walk on a binary tree with n levels as in (23) with Gaussian increments of variance σ 2 . Then for 0 ≤ E < c = √ 2 log 2σ, � � 1 E2 lim log #{v ∈ Vn : Xv (n) > En} = log 2 1 − 2 in probability. n→∞ n c In other words, the number of points whose field value is larger than En is approx2 2 imately 2n(1−E /c ) with large probability for E smaller than the maximal level c. We stress that this is the same result for 2n IID Gaussian random variables of variance σ 2 . The analogue of this result for 2DGFF was shown by Daviaud in [27]. Proof. Upper bound: To bound the number of points beyond a given level, it suffices to 1 use Markov’s inequality. Let Nn (En) = #{v ∈ Vn : Xv (n) > En} .
Then for a given ε > 0, we have � �� � � � 2 2 −n(1+ε) 1− E2 n(1+ε) 1− E2 c c ≤2 E[Nn (En)] . (25) P Nn (En) > 2
EXTREMA OF LOG-CORRELATED RANDOM VARIABLES:
PRINCIPLES AND EXAMPLES 17
By linearity, the expectation is simply � � E2 E 2n E[Nn (En)] = 2 P (Xv (n) > En) ≤ 2 exp − 2 = 2n(1− 2c2 ) 2σ n
n
where we use the Gaussian estimate (1) with Xv (n) ∼ N (0, σ 2 n). It follows that the probability in (25) goes to 0. This proves the upper bound. Lower bound: It remains to show that � �� � 2 n(1−ε) 1− E2 c →1. P Nn (En) > 2 The lower bound is an application of the Paley-Zygmund inequality, which states that for any random variable N > 0 and 0 ≤ δ ≤ 1, (26)
P (N > δE[N ]) ≥ (1 − δ)2
E[N ]2 E[N 2 ]
So ultimately, one needs to prove that in the limit the second moment matches the first moment square. This would certainly be the case if the variables were independent. In the case of BRW, this is not so. However, we can create enough independence and not losing too much precision by dropping the increments at lower scales. In addition, as observed in [46], the matching of the moments is greatly simplified if one considers increments rather than the sum of increments. More precisely, since the leading of the maximum is linear in the scales, it is reasonable to expect that each scale contributes equally to the maximal value to leading order (since they have the same variance). It turns out this heuristic is correct and extend to the high points. With this in mind, we introduce a parameter K which divides the n scales coarser K levels. We define accordingly, for m = 1, . . . , K, the increments X Wm (v) = Yl (v) . m−1 m (1 + ε) E} , m = 1, . . . , K, K and the modified number of exceedances, en = N
K X Y v∈Vn m=2
1Em (v) .
en , then each Wm (v) for m ≥ 2 exceeds (1 + ε)K −1 nE. Note that if v is counted in N Moreover, it is easy to check using the Gaussian estimate (1) that |W1 (v)| is less than K −1 n with large probability. In particular, Xv (n) > (1 + ε)(1 − K −1 )En on the events, so that we can take K large enough depending on ε so that Xv (n) > En. We conclude that en ≤ Nn (En) , N hence it suffices to show
� P
�
en > 2n(1−ε) N
2
1− E2 c
��
→1.
18
L.-P. ARGUIN � � 2 −nε 1− E2
c . We have by the Gaussian estimate We apply the inequality (26) with δ = 2 (1) � � � � −1 2 2 2 (1 + o(1)) (1 − K )(1 + ε) E n n 1− E2 n en ] = 2 c √ ≥ 2 E[N exp − , 2σ 2 2π for n large enough. Thus � �� � � � 2 n(1−ε) 1− E2 e e e c P Nn > 2 ≥ P Nn > δE[Nn ]
It remains to show en ])2 (E[N → 1 as n → ∞. en )2 ] E[(N
(27)
The idea is to split the second moment according to the branching scale. More precisely, we have (28) K K K X \ X X \ 2 0 e E[(Nn ) ] = P( Em (v) ∩ Em (v )) + P( Em (v) ∩ Em (v 0 )) v,v 0 ∈Vn n v∧v 0 ≤ K
=
m=2
K X Y
r=2
2
P (Em (v)) +
v,v 0 ∈Vn m=2 n v∧v 0 ≤ K
K X r=2
v,v 0 ∈Vn (r−1)n 0, with S0 = 0. Let δ > 0. There is a constant C = C(σ, δ) such that for all B > 0, b ≤ B − δ and n ≥ 1 (30)
P [Xn ∈ (b, b + δ) and Xk ≤ B for 0 < k < n] ≤ C
(1 + B)(1 + B − b) . n3/2
Moreover, if δ < 1, (31)
P [Xn ∈ (0, δ) and Xk ≤ 1 for 0 < k < n] ≥
1 . Cn3/2
With this new tool in hand, we are ready to prove the subleading order.
20
L.-P. ARGUIN
Proof of Theorem 4. Upper bound: We want to show that for ε > 0 lim P (max Xv (n) ≥ mn (ε)) = 0 .
n→∞
v∈Vn
As mentioned previously, the idea is to first show that we can constrain the random walks to stay below a linear barrier. More precisely, we prove that for B = log2 n, (32)
lim P (∃v ∈ Vn : Xv (n) ≥ mn (ε), Xl (v) > cl + B for some l ≤ n) = 0 .
n→∞
The proof is by a Markov’s inequality at each scale. Indeed, we can bound the above by � � n n X X (cl + B)2 l = n exp(−Bc/σ 2 ) = o(1) , P (∃v : Xl (v) > cl + B) ≤ 2 exp − 2l 2σ l=1 l=1 where the first inequality is by the Gaussian estimate and the last by the choice of B = log2 n. To conclude the proof of the upper bound, consider the event E + (v) = {Xv (n) ≥ mn (ε), Xl (v) ≤ cl + B ∀l ≤ n} .
By (32), it follows that
P (max Xv (n) ≥ mn (ε)) = P ( v∈Vn
X
v∈Vn
1E + (v) ≥ 1) + o(1) .
Therefore, it remains to show that the first probability goes to 0. By Markov’s inequality, this is simply X P( 1E + (v) ≥ 1) ≤ 2n P (E + (v)) . v∈Vn
To prove that this goes to 0, it is useful to make a change of measure to make the end value mn (ε) typical. To this aim, consider the measure Q defined from P through the density dQ Y eλYe λ2 σ 2 λYe = , ϕ(λ) = log E[e ] = , ϕ(λ) dP e 2 e where the product is over all the edges in the binary tree. Note that by definition ϕ0 (λ) = EQ [Ye ] = λσ 2 . In particular, to make mn (ε) typical, we choose mn (ε) . σ2n Under this change of measure, we can write the probability as λ=
(33)
P (E + (v)) = e−(λmn (ε)−ϕ(λ)) EQ [e−λ(Xv (n)−mn (ε)) 1E + (v) ] ≤ e−
(mn (ε))2 2σ 2 n
Q(E + (v)) ,
where we use the choice of λ and the fact that Xv (n) − mn (ε) ≥ 0 on the event E + (v). Since (mn (ε))2 2 2n exp(− ) = O(n−εc/σ ) n3/2 , 2 2σ n the upper bound will be proved if 2
n3/2 Q(E + (v)) = o(nεc/σ ) .
EXTREMA OF LOG-CORRELATED RANDOM VARIABLES:
PRINCIPLES AND EXAMPLES 21
But this follows from the ballot theorem (Theorem 5) with B = (log n)2 , since (Yl (v) − mn (ε)/n, l ≤ n) under Q is a random walk of finite variance. Lower bound: As for the leading order, to get a matching lower bound, it is necessary to create independence by cutting off the increments at low scales. Of course, we cannot truncate as many scales. We choose r = log log n , and consider the truncated walks Xv (n) − Xv (r). We do not lose much by dropping these since, for ε > 0, (34) � P ∃v : Xv (n) < mn (−2ε), Xv (n) − Xr (v) ≥ mn−r (−ε) ≤ P (∃v : Xv (r) < −10cr) , where the inequality holds for n large enough depending on ε. By a union bound and the Gaussian estimate (1) (note that the variables are symmetric!), P (∃v : Xv (r) < −10cr) ≤ 2r exp(−100c2 r2 /(2σ 2 )) = 2−99r → 0 . In view of (34) and by redefining ε > 0, we reduced the proof to showing � (35) P ∃v : Xv (n) − Xr (v) ≥ mn−r (−ε) → 1, n → ∞. For this purpose, consider (36)
mn−r (−ε) µ= n−r
µ2 = log 2 − 2σ 2
�
3 c − 2ε 2 σ
Denote the truncated walk and its recentering by Xv (r, n) = Xv (n) − Xr (v) ,
�
log(n − r) + o(n−1 ) . n−r
X v (r, n) = Xv (n) − Xr (v) − µ(n − r) .
With this notation, the event of exceedance with the barrier B = 1 is � E − (v) = v ∈ Vn : X v (r, n) ∈ [0, δ], X v (l, n) ≤ 1 ∀l ≥ r + 1 , where δ > 0 is arbitrary. The relevant number of exceedances is X 1E − (v) . N − (v) = v∈Vn
By the Paley-Zygmund inequality, we have �2 − E[N (v)] P (N − (v) ≥ 1) ≥ . E[(N − (v))2 ] To prove (35), it remains to show that (37)
�2 E[(N − (v))2 ] = (1 − o(1)) E[N − (v)] .
The second moment can be can be split as a sum over v ∧ v 0 . We get X E[(N − (v))2 ] = P (E − (v) ∩ E − (v 0 )) (38) +
v,v 0 : v∧v 0 ≤r n X X
m=r+1 v,v 0 :v∧v 0 =m
P (E − (v) ∩ E − (v 0 )) .
22
L.-P. ARGUIN
For the first term, note that E − (v) is independent of E − (v 0 ) because v ∧ v 0 ≤ r so the walks share no increments. Thus, the first term is X �2 (39) P (E − (v) ∩ E − (v 0 )) = (1 − o(1)) E[N − (v)] v,v 0 : v∧v 0 ≤r
since there are 22n (1 − o(1)) pairs v, v 0 with v ∧ v 0 ≤ r. We show that the second term is �2 o(1) E[N − (v)] to conclude the proof. Observe that, by proceeding as (33) with the measure Q (for λ = µ/σ 2 ) and the Gaussian estimate (1), the expected number of exceedances satisfy E[N − (v)] ≥ C2n e−λδ e−
(40)
µ2 (n−r) 2σ 2
Q(E − (v))
c
≥ C2r e−λδ (n − r) σ2 ε (n − r)3/2 Q(E − (v)) c
≥ C2r (n − r) σ2 ε e−λδ
2
µ for some constant C > 0. Here we used the estimate on 2σ 2 in (36). The last inequality 0 is a consequence of the ballot theorem 5. For v ∧ v = m, we decompose the probability P (E − (v) ∩ E − (v 0 )) on the events {X v (r, m) ∈ (−q, −q + 1]} for q ≥ 0. Note that Xv (m) = Xv0 (m)! We thus get
P (E − (v) ∩ E − (v 0 )) ∞ X = P (E − (v) ∩ E − (v 0 ) ∩ {X v (m, n) ∈ (−q, −q + 1]}) ≤
q=0 ∞ X q=0
P X v (r, m) ∈ (−q, −q + 1], X v (r, l) ≤ 1 ∀l = r + 1, . . . , m
�
� ��2 × P X v (m, n) ≥ q − 1, X v (m, l) ≤ 1 + q ∀l = m + 1, . . . , n where we used the bound on Xv (m), and the square of the probabillity comes from the independence of increments after the branching scale m. We evaluate these two probabilities. Using the change of measure with λ = µ/σ 2 and the bounds on X v (m, n), the first one is smaller than � µ2 (n−r) eλq e− 2σ2 Q(X v (r, m) ∈ (−q, −q + 1], X v (r, l) ≤ 1 ∀l = r + 1, . . . , m . By the ballot theorem, this is smaller than eλq e−
µ2 (n−r) 2σ 2
q+1 . (m − r)3/2
An identical treatment of the square of the second probability yields that it is smaller than µ2 (m−r) q+1 e−2λq e− σ2 . (n − m)3
Putting all the above together, we finally obtained that n X
X
m=r+1
v,v 0 :v∧v 0 =m
−
−
0
P (E (v) ∩ E (v )) ≤
n X m=r+1
2
2n−m
2
µ ∞ e− 2σ2 (2n−m−r)) X (q + 1)2 e−λq , 3/2 3 (m − r) (n − m) q=0
EXTREMA OF LOG-CORRELATED RANDOM VARIABLES:
PRINCIPLES AND EXAMPLES 23
since there are at most 22n−m pairs with v ∧ v 0 = m. The last sum is finite. Moreover, using the estimate in (36), the first sum is smaller than 2ε
r
C2 (n − r)
c σ2
n X
3
m−r
(n − r) 2 (2− n−r ) . 3/2 (n − m)3 (m − r) m=r+1
It is not hard to show by an integral test that the series is bounded for any n. Thus n X X c (41) P (E − (v) ∩ E − (v 0 )) ≤ C2r (n − r)2ε σ2 . m=r+1 v,v 0 :v∧v 0 =m
Using (41), (40), and (39) in (38), we conclude that 1 1 + C2r e2λδ which goes to 0 by taking n → ∞ (r = log log n) than δ → 0. This proves the theorem. � P (N − (v) ≥ 1) ≥
4. Universality classes of log-correlated fields The heuristics developed in Section 3 from branching random walks turns out to be applicable to a wide class of stochastic processes. It is a research topic of current interest to extend these techniques to other non-Gaussian log-correlated models with the purpose of proving results similar to Conjecture 1. One interesting problem that we will not have time to allude to is the cover time of the discrete random walk on the twodimensional torus, which perhaps surprisingly, can be estimated using such methods. We refer the reader to [15, 29] for results on this question. We focus our attention here to two open problems: the large values of the Riemann zeta function and of the characteristic polynomials of random matrices. The behavior of the large values of these two models was conjectured by Fydorov, Hiary & Keating [39, 40] to mimic that of a Gaussian logcorrelated model. We shall explain here this connection in terms of branching random walks. 4.1. Maximum of the Riemann zeta function on an interval. Let s ∈ C. If Re s > 1/2, the Riemann zeta function is defined by (42)
ζ(s) =
∞ X Y 1 (1 − p−s )−1 . = s n n=1 p primes
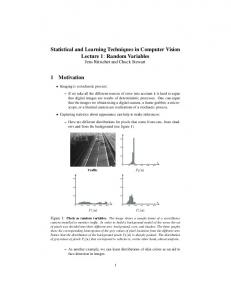
This definition can be analytically continued using the functional equation �π � ζ(s) = χ(s)ζ(1 − s) , χ(s) = 2s π s−1 sin s Γ(1 − s) , 2 to the whole complex plane with a pole at s = 1. The distribution of the primes is famously linked to information on the zeros of the function. There are trivial zeros (coming from the functional equation) at the negative even integers. The Riemann Hypothesis states that all other zeros lie on the critical line Re s = 1/2 suggested by the symmetry of the functional equation. See Figure 5 for the plot of the modulus of ζ on the critical line. We shall be interested instead in the large values of the modulus of ζ in an interval. In other words, what can be said about the local maxima of zeta ? The global behavior is much more intricate, see the Lindel¨of’s hypothesis.
24
L.-P. ARGUIN 2.0
1.5
1.0
0.5
0
100
200
300
400
500
Figure 5. The function log |ζ(s)| for s = 1/2 + it for t ∈ [0, 500]. Fyodorov, Hiary and & Keating based on numerics and connection with random matrices made an astonishing prediction for the local maximum of ζ on an interval, say [0, 1], of the critical line. Conjecture 2 (Fyodorov–Hiary–Keating [39, 40]). For τ sampled uniformly from [0, T ], (43)
maxh∈[0,1] log |ζ(1/2 + i(τ + h))| − log log T 3 = − in probability. T →∞ log log log T 4 lim
In fact, their conjecture is even more precise, suggesting an explicit distribution for the fluctuation. Roughly speaking, the above means that the maximum in a typical interval of the critical line is 3 max log |ζ(1/2 + i(τ + h))| ≈ log log T − log log log T + O(1) . h∈[0,1] 4 The connection with Conjecture 1 is made by taking log T = 2n and σ 2 = log2 2 . Observe that it is a perfect match! As we will see, the relation with log-correlated models goes beyond the numerological curiosity. It also proposes a starting point to prove the conjecture. In fact, the conjecture can be proved to the subleading order for a random model of zeta, cf. Theorem 6. Suppose first the Euler product of the Riemann zeta function extended to the critical line. By expanding the logarithm, we would have (44) ∞ X X X Re p−it 1X 1 −(1/2+it) log |ζ(1/2+it)| = −Re log(1−p )= Re k(1/2+it) = +O(1) . 1/2 k p p p p p k=1 This expansion can be made partially rigorous if the sum over primes is cut off at T , see Proposition 1 of [44] based on [56]. Now replace t by a random τ + h where h ∈ [0, 1] and τ is sampled uniformly from [0, T ]. The randomness entirely comes from the random variables (p−iτ , p primes). It is an easy exercise by moment computations to verify that, since the values of log p are linearly independent for distinct primes, the process (p−iτ , p primes) converges in the sense of finite-dimensional distribution as T → ∞ to independent random variables distributed uniformly on the unit circle. This suggests the following model for zeta: let (Up , p primes) be IID uniform random variables on the unit
EXTREMA OF LOG-CORRELATED RANDOM VARIABLES:
PRINCIPLES AND EXAMPLES 25
circle index by the primes and take X Re(Up p−ih )
(45)
p≤T
p1/2
! , h ∈ [0, 1]
.
For this model, we can prove the conjecture up to subleading order. Theorem 6 ([7]). Let (Up , p primes) be independent random variables distributed uniformly on the unit circle. Then P −ih ) pp maxh∈[0,1] p≤T Re(Up1/2 − log log T 3 = − in probability. (46) lim T →∞ log log log T 4 The proof is based on finding an approximate branching random walk embedded in zeta. What is this approximate branching random walk ? In particular, what is the mutliscale decomposition and does it exhibit the usual self-similarity and dichotomy of P p−it scales of log-correlated models ? It is tempting to think of the decomposition p Rep1/2 as the right multiscale decomposition since the variables Re p−it decorrelate in the limit. However, for the scales to be self-similar, it is necessary to consider a coarse-graining of the sum. For the sake of clarity, we take log T = 2n . For the random model (45), the increment at scale l for l = 1, . . . , n is X Re(Up p−ih ) (47) Yh (l) = , h ∈ [0, 1]. p1/2 l−1 l 2