AIAA-2001-0044
Extreme Load Estimation for Wind Turbines: Issues and Opportunities for Improved Practice Paul S Veers Wind Energy Technology Department Sandia National Laboratories Albuquerque, NM 87111-0708
[email protected] 505.844.5522 Sandy Butterfield National Wind Technology Center National Renewable Energy Laboratory Golden, CO 80401-3393
[email protected] 303.384.6902 ABSTRACT Current design load estimation procedures for wind turbines often do not accurately treat the statistical nature of loads. Current practice for wind turbine load analysis is reviewed. The authors’ opinions on the shortcomings of these practices are discussed. Experience gained from current research on statistical load extrapolation methods is reviewed. Statistical modeling techniques are presented. Open questions on current techniques are summarized and critical issues that need to be resolved for an accurate statistical load extrapolation method are discussed. INTRODUCTION AND BACKGROUND Stochastic Environment Wind turbines must be designed to operate in a very stochastic environment for at least 20 years according to International Electrotechnical Commission (IEC) standards. In addition to the cyclic nature of loads induced by their own inertial effects, loads result from spatial and temporal changes in wind speed, direction, shear and vorticity. This has challenged designers for many years. Initially designers felt this level of detail in wind modeling was impossible and unnecessary. Very simple techniques were used in the late 70s and early 80s. These techniques worked when the designs were very simple and conservatively designed or the wind conditions were benign. As wind turbines became larger it was too expensive to use large safety margins. They were also being installed in very turbulent sites. 1
This paper is declared a work of the U.S. Government and is not subject to copyright protection in the United States. Sandia is a multiprogram laboratory operated by Sandia Corporation, a Lockheed Martin company, for the U.S. Department of Energy under contract DE-AC04-94AL85000.
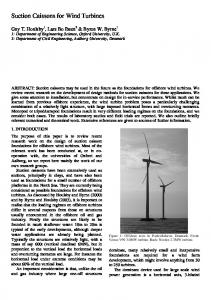
Failures caused by inaccurate estimation of design loads mandated more accurate prediction techniques which did account for more detail in the inflow. Detailed structural dynamic models were developed and became the workhorses for the wind industry by the mid 1990s. Included in these computer codes were turbulence models, which simulated stochastic inflow fields, aerodynamic models, which predicted aerodynamic loads from the turbulent inflow, and control algorithms, which commanded pitch, yaw, and braking actions. The aerodynamic loads were applied to the structural dynamic model which was then run in a time marching fashion. Figure 1 shows a flow chart of the general analysis models. With this approach designers finally had tools which could simulate all the important operational features of the entire wind turbine, even the control system. One can argue about the accuracy of the various models that make this overall system of models, but even in their current state they provide a far more accurate and power tool than ever before. Armed with these new tools the designer must decide how to use them. He/she is now able to simulate almost any wind and operational condition. The designer is still faced with estimating the fatigue life and peak loads over 20 years. This implies running 20 years of computer simulations which, at the present time, only run near real time. Obviously this is not practical. How should a subset of simulations be used to extrapolate to a representative 20 year spectrum of loads?
Turbulence
Aerodynamic
Structural Dynamic
statistics they do not estimate the peak load, which will occur over the operating life of the machine. There are not enough data to make reliable estimates.
Load Processing
Controls
The fatigue simulations capture the essential aerodynamics, structural dynamics and control features but lack the statistical depth needed to establish statistical significance for the lifetime load predictions. Accurate estimation of uncertainties, statistical significance and confidence in extreme load estimation is needed to build reliable machines.
Figure 1. Typical Turbine Model Flow Chart Typical Load Prediction Process To address the problem of extrapolation to 20 years of fatigue loads and extreme loads designers typically use the models to simulate loading conditions over a range of operational and extreme wind speeds. Fault states are also simulated. Generally only one ten-minute simulation is run for each condition and state. In the event of extreme conditions a short simulation is run using a discrete wind gust model.
Even if statistical confidence could be established the designer has to choose a set of conditions that will cover the range of sites where the machine is likely to be installed. Standards have been developed to assure consistency of design-load conditions across the industry. Design Requirements (IEC Standard)
Wind speed probability density functions are used to estimate the duration of time that each wind speed condition will occur over the life of the turbine (low frequency variations in the wind). Turbulence models are used to represent the short-term variations (high frequency end of the spectrum). A ten-minute load simulation is assumed to represent the dynamic response to the spatial and temporal character of the wind for a mean wind speed bin. Ten-minute simulations are run for a range of mean winds. If it were practical simulations would be run for 20 years of turbine life using an accurate probability density function to represent the low frequency wind variability and turbulence models with a characteristic distribution of turbulence intensity to represent the high frequency variability. In practice the results of one ten minute simulation for each wind speed bin are cycle counted and the number of cycles are multiplied by the 20 year duration. These discretized cycle matrices are summed over the full range of wind speeds for a complete fatigue load distribution.
The International Electrotechnical Commission (IEC) standards formalized design requirements. While they do not specifically prescribe the design methods described above they are based on the assumption that designers will use these methods. Their goal is to provide a consistent set of models and parameters for designing machines to an implicit level of robustness to achieve high reliability at many economically attractive sites. If the design methods are incorrect turbines can be over designed or under designed with respect to site requirements. Turbulence Simulations IEC 61400-11 specifies design classes with associated annual average wind speeds, turbulence intensities and extreme wind speeds (Table 1). Turbulence models are also specified. With these parameters, models, and other environmental conditions, analysts are presumed to have the essential “external conditions” needed to establish their design conditions.
Extreme loads are estimated by simulating extreme inflow conditions. Both a 50-year extreme ten minute average wind speed with turbulence and an extreme discrete wind speed model are used. The highest load from among all conditions is used for design and certification purposes. When the highest load comes from a turbulent wind simulation, it is sometimes used without further statistical extrapolation.
The IEC standards do specify target levels of probability and confidence for load predictions but do not specify how many turbulence simulations are needed to establish these levels. They do not provide any incentive to increase confidence in the load predictions. The methods for achieving specified levels of confidence are not clear. Minimum safety factors are codified to account for uncertainty in the loadprediction process and material properties but they are unproven and they are not intended to account for statistical uncertainty implied by finite duration data samples.
This method is flawed in at least two ways. First, it does not account for rare events, which will be generated as longer turbulence simulations are run, essentially filling in the tails of the stochastic inflow distributions for each wind speed bin. Second, because the simulations do not capture accurate extreme
2
WTGS Class
I
II
III
IV
V ref
(m/s)
50
42,5
37,5
30
V ave
(m/s)
10
8,5
7,5
6
likely to be best determined from exhaustive simulations of the turbulent inflow and subsequent statistical analysis of the turbine response. In that event, the design community will need to base load estimates on a broad range of turbulent inflow conditions. It is also doubtful that there can be a single wind condition (combination of mean and turbulence level) that will be a worst case for all types of turbines.
S
Values to be
I 15 (-)
A
a (-) I 15 (-)
B
a (-)
0,18
0,18
0,18
0,18
2
2
2
2
0,16
0,16
0,16
0,16
3
3
3
3
specified
Statistically robust methods of load estimation and fatigue life extrapolation would allow designers to intelligently match their designs to the stochastic design environment. They would enable them to quantify the confidence of load predictions and increase them through more extensive simulations. They would allow extreme load extrapolations.
by the designer
where: • • • • •
the values apply at hub height, A designates the category for higher turbulence characteristics, B designates the category for lower turbulence characteristics, I 15 is the characteristic value of the turbulence intensity at 15 m/s, a is the turbulence slope parameter
As the wind industry becomes more sophisticated, they will be able to apply more accurate load estimation techniques to reduce unnecessary conservatism. Wind energy may soon be competitive with fossil fuels if it can reduce its cost by 20%–30%. These reductions may be possible simply through more accurate design methods and consequent reductions in safety factors.
Table 1 - Basic parameters for WTGS classes
Goal Discrete Models
The goal is to develop a set of design methods that incorporates the stochastic nature of the design environment over the intended life of the machine. These methods must be compatible with existing structural dynamic simulation tools. They must be practical, verifiable and accurate. They must be internally consistent from fatigue load estimation to extreme load estimation.
IEC offers discrete models in an attempt to acknowledge that the turbulence simulations do not capture the extreme load conditions accurately. These models include a 50 year extreme gust profile, shear, direction change, and several other wind conditions. Time dependent magnitudes are specified so that the transient response of the wind turbine can be simulated. These models are design class dependent.
Other industries have already embraced statistical design methods that are compatible with the stochastic nature of their design environment. Offshore structures are subjected to stochastic loads. Earthquake loads are stochastic. Designers in these industries use statistical design methods to achieve cost effective designs. The wind energy industry needs similar tools.
It is not clear that these models accurately represent the tails of the distribution. Confidence in the models is derived from experience; their use has resulted in machines that demonstrate high initial reliability. As they are currently defined they are not related to the implied extremes of stochastic turbulence distribution and therefore could represent an inconsistency between the discrete, event-based and turbulence-based models.
RECENT EXPERIENCE AND DIRECTION There has been some recent progress in examining the way the standard design loads are derived and what approaches might be better. Madsen2 has begun the reexamination of the extreme loads with a look at how the IEC loads compare with statistical extrapolations of parked and operating loads. It is clear that prescribed extreme events do not always result in the highest loads. Ronold has published studies of both extreme load3 and fatigue4,5 reliability, proposing new load modeling approaches that lead to the ability to extract reliabilities (probabilities of failure) from the design
Need for improved load estimation methods The design community has grown to mistrust the discrete models and rely heavily on turbulence simulations for establishing design loads. Improved modeling power has given designers the basic tools needed to more accurately represent the stochastic nature of their loads. But there is little guidance on how to use these tools to achieve the full range of life time fatigue loads. Given the current state of knowledge and modeling power, the design loads are
3
Parked loads are the simplest to analyze because the highest loads have usually been assumed to occur in the highest winds. Madsen, et al.2 have thrown some doubt on that assumption by showing the large variability in extreme loads at a given wind condition. Parked loads also seem to be the easiest to fit to statistical models, being no different than the response of any stationary structure to turbulent winds. The extreme wind loading case (e.g., 50 year maximum 10 minute average wind speed) can be specified. Once specified, the mean extreme load (average of all possible realizations of this 50 year maximum condition) can be estimated from multiple simulations. It is of course assumed that this load case will never be derived from measurements because the 50 year extreme will never be measured within the duration of a typical prototype evaluation program. The parked case is therefore a matter of specifying the controlling parameters of the worst inflow condition and estimating the mean turbine response to that stochastic inflow. It is therefore almost exactly analogous to the case of offshore structures loaded by storms, an application for which the design criteria are already quite advanced.13
data. Methods for statistical modeling of the loads have also been explored by Winterstein6,7 Ad hoc cases of statistical models populated the European Wind Energy Conference in recent years.8-12 All of this activity highlights the need to apply statistical methods to wind turbine design loads in ways that improve the design process. The level of uncertainty in each application should drive the design loads. Summary of what we think we have learned Deterministic load cases such as those specified in the Design Load Cases (DLCs) in the IEC Safety Standard1 will always provide useful checks on a design. Table 2 lists the various load cases. Load cases are a combination of external conditions and operating conditions. Many of the critical DLCs include discrete external conditions (e.g. the 50 year extreme operating gust EOG50) rather than normal turbulence models (NTM). Deterministic evaluations have utility in their own right. They need to be used in addition to full-field turbulence models. They are much more important than being a mere convenience. They are also likely to continue for a long time as a primary tool for design evaluation because there is a difference between design evaluation and the process of design itself. Deterministic calculations will remain important in providing spot checks, which a design evaluator can make independently. They may, however, assume a lesser importance in driving future turbine designs as statistical extrapolation methods become more widely used.
Loads during operation raise an interesting difficulty. As wind speed decreases, most system loads will also decrease from a maximum that might occur at either the highest operating wind speed or around rated wind speed. As wind speed decreases the amount of time at the wind speed increases. The more time spent at a particular operating condition, the greater the opportunity to experience higher response levels, farther out in the tails of the distribution. Therefore, one can not assume that the highest loads will be generated by the highest winds. Instead, it is necessary to combine the responses at all wind speeds into a single long-term distribution of load extremes. Only from this combined distribution can the highest load over the entire design lifetime be extracted.
It is simply not possible to construct a set of load cases that will be equally applicable to all wind turbine architectures and control implementations. Thus, while the deterministic load cases may produce an onerous condition for one turbine, they may be relatively benign for another. The ability to evaluate the turbine load response with respect to realistic wind inflow conditions is already well established. It is also not clear that a set of deterministic load cases can be constructed to adequately represent every possible inflow event for all potential turbine sites. Therefore, it is highly likely that simulated response to turbulent input winds will be used to calculate response and statistical methods will be used to translate the shortterm response time series into long-term design loads.
The extreme operating load therefore begins to resemble the fatigue load case where the long-term distribution of fatigue load cycles is required to calculate the total damage over the design lifetime. Although the load quantities are different (peak response for extreme load estimation and rainflow ranges for fatigue) the statistical modeling problem looks similar. In both cases, it is necessary to determine a short-term response distribution conditional on the input wind conditions (currently speed and turbulence intensity). Then the short-term response is integrated over all wind speeds to generate the longterm distribution using the “total probability theorem.”
There are two distinctly different aspects of design analysis that need to be treated separately, either of which can provide the controlling design loads for a particular component within a particular system. The parked extreme wind loads must be treated differently from the operating loads
4
Design situation
DLC
Wind condition 1)
Other conditions
Type of analysis
Partial safety factors
1.1
NTM
V hub = V r or V out
U
N
1.2
NTM
V in < V hub < V out
F
*
1.3
ECD
V hub = V r
U
N
1.4
NWP
V hub = V r or V ou t
External electrical fault
U
N
1.5
EOG 1
V hub = V r or V out
Loss of electrical connection
U
N
1.6
EOG 50
V hub = V r or V out
U
N
1.7
EWS
V hub = V r or V out
U
N
1.8
EDC 50
V hub = V r or V out
U
N
1.9
ECG
V hub = V r
U
N
2.1
NWP
V hub = V r or V out
Control system fault
U
N
2.2
NWP
V hub = V r or V out
Protection system or preceding internal electrical fault
U
A
2.3
NTM
V in < V hub < V out
Control or protection system fault
F
*
3.1
NWP
V in < V hub < V out
F
*
3.2
EOG 1
V hub = V in , V r or V out
U
N
3.3
EDC 1
V hub = V in , V r or V out
U
N
4.1
NWP
V in < V hub < V out
F
*
4.2
EOG 1
V hub = V r or V out
U
N
5) Emergency shut down
5.1
NWP
V hub = V r or V out
U
N
6) Parked (standing still or idling)
6.1
EWM
V hub = V e 50
U
N
6.2
NTM
V hub < 0.7 V ref
F
*
7.1
EWM
V hub = V e 1
U
A
1) Power production
2) Power production plus occurrence of fault
3) Start up
4) Normal shut down
7) Parked and fault conditions
Possible loss of electrical power network
1) If no cut-out wind speed V out is defined , the value of V ref should be used.
Table 2 IEC Design Load Cases (Ref. 1)
5
parametric based on its need to define the parameters of distribution functions.
The practice of defining fatigue loads empirically, with histograms of the number of cycles in each load amplitude bin, has been used for this purpose.14.15 The resulting long-term distribution is derived by a summation over all the (usually discrete) wind speed bins.
N ( L j ) long − term = ∑ N i ( L j ) short − term P(Vi ) Vi
Calculating long-term distributions is similar to Eq. (1), except that there is no need to discretize the calculation. The resulting continuous long-term probability distribution function, F(L)long-term, is derived from the continuous short term distributions, whose parameters are defined as functions of wind speed, as follows.
(1)
F ( L) long − term = ∫ F ( L | V ) short - term f (V )dV
Ni(Lj)short-term is the number of cycles per fixed time period of load amplitude Lj at average wind speed Vi, P(Vi) is the probability that the winds are in the Vi wind speed bin and N(Lj)long-term is the resulting long term number of cycles at load amplitude Lj. P(Vi) is found by integrating the probability density function of wind speed, f(V), over the width of the Vi bin.
(2)
V
Equation (2) in various forms appears throughout the papers in the Design Loads Estimation special session of the 2001 ASME Wind Energy Symposium. It is the basis for load estimates in the offshore oil business,13 for extreme loads on wind turbines16,17 and for fatigue loads.18 In a tower clearance study, Laino19 highlights the value of statistical analysis while illustrating the difficulty of doing so without the use of Eq. 2. It is foundational to a systematic way of describing loads that depend on a distribution of environmental conditions such as wind speeds or wave heights. For extremes, the distributions are of extreme values while for fatigue, the distributions are of rainflow counted amplitudes. Equation 2 applies to both. Of course, Eq. 2 does not explicitly account for the frequency of occurrence of the loads in question. The number of load events is derived from the time of exposure and the frequency and will determine the probability level at which the design load is evaluated.
This empirical approach has some definite weaknesses. The first is difficulty in determining the high-amplitude tail of the load distribution. The fatigue damage in materials typically used in wind turbine blades have a high fatigue exponent that leads to fatigue damage governed by the high-amplitude tail. The empirical approach requires an enormous amount of data to define the tail of each short-term distribution. The second difficulty is in translating the data from one site into a load distribution at another site with different inflow characteristics. Finally, there is no systematic way to make use of increased information, i.e., better descriptions of the loads based on a larger data base. Ideally, more data should lead to higher confidence in the loads resulting in a reduced design margin
Wind speed alone is not capable of describing the loading response. Turbulence is also responsible for determining the response intensity of a wind turbine rotor. Since the two are related, it is difficult to say exactly which is more important, but is safe to say that both are crucial. Existing approaches incorporate turbulence by prescribing a functional relationship between wind speed and turbulence standard deviation, which permits the continued use of Eq. 2. By specifying V, the related turbulence level, T, is automatically defined. This often results in the need to define the turbine response at turbulence levels that may never have been measured.20
Statistical modeling can improve design load estimates for both fatigue and ultimate load applications. First, a statistical model can be used to extrapolate from the existing data to more rare, higher-amplitude events (not perfectly, but with calculable uncertainty). Second, the models can be used to parameterize the response with respect to wind conditions so loads in other wind conditions can be estimated. And finally, the statistical uncertainty in the models can be used as a basis of improved design load standards, by accounting for the uncertainty based on the amount of loads data used to estimate the extremes and fatigue load spectra.
Alternatively, the response parameters can be mapped to both wind speed and turbulence level through some sort of regression. Equation (2) is also transformed into a double integral over both environmental inputs.
Statistical Modeling Statistical modeling uses probability distributions to describe the loads data at each set of short-term wind input conditions. The distribution functions are defined in terms of parameters which in turn are derived from certain statistics of the data, usually mean, variance, and perhaps other higher statistical moments (i.e., skewness and kurtosis).2,3,5 This approach can be called
F ( L ) long − term =
∫∫ F ( L | V , T ) short- term f (V , T )dVdT
V ,T
6
(3)
Things we do not know
30
There are a number of details on the statistical modeling and analysis that need to be resolved to demonstrate that statistical models can be used constructively to produce load estimates at prescribed confidence levels. Some of the papers in this session go a long way to improving the state-of-the-art in this area.
25 B1_Moop 20
99
92
85
78
71
64
57
50
43
36
29
22
8
15
15 1
Max load response
Blade out-of-plane bending moment (kNm)
Simulation no.
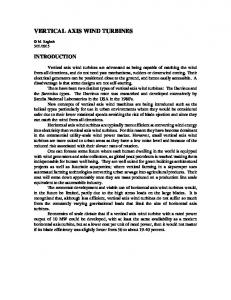
Figure 2 illustrates how the maximum value of each ten minute simulation will change by only changing the seed for the turbulence model. Obviously a single simulation does not form a good basis for extrapolation to a 20 year life. Madsen et al.2 showed that a linear structure (a non-operating turbine) obeys an extreme value type 1 model, and shows that it works pretty well even for the non-linear system of an operating turbine (Figure 3).
35 30 25
YB_Fdw
20
99
92
85
78
71
64
57
50
43
36
29
22
15
8
15 1
Max load response
Load extremes (10 min runs)
Simulation no.
On the other hand recent attempts to apply full response models to extreme value estimation for operating loads have not worked well.2,6,21 These models attempt to increase the statistical certainty by using more data (all the time series instead of just the local extremes) to extrapolate to the long-term extremes. It turns out that the cyclic loading due to gravity and wind shear makes it difficult to apply a statistical model. It is better to use the extremes of the loads to predict ultimate loads. Exactly which extremes have not yet been resolved. Candidates include the maximum load in ten minutes, maximum for some other specified time period, maxima between mean-level crossings, maxima between some higher-level crossings, and maximum in each revolution. In the case of fatigue loads, rainflow counted cycle amplitudes are uniformly used. However, this choice too may be questioned if it brings unnecessary difficulties into design loads estimation without demonstrable added value.
35 30 25
YB_Mpitch
20
97
89
81
73
65
57
49
41
33
25
17
9
15 1
Max load response
Rotor pitching moment (kNm)
Simulation no.
Figure 2 Variability of Extreme Loads from 100 Independent Ten Minute Simulations. Maximum values of out-of-plane blade bending moment - operation at 14 m/s 100 10-min timeseries
1,00
Quantile
0,80 0,60
B1_moop
0,40
EV1
We do not yet know what exact choice of statistical parameters (moments, parameters of probability distribution functions, etc.) should be used to define the turbine response as a function of input conditions. Although there are slight advantages to some choices over others, the chosen parameters are not likely to be of central importance. However, good choices should result in minimal bias and reduced uncertainty. It is likely that the best parameters will be independent of probability distribution type and statistically independent. Central moments are front runners at this time.5,6 However, any response quantities that can be used to derive extreme loads or define fatigue-load distributions are candidates for statistical modeling.
0,20 0,00 3,25
3,50
3,75
4,00
4,25
4,50
4,75
5,00
Bending moment in kNm
Figure 3 Extreme Value Model Fit to Maximum Load Simulations While it is known that statistical modeling, parametric loads definitions and explicit inclusion of turbulence in the loads definitions offer significant advantages, there are still several unknowns that need to be resolved.
Regression over wind speed and turbulence level will most likely be required to create the map between input conditions and turbine response. The exact nature of
7
design load with additional data (assuming that the additional data does not reveal a load that had been underestimated due to the smaller data set, which for a 95% confidence level should only occur once every 20 tries). The safety factors could then cover the nonstatistical uncertainty relating to the host of factors influencing design loads, ranging from numerical model (or measurement) error to various environmental unknowns.
the regression will likely have an influence on the results if particularly poor choices are made. However, it is likely that any relatively good regression model, that is any model that fits the data well, should produce equivalent results. Lastly, the turbulent inflow description is likely to be very important in specifying the loads both for fatigue and extremes. There is growing consensus that the current approach in the standards of using average wind speed and a single (safe) value of turbulence intensity is inadequate. We need to at the very least account for the variability in turbulence levels or we are likely to miss the extreme events.
Because current standards are based on past experience and industry consensus rather than objective, risk-based analysis, it may be dangerous to remove conservatism from one area without also checking elsewhere. One conservatism may be covering for an unknown lack of conservatism elsewhere in the design process. In general, the current standards give a load calculation “recipe” that results in some specific reliability level. If these current reliability levels are deemed adequate on average (over various cases), one cannot reduce conservatism in turbulence specification without adjusting the recipe to compensate elsewhere; e.g., through use of a higher load factor. Note that a more statistically based alternative procedure may result in more uniform reliability across a range of machine types and site characteristics. An important unknown is what probability of failure is currently achieved through the experience-based design rules. Calibration studies (e.g., Ronold, et al.3-5) should be done to estimate the implicit safety level produced by current standards.
There seems to be fair agreement that the use of the raw 10-minute turbulence intensity to describe the turbulence is also inadequate, since it can not possibly capture the nature of the inflow important to wind turbine response (including frequency content, spatial variability, lateral and vertical wind components, etc.). The MOUNTURB program22 has identified the alongwind turbulence standard deviation as the most important factor in predicting turbine response, but there are a host of other factors that also play a role. These factors include the cross-wind and vertical wind speed standard deviations, length scale, coherence decay factor, and average shear. Recent work by Kelley23 has shown the importance of the mean shearing stress and atmospheric stability in turbine response. Filtered turbulence standard deviation that focuses on high frequency turbulence content has also shown some promise.24 Additional experiments and associated research need to be done to determine how to describe the inflow to best correlate to both extreme and fatigue loads on with turbine structures.
A very important issue for further research is the way the standards describe the turbulence of particular sites. It is quite clear that the raw 10-minute turbulence intensity has no hope of being an adequate descriptor of the site inflow characteristics. The required research will need to include detailed measurements of both the inflow field and turbine response. The data must be analyzed to determine the inflow statistics that govern the load response statistics. Site characterization work will then have to include summaries of the critical statistics. It may be an additional burden, but could have a significant payoff in reduced cost of energy from particular sites.
CRITICAL ISSUES FOR FUTURE WORK Perhaps the most crucial issue is how the characteristic values and partial safety factors will be defined to adequately cover the uncertainties while allowing the diligent designer to lower margins as far as possible by applying better and better load estimates. (Similarly, resistance estimates based on improved or additional information should also be rewarded with smaller design margins.) The design standards need to have a structure capable of using the statistical analysis of the loads data to generate associated design margins.
Site-specific design becomes more attractive as the sophistication of the industry increases to the point where individual components can be reinforced to account for particularly intense site-driven loadings. Alternatively, less expensive components could be substituted in particularly benign locales. There are limitations to site specific design. There are two, sometimes conflicting, purposes of the standard: the first is to provide minimum standards of practice which specify the necessary elements to consider in design and the second is to provide a set of external condition
There is currently no value incorporated in the standards for expending the effort to get additional simulations or field measurements. In some cases it is just the reverse.19 Perhaps the characteristic load could be tied to a specified confidence level, and this confidence level determined from the statistical analysis of the loads. Then it should be possible to reduce the
8
parameters which lead to turbines of consistent robustness in comparable applications. The second purpose is not served by having only site-specific designs. The IEC standard is more of a product standard than a code of practice although there are elements of both in it. As a product standard, it is entirely appropriate to have a set of arbitrary design conditions, which must be used. The broad site classes used in current standards may provide significant value as a product standard. Thus they aid in reducing cost through increased manufacturing volume that comes from standard products. However, it is worth further investigation to determine the effect of standard class definitions on wind turbine cost.
3.
4.
5.
SUMMARY 6.
The process of estimating design loads can be substantially improved with the use of statistical models. Standard definitions of characteristic loads and associated partial safety factors should reflect the levels of uncertainty calculated using the statistical models. The details of the models may be less important than the construction of the safety standard. The characteristic loads should be estimated by 1) finding a good probability distribution model for the short-term response at given input conditions, 2) defining the relationship between controlling parameters of the short term distributions and the input conditions, 3) integrating over the input distributions to get long-term distributions, 4) quantifying the uncertainty in the estimate of the long-term distribution, and 5) applying the uncertainty to determine the loads at a specified confidence level. Perhaps the details of each step may be left to the individual application. Although this provides a good first step, the bigger issues are likely to lie in the less quantifiable area of improved partial safety factors. As odd as it may sound, it is not possible to improve the safety factors without basing them on a firm foundation of statistical uncertainty analysis. Otherwise the safety factors themselves will need to provide the largest margins required to account for the worst possible job of loads estimation. We can do better than that.
7.
8.
9.
10.
11.
12.
REFERENCES 1.
2.
IEC/TC88, 61400-1 Wind Turbine Generator Systems – Part 1: Safety Requirements, International Electrotechnical Commission (IEC), Geneva, Switzerland, 1998. Madsen, P. H., Pierce, K. and Buhl, M., “Predicting Ultimate Loads for Wind Turbine Design,” A collection of the 1999 ASME Wind Energy Symp., at the AIAA Aerospace Sciences
13.
14.
9
Mtg., Reno, Nevada, AIAA-99-0069, January 1999, pp. 355-364. Ronold, K. O. and Larsen, G. C., , “Reliabilitybased design of wind-turbine rotor blades against failure in ultimate loading,” Elsevier, Engineering. Structures 22, 2000, pp. 565-574. Ronold, K. O., Wedel-Heinen, J., and Christensen, C. J., “Calibration of Partial Safety Factors for Design of Wind-Turbine Rotors Blades Against Fatigue in Flapwise Bending,” 1996 European Union Wind Energy Conf., Goteborg, Sweden, 2024 May 1996. Ronold, K. O., Wedel-Heinen, J. and Christensen, C. J., “Reliability-based fatigue design of windturbine rotor blades,” Elsevier, Engineering. Structures 21, 1999, pp. 1101-1114. Winterstein, S. R. and Kashef, T., “Moment-Based Load and Response Models with Wind Engineering Applications,” A collection of the 1999 ASME Wind Energy Symp., at the AIAA Aerospace Sciences Mtg., Reno, Nevada, AIAA99-0068, January 1999, pp. 346-354. Veers, P. S. and Winterstein, S. R., “Application of Measured Loads to Wind Turbine Fatigue and Reliability Analysis,” Journal of Solar Energy Engineering, Trans. of the ASME, Vol. 120, No. 4, November 1998. Cheng, P. W., Probabilistic Approach of Extreme Loading for Offshore Wind Energy Converters,” 1999 European Wind Energy Conf., Nice, France, 1-5 March 1999, pp. 228-231. Petersen, S. M., Larsen, G. C., Antoniou, I., Lind, S. O., and Courtney, M, “Experimental Investigation of Ultimate Loads,” 1999 European Wind Energy Conf., Nice, France, 1-5 March 1999, pp. 199-202. Andrea, A. Argyriadis, K., and Follrichs, U., New IEC 61400-1 and Site Conditions in Reality,” 1999 European Wind Energy Conf., Nice, France, 1-5 March 1999, pp. 593-596. Enevoldsen, P., Stiesdal, H., and Vinther, S. “How Do We Measure the Real Loads on Wind turbines?,” 1999 European Wind Energy Conf., Nice, France, 1-5 March 1999, pp. 620-623. Ronold, K. O. and Larsen, G. C., “Variability of Extreme Flap Loads During Turbine Operation,” 1999 European Wind Energy Conf., Nice, France, 1-5 March 1999, pp. 224-227. Haver, S., “Application of Stochastic Methods in Structural Design: The Offshore Experience,” A collection of the 2001 ASME Wind Energy Symp., at the AIAA Aerospace Sciences Mtg., Reno, Nevada, AIAA-2001-0043, January 2001. McCoy, T. J., Malcolm, D. J., and Griffin, Dayton, A., “An Approach to the Development of Turbine Loads in Accordance with IEC 1400-1 and ISO
15.
16.
17.
18.
19.
20.
21.
22.
23.
24. Kashef, T. and Winterstein, S. R., “Relating Turbulence to Wind Turbine Blade Loads: Parametric Study with Multiple Regression Analysis,” A collection of the 1998 ASME Wind Energy Symp., at the AIAA Aerospace Sciences Mtg., Reno, Nevada, AIAA-2001-0046, January 1998, pp. 273-281.
2394,” A collection of the 1999 ASME Wind Energy Symp., at the AIAA Aerospace Sciences Mtg., Reno, Nevada, AIAA-99-0020, January 1999, pp. 1-9. Antoniou, I. and Petersen, S. M., “Wind Turbine Test: Structural Loads ELKRAFT 1MW (Stall Regulated Operation),” Risø-I-865(EN), Risø National Laboratory, Roskilde, Denmark, December, 1995. Cheng, P. W. and Bierbooms, W., “Extreme Gust Loading for Wind Turbines During Operation,” A collection of the 2001 ASME Wind Energy Symp., at the AIAA Aerospace Sciences Mtg., Reno, Nevada, AIAA-2001-0045, January 2001. Fitzwater, L. M. and Winterstein, S. R., “Predicting Design Wind Turbine Loads from Limited Data: Comparing Random Process and Random Peak Models,” A collection of the 2001 ASME Wind Energy Symp., at the AIAA Aerospace Sciences Mtg., Reno, Nevada, AIAA-2001-0046, January 2001. Manuel, L., Veers, P. S., and Winterstein, S. R., “Parametric Models for Estimating Wind Turbine Fatigue Loads for Design,” A collection of the 2001 ASME Wind Energy Symp., at the AIAA Aerospace Sciences Mtg., Reno, Nevada, AIAA-2001-0047, January 2001. Laino, D., “Statistical Analysis of Wind Turbine Rotor Tower Clearance,” A collection of the 2001 ASME Wind Energy Symp., at the AIAA Aerospace Sciences Mtg., Reno, Nevada, AIAA-2001-0046, January 2001. IEC/TC88, Draft IEC 61400-13 TS, Ed. 1: Wind turbine generator systems – Part 13: Measurement of mechanical loads, 88/120/CDV, International Electrotechnical Commission (IEC), Geneva, Switzerland, 1999. Laino, D. J. and Pierce, K. G., “Evaluating Statistical Loads Extrapolation Methods,” A collection of the 2000 ASME Wind Energy Symp., at the AIAA Aerospace Sciences Mtg., Reno, Nevada, AIAA-2000-0064, January 2000, pp. 424432. MOUNTURB, Load and Power Measurement Program on Wind Turbines Operating in Complex Mountainous Regions, Volumes. I - III, Editor P. Chaviaropoulos, Coordinator A. N. Fragoulis, CRES, RISO, ECN, NTUA-FS, published by CRES, Pikermi, Greece, November 1996. Kelley, N. D., “A Case for Including Atmospheric Thermodynamic Variables in Wind Turbine Fatigue Loading Parameter Identification.” NREL/CP-500-26829, Second Symposium on Wind Conditions for Wind Turbine Design, IEA Annex XI, Roskilde, Denmark, 12-13 April 1999.
10