Rend. online SGI, 2 (2008), Note Brevi, www.socgeol.it, 115-120
Facies composition and stacking patterns of carbonate clinoforms: a quantitative approach in the analysis of a Tithonian prograding sequence from the Ogliastra Mountains (Eastern Sardinia, Italy) ALESSANDRO LANFRANCHI (*), FABRIZIO BERRA (*) & FLAVIO JADOUL (*)
RIASSUNTO Composizione ed organizzazione delle facies in corpi carbonatici clinostratificati: un approccio quantitativo nell’analisi di un complesso progradante del Titoniano dei monti dell’Ogliastra (Sardegna orientale, Italia) In Sardegna orientale, lungo il Golfo di Orosei affiora uno spettacolare spaccato di un complesso progradante di depositi carbonatici clinostratificati del Titoniano. L’affioramento, di dimensioni kilometrica, ha permesso di unire allo studio delle geometrie a grande scala un’analisi di dettaglio delle microfacies carbonatiche. Un set di sezioni sottili è stato sottoposto ad analisi quantitativa (point-count analysis) ed il data-set ottenuto è stato poi elaborato tramite-mode cluster analysis. Sono stati riconosciuti 10 principali gruppi o cluster di microfacies ciascuno con una propria composizione. Per analizzare la distribuzione delle microfacies all’interno della sequenza in esame, i campioni studiati sono stati plottati su uno sketch del complesso progradante in funzione del cluster d’appartenenza. Questo ha permesso di evidenziare come la progradazione della piattaforma titoniana non sia un unico evento con monotona composizione dei depositi, bensì il risultato di successive “pulsazioni di progradazione” ciascuna caratterizzata da una caratteristica composizione.
Key words: carbonate clinoforms, quantitative microfacies analysis
Upper
Tihtonian,
Nevertheless only a few works investigate in detail microfacies distribution across a prograding sequence, probably because of the scarcity of undeformed and accessible outcrops suitable for this kind of analysis. Here, a quantitative analysis of microfacies is performed to highlight patterns and composition of microfacies within a low-angle, Tithonian prograding sequence. GEOLOGICAL SETTING During the Jurassic, Sardinian microplate belonged to Southern European passive margin and was located in the tropical belt between 25°-30° N of latitude (FOURCADE et alii, 1993). Midlle Jurassic to lowermost Creataceous carbonate succession widely crops out in eastern Sardinia, along the Orosei Gulf. In the Ogliastra Mountains, close to Baunei village, an easily accessible, kilometre wide outcrop preserves a section of a Late Tithonian prograding sequence. This outcrop allows to reconstruct in detail the facies architecture within the clinoforms, joining the description of geometries to
INTRODUCTION Scientific literature on carbonate depositional systems shows a great amount of papers concerning the analysis of carbonate clinoforms and platform flanks that represent one of the most dynamic environments of carbonate platform. Particular emphasis has been placed on the sedimentological controls on the geometry of carbonate clinoforms (i.e. KENTER, 1990) and much has been told on how carbonate prograding sequences developed in response to sea-level fluctuation (i.e. POMAR, 1991; REIJMER et alii, 1991). Likewise processes responsible for sediment production and delivery has been analysed in depth to understand which are the conditions promoting platform progradation (BOOLER et alii, 2002; LANTZSCH et alii; VECSEI et alii, 1997;). _________________________ (*) Dipartimento di Scienze della Terra “A. Desio”, Università degli Studi di Milano.; corresponding author:
[email protected] Il presente lavoro è stato eseguito con il contributo di un sussidio ricevuto nell’ambito dello “IAS Postgraduate Grant Scheme”.
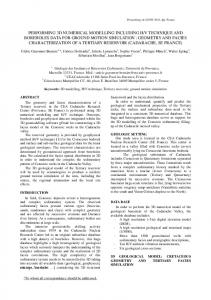
Fig. 1 – Litostratigraphic framework for the Middle Jurassic-Berriasian carbonate succession of eastern Sardinia. Red square indicates the studied sequence (Not to scale, modified after JADOUL et alii, 2007).
116
A. LANFRANCHI ET ALII
METHOD DATA ACQUISITION
Tab.. 1 – Matrix of Spearman’s Correlation Coefficients from point count of 103 thin sections. Values exceeding +/- 0,300 are highlighted with colored squares. Red indicates positive correlation between two point-count groups, blue means negative correlation.
a detailed microfacies analysis. The studied succession represents the base of the Tithonian–Berriasian depositional system (Fig. 1), a 500 metres thick, predominantly shallowwater carbonate succession (M.te Bardia Limestone Fm.) deposited during a low frequency transgressive-regressive cycle. Biostratigraphic data (JADOUL et alii, 2007) indicate that shallow water carbonate production began earlier (middle Tithonian) in the central area of Orosei Gulf and later (latemost Tithonian/earliest Berriasian) reached the deepest sectors. The prograding complex consists of clinostratified bioclastic sands and gravels downlapping on the underlying marlylimestone hemiplegic deposits (Pedra Longa Fm.). Prograding deposits are stacked into elementary structures named sigmoid. Adjacent sigmoids are joined into larger-scale structures labelled set of sigmoids (SS). Furthermore, the different sigmoids recognized within the prograding complex (on account of height, thickness, slope angle, downlap angle, etc.) likely reflect pulses in the sediment delivery from the shallowwater carbonate factory toward the basin.
In order to characterise the microfacies template sampling procedure has followed two distinct directions. Measurement and sampling of stratigraphic logs that cross vertically the prograding complex in different locations (in a platform to basin transect) has been coupled to an oriented sampling to highlight microfacies changes both along the sigmoids and across the boundaries of sigmoids and set of sigmoid. About 150 samples have been collected and a selected set of 103 thin sections has been studied. On account of a preliminary qualitative overview of microfacies, the main constituents of sediments have been identified. The different components, according to paleoenvironmental significance of the different abiotic and biotic components (i.e. DIENI et alii, 1985; SCHALGINTWEIT et alii, 2005), have been arranged into pointcount groups. To characterize both the skeletal and nonskeletal components of the sediments 13 point-count groups have been defined. Point-count groups represent the “quantitative” attributes used to describe the microfacies. For each thin section 300 points/section have been classified according to established point-count groups.The thin sections has been counted in volume, that means each grain is counted every time it falls into the grid, independently by previous countings. Non-skeletal categories include the following point-count groups: ooids and oncolithes (O&O), lumps and coated grains (L&CG), lithoclasts (Lith), pellettoids (Pell), cements and micrite (C&M). Fracture-filling cements and crystal silt have been avoided from counting. As skeletal categories are related to well-defined portions of the carbonate factory they need a more careful description.
Fig. 2 – Left: cluster composition expressed as mean value and standard deviation of each estimated attribute (point-count group). Right: dendrogram of Q-mode cluster analysis of the studied samples. Ward’s algorithm and squared Euclidean distance have been used. Each cluster is indicated with an alphanumeric code, numbers in brackets display number of samples within a cluster. Symbols indicate clusters and are the same used in fig. 2.
FACIES COMPOSITION AND STACKING PATTERNS OF CARBONATE CLINOFORMS
Reef biota (RB) point-count group includes frame builder such as corals, chetetids, stromaoporoids and hydrozoans. Rare specimen of foraminiferous such as legenids, Protopeneroplis sp. (WEYNSCHENK, 1950), Mohlerina basilensis (MOHLER, 1938), and microplobematica like Koskinobullina socialis (CHERCHI & SCHROEDER, 1979) that lived in outer platform environment are included in this group. Encrusters (Encr) category collects encrusting foraminiferous, serpulids and incertae sedis like Tubiphytes Morronensis (CRESCENTI, 1969) and Lithocodium sp. (ELLIOT, 1956). The group Echinoderms (Ech) gathers both echinoderm spines and fragments of crinoid and ophiurid. Miliolids, trocholinids, lituolids, foraminifera such as Labyrinthina mirabilis (WEYNSCHENK, 1951), Redmondoides lugeoni (SEPTFONTAINE, 1977) Pseudocyclammina sp., Kilianina sp., Coscinophragma sp., Rectocyclammina sp. together with calcareous algae Clypeina sulcata (ALTH, 1881), Salpingoporella pigmaea (GÜMBEL, 1891) and Salpingoporella annulata (CAROZZI, 1953) and the incertae sedis Thaumatoporella parvovesiculifera (RAINERI, 1922) have been counted into the Inner platform biota (PB) group. Three different categories regard bivalvs and gastropods (B&G), thick shelled bivalves (TB) and brachiopods (Brac). All the grains of evident biotic nature, but lacking of sufficient diagnostic features has been put into the category of undifferentiated skeletal grains (UnSk). Point-count group abbreviations in brackets reflect those used in tab. 1 and 2. DATA ANALYSIS Quantitative analysis returned a matrix with 13 columns (one for each point-count groups) and 103 rows (the analysed thin sections). Sperman’s Correlation coefficient was calculated to outline positive and negative correlation among point-count groups (tab. 1). To perform numerical classification of analysed microfacies, the dataset has been processed by means of Q-mode cluster analysis using Ward’s minimum variance clustering algorithm and squared Euclidean distance. Each
117
cluster was labelled according to DUNHAM (1962) and EMBRY & KLOVAN (1972) nomenclature for carbonate rocks. The “kinship” among clusters is expressed in the resulted dendrogram (fig. 2 right). Clusters composition, expressed as mean value and standard deviation of each estimated attribute is summarized in figure 2 (left). RESULTS Statistical analysis of the data set suggest that sediment composition differs mainly in the nature of the rock matrix that is represented by a mixture, in different proportions, of pellettoids and cements and micrite. Sperman’s Correlation Coefficient between these two groups is highly negative (0,686) indicating inverse correlation. In addiction the two main branches of the dendrogram (indicated by the capital letters Aand B- in the alphanumeric code in fig. 2) reflect this dualistic nature of sediment matrix. A moderate negative correlation is present for the pairs: lithoclasts & reef biota (-0,305) and lithoclasts & cements and micrite (-0,369). Brachiopods and echinoderms show a slight negative correlation with reef biota. A correlation coefficient of 0.943 links ooids and oncolithes, lumps and coated grains reflecting the mutual occurrence of these grains. The only skeletal groups showing a positive correlation (0,441) are echinoderms and brachiopods. Other groups reflecting weak positive correlation are: inner platform biota/bivalvs and gastropods; bivalvs and gastropods/ thick shelled bivalves; Reef Biota/Encrusters. Positive correlation is considered to testify for a common area of production. One of the main controversial aspects in the interpretation of cluster analysis outcomes concerns how many “degrees of dissimilarity” could be tolerated. This affect the number of clusters we consider in the development of our conceptual model. Several attempts, involving different tolerance of dissimilarity, have been performed to solve this dilemma. For each of these attempts every sample has been plotted on a
Fig. 3 – W-E Panoramic picture of the studied Tithonian prograding sequence. Symbols reflect the position of studied samples plotted by means of corresponding cluster. Lines indicate: sigmoid boundary, pale yellow line; set of sigmoids boundary, blue line; Pedra Longa Fm./Mt. Bardia Fm., violet line.
118
A. LANFRANCHI ET ALII
sketch of the prograding sequence according to the corresponding cluster. The results indicate that an 11-cluster numerical classification allows a detailed characterization of facies belt, an unambiguous identification of sigmoid boundaries and a better interpretation of partly conserved sigmoids. Ten of the eleven clusters rendered by statistical analysis (excluding B2b1 that contains only two samples) represent the 98% of all the thin-sections set. Coarse-grained sediments present the highest content in reef biota and encrusters and correspond to the clusters A2b1a, A2b2b2 and B2a, whereas fine-grained micritic and peloidal deposits plot respectively in cluster A1 and B1. Cluster B2b2 is by far the most conspicuous and consists of peloidal packstone rich in lithoclasts. The cluster A2a is the only group of microfacies with a relevant content in ooids and oncolithes, lumps and coated grain and inner platform biota. Encrusters and echinoderms are the main skeletal components of clusters A2b1b, A2b2a and A2b2b1. The distribution of cluster within the prograding sequence is shown in fig. 3. By the analysis of the cluster distribution is possible to stress that: • each sigmoid is the result of several episodes of sediments deposition along the slope; • association of clusters closely follow the three main sectors describing a sigmoid: slope-break, slope and toe of the slope. The transition among these sectors is gradual; • sharp along-slope migration (both landward and basinward) of cluster associations reflect boundary among set of sigmoids; • gradual basinward migration of cluster association occurs throughout subsequent sigmoid within a set-of-sigmoid;
four set of sigmoids (SS1, SS2, SS3, SS4) can be identified, each representing a major “event of progradation” (fig. 4); • aggradational from progradational tendencies in cluster association stacking patterns are evident within each set of sigmoids. Each event of progradation shows a partly different composition and organization of cluster assemblages: oncoidal/inner platform biota association characterize SS1, reef biota/lithoclastic assemblages are the main constituent of SS2 and SS4 whereas reef biota/peloidal association is typical of the SS3. In controlling the average grain-size, cluster assemblages control the overall geometry of each SS (i.e. respect to slope steepening). •
CONCLUSION The performed quantitative microfacies classification allows reconstructing the architecture of a Late Tithonian prograding sequence with high resolution. Quantitative analysis also evidences that within the Tithonian platform it is possible to identify different “pulses of progradation” each with a different sediment composition. Geometrical features (onlap relationship) as well as sediment composition suggest that changes in accomodation controlled sediment production and delivery. Therefore our data demonstrate that sediment composition (reflected by the distribution of cluster associations) varies along the slope. These changes are likely controlled by the presence along slope of different sediment sources that modify the relative composition of sediments flows as well as particles selection along the slope from the source area to the basin.
Fig. 4 – Preliminary conceptual-model for the studied Late Jurassic prograding sequence (Mt. Bardia Limestone Formation). Different colours are used to indicate the four recognized “event of progradation”, each with a distinct sediment composition and characteristic geometrical features. Shaded area indicate missing portion of prograding sequence. Red line indicate fault. As scale is not respected length and eight of the deposits are expressed.
FACIES COMPOSITION AND STACKING PATTERNS OF CARBONATE CLINOFORMS
119
Fig. 5 – Microfacies plate showing the aspect of most representative clusters (graphic scale: 0.5mm). a) Stromatoporoid fragment encrusted by serpulids and foraminifera. Cluster A2b1a: peloidal/encruster/reef biota grainstones and rustones; b) Coral specimens in a peloidal matrix. Cluster B2a: peloidal/lithoclst/reef biota packstones and rudstones; c) Tubiphytes morronensis (CRESCENTI, 1969). Cluster A2b1b: peloidal/lithoclasts/encruster packstones and grainstones; d) Oncolithes and Salpingoporella pigmea (GÜMBEL, 1891). Cluster A2a: oolite & oncolite/lumps & coated grain packstones; e) Mohlerina basilensis (MOHLER, 1938). Cluster A2b2b1: lithoclasts/peloidal/encruster packstones and grainstones; f) Echinoderm spine and crinoid fragments in a peloidal matrix. Cluster B2b2: peloidal packstones with crinoids and encrusters.
REFERENCES
BOOLER J. & TUCKER M.E. (2002) – Distribution and geometry of facies and early diagenesis: the key to accomodation space variation and sequence stratigraphy: Upper
120 Creataceous Congost Carbonate Pyrenees. Sed. Geol., 146, 225-247.
A. LANFRANCHI ET ALII
platform,
Spanish
KENTER J.A.M. (1990) - Carbonate platform flanks: slope angle and sediment fabric. Sedimentology, 37, 777-794.
DIENI, I. & MASSARI, F. (1985) - Mesozoic of Eastern Sardinia. In Cherchi, A. (Ed.), 19th European Micropaleontological Colloquium. Sardinia October 1-10, 1985. Micropaleontological researches in Sardinia. Guidebook. 66-77.
LANTZSCH H., ROTH S., REIJMER J.J.G. & KINKEL H. (2007) – Sea-level related resedimentation on processes on the northern slope of Little Bahama Bank (Middle Pleistocene to Holocene). Sedimentology, 54, 1323-1344.
DUNHAM R.J. (1962) - Classification of carbonate rocks according to depositional texture. AAPG Mem., 1,108- 121.
POMAR L. (1991) - Reef geometries, erosion surfaces and highfrequences sea-level changes, upper Miocene reef complex, Mallorca, Spain. Sedimentology, 38, 243-270.
EMBRY A.F. & K LOVAN J.E. ( 1972): Absolute water depth limits of Late Devonian paleoecological zones. Geol. Rundschau, 61, 672-686. FOURCADE E., AZEMA J., CECCA F., D ERCOURT J., V RIELYNCK B., BELLIO Y., SANDULESCU & M., RICOU, L.E. (1993) Late Tithonian palaeoenvironments. In Atlas Téthys Palaeoenvironmental Maps Decourt, J., Ricou, L.M., Vrielynck, B. eds. JADOUL F., LANFRANCHI A., CASELLATO C.E., BERRA F. AND GALLI M.T. (2007) - Stratigraphic evolution and paleogeographic setting of the Middle Jurassic-Early Cretaceous carbonate platforms in Eastern Sardinia (Italy)”. EGU General Assembly 2007, April, 15-20, Vienna (Austria). Abstract Book.
REIJMER J.J.C. & EVERAARS J.S.L. (1991) - Carbonate platform facies reflected in carbonate basin facies (Triassic, northern Calcareous Alps, Austria), Facies, 25, 253-277. SCHLAGINTWEIT F., GAWLICK H. & LEIN R. (2005) – Micropaleontology and biostratigraphy of the Plassen carbonate platform of the type locality (Upper Jurassic, Salzkammergut, Austria). Journ. of Alp. Geol., 47 (1), 11102. VECSEI A. & SANDERS D.G.K. (1997) – Sea-level highstand and lowstand shedding related to shelf margin aggradation and emersion, Upper Eocene-Oligocene of Maiella carbonate platform, Italy. Sed. Geol., 112, 219-234.