filter/flow graphical prototype, a visual query builder was developed to ... with little pre-existing knowledge to graphically construct complex database queries.
FACILITATING DATABASE QUERIES: GRAPHICAL VERSUS NUMERIC PREVIEW Joseph H. Goldberg Oracle Corporation Redwood Shores, CA Numeric query preview was compared to graphical preview for constructing ad-hoc database queries in a usability study. The overall objective was to provide evidence to make design recommendations for a future software prototype. Based upon an earlier filter/flow graphical prototype, a visual query builder was developed to enable end users with little pre-existing knowledge to graphically construct complex database queries containing multiple Boolean operators. Usability evaluation was conducted with 12 users each generating 12 queries. Overall query completion rates were 83%, affirming the usability of this prototype query builder. Numeric preview allowed faster query construction than visual preview for complex queries, but visual preview may have promoted increased verification of constructed queries. Participants were likely able to use and interpret numeric preview information more readily than graphical preview information. While further studies are needed, numeric query preview, possibly combined with visual preview, is recommended for future prototypes. INTRODUCTION Background Query errors. Rapid and accurate construction of ad-hoc queries is critical for the extraction of desired information from large, relational databases. Traditional, text-based querying requires substantial knowledge of Boolean logic and Structured Query Language (SQL). Subtle logic or syntax errors hidden within an input statement can generate null returns, or can create massive queries requiring hours of computer processing time. Use of Boolean operators is difficult for novice users because common language usage of these terms is opposite that of their use in Boolean expressions (Pane and Myers, 2000; Jones, 1998). For example, the common language request of all records from “Boston AND New York,” produces a SQL Boolean intersection of these cities, resulting in no records returned. The correct request is for “Boston OR New York,” even though the naïve user may believe that only one of these cities would then be considered. Graphical query construction. Graphical query specification provides an advantage over text-based SQL query input, allowing users to better understand submitted query components and their relationships (Young and Shneiderman, 1993). Graphical interfaces can lessen users’ reliance upon parentheses for establishing operator precedence, a particular source of difficulty for novices (Michard, 1982). For example, nested query strings that are viewed as objects contained within larger objects should be much easier to comprehend than query strings nested within layers of parentheses. Dynamic query preview. In the present context, Query Preview refers to interim feedback about the size of a query results set, as the query is being constructed. This preview can be considered to be dynamic if incremental user actions result in relatively rapid, incremental updates to this preview. Dynamic query preview can help users to more accurately specify their desired queries, and can allow iterative query
development before the query is submitted. It can improve query comprehension and better support browsing within an unfamiliar database (Plaisant, Shneiderman, Doan, and Bruns, 1999). Dynamically generated query preview can also keep the user from feeling overwhelmed by the complexity of large numbers of data categories within an unfamiliar database (Yee, Swearingen, Li, and Hearst, 2003). Providing dynamic query preview, in general, should allow users to more rapidly understand the results of their actions than without preview, and therefore more rapidly learn to develop intended Boolean logic. It is also expected that this preview should allow users to find logic errors before submitting a query, ensuring more accurate queries. Filter/flow model. Young and Shneiderman (1993) introduced a novel Filter/Flow query builder in which a stream of data is represented along with a series of condition filters. Successive filters represented ANDed conditions, and parallel branching flows represented ORed conditions. Dynamic query preview was provided through the analogy of river width representing the size of the returned query set at any point. With the addition of a NOT operator, their graphical query builder provided a very flexible and learnable query building tool for novice and intermediate-level users. In fact, all of their participants in a usability evaluation preferred this interface to a SQL interface. Performance advantages were also significant. Visual Query Builder Prototype A prototype Visual Query Builder (VQB) was developed to support the investigation of query preview on query construction time and accuracy. It was assumed that users would have basic, but little-used Boolean knowledge. The VQB presents a modified filter/flow model for condition building, combined with condition and container objects that can be created, dragged, and dropped onto various areas of the UI. Though the present study is focused on query preview
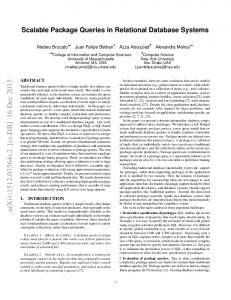
conditions, a brief explanation of the prototype’s UI is provided to place the experimental manipulations into context. The present prototype returns the number of database rows matching the stated filter criteria, as opposed to returning the actual table of results. Although a ‘real product’ would return a table or crosstab, the row count result was sufficient in this case to investigate the influence of query preview in condition building. A screenshot of the VQB, with a pre-constructed query, is shown in Figure 1. The represented query determines how many individuals have at least a college education, and work in either ‘Executive/Managerial’ or ‘Professional specialty’ jobs. The SQL ‘Where clause’ for this query is: “((education >= 16) AND ((job = Executive and Managerial) OR (job = Professional specialty)))”. To develop this query, ‘New Condition’ was first clicked to drop a condition onto the canvas workspace. This condition was set, via its menus, to ‘Education >= 16’, then dropped onto the ‘dataflow’ representation. The dataflow metaphor represents the narrowing river stream in the filter/flow model. The dataflow narrowed from 65,535 rows to 9698 rows, previewing the number of records in the database that met this condition. Next, two more conditions were created (job = Executive and Managerial, 4073 rows; job = Professional specialty, 4624 rows), and temporarily placed on the canvas work area. These were dropped into a ‘Basket’, a container object that joins all included conditions with an OR operator. The Basket, now containing two conditions, was next dropped onto the dataflow
below the Education condition, completing the query construction. The dataflow width further narrowed to indicate that 5289 records are available from the query. Queries of additional complexity can also be created via a grouping operator that allows sub-query strings to be joined by ANDs and ORs. Objective The objective of this study was to determine, using the VQB prototype, the degree to which numeric and/or visual query preview influence query construction time and accuracy over a range of query complexity levels. Recommendations about the form of query preview to provide in future prototypes could then be made. This is a specific objective within a larger context of investigating the usability of the present VQB user interface, relative to alternative designs. METHOD Participants Twelve participants (8 females; 4 males) were recruited for this study. Three were internal Oracle employees, and 9 were located through an Oracle-maintained database of external participants. All participants had previously constructed queries, understood basic Boolean logic, but had no specific knowledge of SQL, a database query and
Figure 1. Screenshot of query that determines who has at least a college education, and also works in Executive/Managerial or other Professional specialty Jobs. Captured from an experimental condition that displays both visual preview (width of the dark queryflow) and numerical preview (numbers shown on the flow).
programming language. External participants were paid $50, and internal participants received small Oracle gifts. Each participant was continuously videotaped within an Oracle research laboratory for subsequent analysis. Procedure Participants were run individually over a 2-hour period in an Oracle research lab. Each received a short screening for knowledge of Boolean logic, followed by 30 minutes of training on the VQB. This 30-minute training ensured that each participant had sufficient knowledge to create and modify UI elements within the prototype, but little instruction was provided on combining these together to create complex, ad-hoc queries. Participants then completed 12 queries. Each query was initiated by clicking the ‘Start’ button, and ended by clicking the ‘Submit’ button. Query preview was manipulated in four different conditions. Visual preview (Figure 2) varied the width of the dataflow relative to the number of records returned from each successive sub-query. When visual preview was not active, the dataflow width was constant, regardless of the number of records. Numeric preview (Figure 3) displayed the number of rows associated with query strings in each flow panel. Visual+Numeric preview provided both (previously shown in Figure 1), and No Preview provided neither form of query preview (as in Figure 3, without numerical displays).
The prototype was networked to a single-table, relational, 65,535-record U.S. Census Bureau test database from Southern California (UCI, 2000). The study included the following columns: Age (years), Education (years), Marriage Status, Industry of current job, Job Title, and Racial Identity. Experimental Design The 12 queries that were constructed by each participant were divided into 3 complexity levels, depending on the number of components (Conditions, Groups, or Baskets) required by each query. Low complexity queries required only one condition, medium complexity required 2-6 components, and high complexity 7-11 components. An example query was, “How many list their education level as high school or less (that is, 12 or fewer years)?” An example of a Medium complexity query was, “Determine the number of recipients for a mailing that includes all those with at least a college education (i.e., at least 16 years of education), and work in either Transportation or Machine Operation/ Inspection jobs.” A High complexity query example was, “Determine how many are at least 35 years old and divorced, or are under 35 years old and married.” These queries were of the symbolic form, respectively, of [A], [A AND (B OR C)], and {[A AND B] OR [C AND D]}. Within a complexity level, each of the queries was presented in one of four different query preview conditions: Visual, Numeric, Both Visual and Numeric, or No Preview. The order of the 12 queries (4 query preview x 3 complexity levels) was counterbalanced across the 12 participants, using a Latin Square design. Contiguous trials always had different Preview conditions, but could have the same Complexity levels. RESULTS Query Accuracy
Figure 2. Zoomed view of prior query (Visual preview).
Ten errors, defined when an incorrect query was submitted, were logged across the 144 submitted queries. Of these, 7 were from high complexity queries, and the rest were from medium complexity. Most of these errors were due to failures to properly combine components, or due to forgetting to place components on the dataflow prior to submitting a query. Half of the errors occurred in the Visual-only preview condition, leading to a significantly lower completion rate than the other conditions (t3 = 20, p