Gestalt psychology [1] studies how the human visual system orga- nizes the complex visual input into unitary elements. Many. Gestalt principles have been ...
Fast and Bottom-Up Object Detection, Segmentation, and Evaluation using Gestalt Principles Gert Kootstra and Danica Kragic Abstract— In many scenarios, domestic robot will regularly encounter unknown objects. In such cases, top-down knowledge about the object for detection, recognition, and classification cannot be used. To learn about the object, or to be able to grasp it, bottom-up object segmentation is an important competence for the robot. Also when there is top-down knowledge, prior segmentation of the object can improve recognition and classification. In this paper, we focus on the problem of bottomup detection and segmentation of unknown objects. Gestalt psychology studies the same phenomenon in human vision. We propose the utilization of a number of Gestalt principles. Our method starts by generating a set of hypotheses about the location of objects using symmetry. These hypotheses are then used to initialize the segmentation process. The main focus of the paper is on the evaluation of the resulting object segments using Gestalt principles to select segments with high figural goodness. The results show that the Gestalt principles can be successfully used for detection and segmentation of unknown objects. The results furthermore indicate that the Gestalt measures for the goodness of a segment correspond well with the objective quality of the segment. We exploit this to improve the overall segmentation performance.
I. INTRODUCTION Our future domestic robots will regularly encounter environments containing unknown objects. To reason about these objects, in order to grasp and manipulate them, the robot needs the ability to detect and segment them from the background. Methods for object detection and segmentation using top-down knowledge about the object have been successfully proposed and many object segmentation methods rely on input from a human user. However, an autonomous robot dealing with unknown objects and environments cannot use top-down knowledge or rely on human input. To this end, we focus on the problem of bottom-up detection and segmentation of unknown objects. In this paper, we propose an integrated object detection and segmentation method based on Gestalt principles for perceptual grouping and figure-ground segregation. Gestalt psychology [1] studies how the human visual system organizes the complex visual input into unitary elements. Many Gestalt principles have been suggested throughout the years [2], [3]. These principles formulate perceptual rules for the grouping of basic elements and the segmentation of figure and ground. Although some of the principles take topdown information into account, most are strictly bottomBoth authors are with the Center for Autonomous Systems of the Royal Institute of Technology (KTH), Stockholm, Sweden. {kootstra|danik}@kth.se. This work was supported by the EU through the project eSMCs, IST-FP7-IP-270212 and Swedish Foundation for Strategic Research.
0.84
0.67
0.82
0.58
0.60
0.69
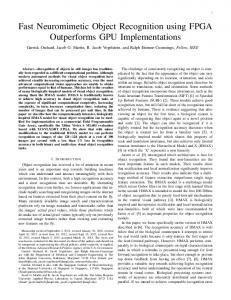
Fig. 1: Examples of segments resulting from different fixation points. In the paper we focus on the question how to select the best segment without prior knowledge of the object. The goodness measures of our segment evaluation method are shown in the top-right corner of the images.
up processes. This motivated us to apply the principles to bottom-up detection and segmentation of unknown objects. Our method consist of three modules; object detection, segmentation, and evaluation. In each module, different Gestalt principles are used. In the object-detection module, which we presented in [4], an object hypothesis is generated by selecting a fixation point based on the principle of symmetry. The fixation point initializes the figure-ground segmentation. The segmentation module, which we presented in [5] is based on similarity in color, proximity in depth, and deviations from the dominant plane. The resulting segment, however, can be incorrect, due to failure of the detection module to fixate on the object, or due to failure of the segmentation module to find the object borders (see Fig. 1). We therefore introduce a novel segment-evaluation method. The segment-evaluation module determines the figural goodness of the segment and selects the best object segment among a number of hypotheses. The goodness is based upon the principles of good continuation, contrast, proximity, symmetry, parallelity, color uniqueness and on deviations from the dominant plane. The main contribution of this paper is a novel method for the evaluation of the goodness of object segments using Gestalt principles, which is crucial to achieve good object detection and segmentation performance. We furthermore present an integrated method for fast and bottom-up detection, segmentation and evaluation of unknown objects, which is important for the real-time operation of robots in everyday environments. II. RELATED WORK We assume no prior knowledge about the objects or the object classes. However, object detection and segmentation
image
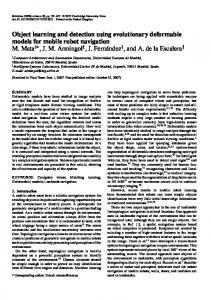
Object Detection symmetry
Object Segmentation disparity
similarity, proximity
Segment Evaluation good continuation, contrast, proximity, symmetry, parallelity, non-planeness
Segment with high goodness
Fig. 2: The proposed method and the used Gestalt principles.
can greatly benefit when information about, for instance, color, texture, and shape is available. Existing top-down methods are, for instance, based on interest points [6], shape descriptors [7], or histograms of oriented gradients [8]. Other methods use top-down information to detect objects and integrate bottom-up cues to refine the segmentation [9], [10]. Instead of using top-down methods, we make use of a bottom-up saliency model to detect objects in the scene. Many saliency models are based on the center-surround contrasts of basic features, such as brightness, color, and orientation, e.g., [11]. However, in [12], a symmetry operator was proposed to guide attention. This operator was extended to a symmetry-saliency model for the prediction of human eye fixations in [13]. We used the same model in [4] to detect salient objects in the scene, which was shown to outperform the contrast model. Most current methods for foreground-background segmentation are based on Markov Random Fields (MRF). Energy or probability functions are formulated and updated using graph cuts, e.g., [14], [15], or belief propagation, e.g., [16], to assign pixels to fore- or background based on similarities in color [14], and disparity [16]. To initialize the segmentation process, information about foreground and/or background need to be provided. Often this information is provided by a human user, for instance in the GrabCut method [14], where the user gives a bounding box around the to-be-segmented object. In [17], only a single fixation point needs to be provided on the object. Gestalt principles have been used in other studies. Symmetry, for instance, have been used to detect facial features [18]. In [19], grouping of image elements into larger regions have been based on similarity and contrast in texture and brightness, and on good continuation of the contour. In [20] the principles of proximity and good continuity have been used to cluster edge pieces to find the most salient boundary in the image. Top-down influence based on the principle of familiarity has been used in [21] by learning and using prototypical local shapes. These different top-down and bottom-up measures were using a CRF in [22]. Local evaluation of the principles of smallness, convexity, and lowerness have been used in [23] to label opposite sides of contours as foreground or background. Although the performance of the model was
similar to human performance when only local boundaries were shown, the authors concluded that in general, humans use global information and 3D cues as well. For the evaluation of the goodness of a segment, we adopt the good continuation of the contour and the contrast in color between figure and ground. We furthermore introduce symmetry, parallelity, and color uniqueness as global measures of the segment, and the 3D plane contrast between figure and ground and the out-of-planeness of the segment as 3D cues. III. THEORETICAL FRAMEWORK Our integrated bottom-up object detection and segmentation method consist of three methods, for object-detection, figure-ground segmentation, and segment evaluation (see Fig. 2). The object-detection method proposes object hypotheses by finding fixation points in the image. Such a fixation point initiates the figure-ground segmentation. The figural goodness of the segment is then evaluated. By doing this for multiple fixation points and possibly for multiple parameter settings of the segmentation method, the best segment can be chosen. Our object-detection approach and the figure-ground segmentation method have been presented in [4] and [5] respectively and will therefore be only briefly described. The segment-evaluation method is the main contribution of this paper and will be described in detail. A. Object Detection The object-detection method is based on the Gestalt principle of symmetry. In [4] we proposed the method based on the symmetry-saliency model that we used to predict human eye fixations [13]. The symmetry-saliency in the image is determined based on the amount of local mirror symmetry in the image. This is done by comparing the gradients of neighboring pixels. The local symmetry is calculated for all pixels and on different scales. The summation over scales gives the symmetry-saliency map. Based on the saliency map, fixation points are iteratively generated by selecting the local maximum in the map with the highest saliency value and subsequently applying an inhibition of return. The inhibition of return devaluates all local maxima which are in the same salient blob as the generated fixation point. This ensures that points in different parts of the image are selected. The fixation points are the object hypotheses, which initialize the segmentation. The object-detection method is fast. Running on a CPU (2.53 GHz Intel processor), the method takes approximately 50 ms for a 640×480 image, while a parallel implementation on a GPU (Nvidia GTX 480) runs in 5-10 ms . B. Figure-Ground Segmentation To segment foreground from background, we use the segmentation method that we presented in [5]. The method pre-segments the image into super pixel, where the superpixels are clusters of neighboring pixels with similar color. To group fore- and background super pixels in the image, the Gestalt principles of similarity and proximity are used.
pi+n j i pi
q i pi-n Fig. 3: The contour of the segment is depicted in dark gray. The orientation and curvature at point pi are calculated using neighboring points pi−n and pi+n . θi is the orientation of the contour at point pi and ϕi is the angle of the change in orientation of the contour, or the curvature.
pi as the angular change in orientation of the contour (see Fig. 3). This is defined as the difference in direction of the vectors pi+n − pi and pi − pi−n : ϕi ψi+ ψi−
= ψi+ − ψi− = =
(1)
tan−1 (yi+n − yi , xi+n − xi ) −1
tan
(yi − yi−n , xi − xi−n )
(2) (3)
In our experiments, we used n = 2. The final measure is inversely based on the mean curvature of the whole contour: 1 X ϕi (4) Ggc = π − |C| i∈C
Super pixels that are similar to the fixated super pixel in color and/or proximal in 3D position are likely to be labeled as foreground. In addition, the estimated 3D planes of the super pixels are compared to the dominant plane, to remove elements of the supporting plane from the foreground segment. The segmentation process is formulated as a Markov Random Field, using graph cuts to minimize the energy function. This energy function is based on color, disparity, and plane information. Initially, only the fixated super pixel is labeled as foreground, but the segment is iteratively refined by comparing all super pixels to the current fore- and background information. Due to the use of super pixels, the Markov Random Field does not contain many nodes. The graph-cut minimization of the energy function is therefore very fast. Implemented on a CPU (2.53 GHz Intel processor), the segmentation is done in 4-8 ms. This allows us to perform multiple segmentations and evaluate the resulting segments. The superpixel pre-segmentation, including the transformation to the Lab color space and the calculation of some color and disparity statistics, takes approximately 100 ms on the same CPU. A parallel GPU implementation of this part is quite straightforward and will greatly cut the processing time. C. Segment Evaluation The purpose of the segmentation-evaluation method is to evaluate the figural goodness of the segment. The figural goodness is the Gestalt term for a measure of how good, ordered, or simple a shape is. Evaluating the segments is important to recover from failures in object detection and in figure-ground segmentation. The fixation point can be not on the object, but on a symmetrical part of the background, and the segmentation method can fail to correctly find the object borders. By evaluating a number of segments, the best segment can be returned as the most likely object. The Gestalt measures that we use to determine the goodness of the segment are detailed below. 1) Good Continuation (Ggc ): This measure determines how continuous and smooth the contour of the segment is. In general, objects have a smooth contour, whereas mistakes in segmentation often result in non-smooth contours. To measure the continuity, the curvature of the contour is determined at every contour pixel. We determine the curvature ϕi at point
where C is the set of all contour points. 2) Color Contrast (Gcc ): The color of the object usually contrasts with the background. If the contour of the segment is nicely aligned with the boundary of the object, we expect the gradient of color at the segment’s contour to be strong. Therefore we use the color contrast at the contour as a measure of the segment’s goodness. The color contrast at contour point pi on the foreground with neighboring point pb on the background is defined as a weighted distance in rgb-color space: p ci = 0.3(ri − rb )2 + 0.59(gi − gb )2 + 0.11(bi − bb )2 (5) The resulting measure is the mean contrast at the contour: 1 X Gcc = ci (6) |C| i∈C
3) Plane Contrast (Gpc ): Based on the disparity information, we can estimate the local planes of the super pixels. At the object boundaries, neighboring super pixels will generally lie in different planes. This idea is exploited in the planecontrast measure. The contrast between the planes at opposite sides of the contour is measured. The plane contrast between plane pi at the foreground and its neighboring plane pb at the background is determined using the angle φib between the two plane normals and the distance dib between the centroid of both super pixels to the opposite plane. This results in the measure: 1 X (1 − e−10·φib ) + (1 − e−10·dib ) (7) Gpc = |Fc | i∈Fc
where Fc is the set of foreground super pixels along the contour of the segment. Some super pixels might have insufficient disparity information, in which case the contribution to the plane contrast is omitted. The measure is based on the plane-distance measure used in our segmentation method [5]. 4) Symmetry (Gs ): Many objects in domestic environments are symmetrical, or at least locally symmetrical. When an object segment is symmetrical, it is likely to correspond with an object, since symmetry is non-accidental. This measure is inspired by our object-detection method, but functions differently. The symmetry of the segment is calculated by comparing the orientations θi of the points on the contour. To speed up
b
a r 2
m
5) Parallelism (Gp ): Parallelism also counts as a nonq j g accidental property. Whenever two contours run parallel with j respect to each other, these contours are likely to belong together. The calculation of the parallelism of a segment is very similar to the symmetry calculation, with the difference in (9): � ηi,j = cos2 (γi − γj ) · sin2 (γi ) · sin2 (γj ) (13)
pj a q i g i
r1 pi
pi
Fig. 4: a) To calculate the symmetry and parallelity of the segment, points on the contour are compared to each other. b) The comparison of two contour points.
calculations and to smooth noisy contours, we subsample the contour by a factor of 4. The orientation of the contour is set to (see also Fig. 3): θi = tan−1 (yi+n − yi−n , xi+n − xi−n )
(8)
Every point on the contour pi is compared to other points on the contour pj at a distance r1 < ||pi − pj || < r2 , where we set r1 = 10 and r2 = 250 (see Fig. 4a). The symmetry contribution s(i, j) of the pair of points is similar to the symmetry measure that we use in the symmetrysaliency model, but adapted to be π-periodic, similar to [24]. π-periodicity is necessary, since θi ≡ θi + π. The symmetry contribution is: � ξi,j = cos2 (γi + γj ) · sin2 (γi ) · sin2 (γj ) (9) log(1 + ci ) · log(1 + cj )
λi,j
=
si,j
= ξi,j · λi,j
(10) (11)
where γi = θi − α with α being the angle of line between the two points (see Fig. 4b). The first term in (9) is the symmetry measure. The term has a maximum value when γi + γj = {0, π}, which is true for contour orientations that are mirror symmetric in the line m (see Fig. 4b). Using only this term would also result in assigning high symmetry values to to points that lie on the same straight contour. The second term in (9) therefore reduces the symmetry value when the contour has the same orientation as the line between pi and pj , that is, when γi = {0, π}. The symmetry values are multiplied by λi,j which includes the color contrast ci and cj at the points on the contour. This means that contours with stronger figure-ground contrast contribute stronger to the symmetry value, which diminishes the influence of noise. The total symmetry measure is then obtained by calculating the average symmetry contribution of all combinations of points on the contour: 1 XX Gs = si,j (12) N 0 0 i∈C j∈Ci
0
where N is the number of comparisons, C is the subsampled set of contour points, and 0 0 Ci = {j ∈ C |(r1 < ||pi − pj || < r2 ) ∧ F ((pi − pj )/2)} is the set of contour points that are compared to point i. F (p) is a function that return true is point p is part of the foreground and false otherwise.
pi,j
=
Gp
=
ηi,j · λi,j 1 XX pi,j N 0 0
(14) (15)
i∈C j∈Ci
The parallelity value is high when point pi and pj have parallel contour orientation. Again we discard points that lie on the same straight contour. 6) Color Uniqueness (Gcu ): This measure relates to the Gestalt principles of surroundedness and smallness. Objects are often smaller structures on a larger and more uniformly colored background. The object is often distinctively colored with respect to the background. Therefore, we relate this Gestalt measure to the uniqueness of the colors in the segment. To determine the uniqueness of the segments colors, we make color histograms for every super pixel in the segment and a histogram for the complete image. The less similar the super pixel’s histogram is to the overall color histogram, the more uniquely colored the super pixels is. We use the CIE Lab-color space for the histograms. The Lab space is perceptual uniform, which corresponds to the human experience and is preferable when comparing colors. The color histograms are three dimensional, with 8 × 8 × 8 bins. The color histograms are compared using Pearson’s correlation. By first smoothing the histograms using 3D Gaussian kernels, we introduce dependencies between neighboring bins, and thus between neighboring colors. This gives better color comparisons, and approaches the distance measures using the Earth-Mover’s Distance, with the benefit that it is much faster. The color uniqueness is: X Gcu = (1 − ρ(Hi , HT )) (16) i∈F
where F is the set of all super pixels labeled as foreground, Hi is the 3D color histogram of super pixel i, HT is the color histogram of the total image, and ρ is the correlation coefficient. 7) Out-of-Planeness (Gop ): This measure is basically a 3D contrast measure. We assume that the objects that we observe are placed on a supporting plane, and that it can be detected as the dominant plane. Everything that deviates from the dominant plane is potentially an interesting object. We estimate the dominant plane in the image using RANSAC as proposed in [16]. Because we also have the local plane estimates of every super pixel, we can compare each super pixel to the dominant plane using the angle between the normal vectors, φiD , and the distance from the super pixel’s centroid to the dominant plane, diD , similar
TABLE I: Correlation and explained variance (R2 ) of the Gestalt measures. Color Contrast
1
1
0.5
0.5
0.6
0.7
0.8
0.9
0
0
0.2
F1 score
Plane Contrast 1
1
0.5
0.5
0 0.4
0.5
0.6
0.7
0.8
0.9
1
0
0
0.2
F1 score
Parallelity 1
0.5
0.5
0
0.2
0.4
0.6
0.8
0
F1 score
0.5
0.5
0.2
0.4
0.6
0.4
0.6
0.8
0.8
1
0
0.2
0.4
0.6
0.7
0.6 0.5 best segment
0.4 0
0.2
0.4
0.6
0.8
Symmetry Fixation
0.8
0.8
to (7). The out-of-planeness measure is the average over all super pixels in the foreground: 1 X Gop = (1 − e−10·φiD ) + (1 − e−10·diD ) (17) |F| i∈F
Note that for some super pixels, the plane cannot be estimated reliably due to missing data or noise. Those super pixels are not taken into account. D. Combining the Segment-Evaluation Measures To combine the individual measures into a combined goodness, we use a simple multi-layer feedforward neural network, with one hidden layer with five hidden neurons. The network was trained on 600 examples using backpropagation learning. The examples are segments resulting from random fixations. For each example the 7 Gestalt measures are taken as input, and the F1 score of the comparison between the segment and the ground truth is set as the target for training. Learning continued until the error on a test set containing 2400 examples did not further decrease. This prevented overfitting on the data. The segment-evaluation method is computationally efficient. Calculating all Gestalt measures and combining them into a goodness measure is takes 5-10 ms on the CPU (2.53 GHz Intel processor). The processing time mainly depends on the length of the contour, mainly due to the quadratic complexity of the symmetry and parallelity calculations. IV. RESULTS The analyze the performance of the segment-evaluation method, we use the KTH Object and Disparity (KOD) database [4]1 . The database contains 600 images and disparity maps of 25 different objects with different backgrounds, positions, orientations, and lighting. Hand-segmented ground truth is available to measure the segmentation performance.
0.6 0.5 best segment
0.4
goodness selection
1
Fig. 5: The relation between the Gestalt principles and the true quality of the object segmentation measured by the F1 score. The results for the different objects are displayed with differently colored dots. The solid black lines show the linear regression model fitted to all data points, and the solid gray lines show the linear regression for the individual objects.
1 http://www.csc.kth.se/~kootstra/kod
Random Fixations
0.7 0
Goodness 1
0
0.8
0.8
Out−of−Planeness 1
0
0.6
R2 measure 0.31 0.34 0.41 0.39 0.37 0.51 0.59 0.80 0.87
Color Uniqueness
1
0
0.4
Symmetry
Correlation 0.56 0.58 0.64 0.63 0.61 0.71 0.77 − 0.93
F1 score
0 0.5
Measure good continuation color contrast plane contrast symmetry parallelity color uniqueness out-of-planeness Linear combination Neural network
F1 score
F1 score
Good Continuation
0
2
6 4 Nr of fixations
8
goodness selection 10
1
2
3 4 Nr of fixations
5
Fig. 6: Selecting the segment with the highest Gestalt goodness. The solid line show the average F1 score of the objectively best segment as a function of the number of fixation points. The gray bar displays the mean F1 score of the segment with the highest figural goodness. The left plot is based on random fixations and the right plot on fixation points selected by our object-detection method. The error bars give the 95% confidence intervals.
In Fig. 5, the relation between the different Gestalt measures and the objective quality of the segmentation is shown. The measurements are obtained using random fixation points. The plots show the Gestalt measures of the goodness of the resulting segment on the horizontal axis, and the F1 score on the vertical axis. The F1 score combines recall and precision resulting from the comparison of the segment and the ground truth. The different objects are displayed with differently colored dots. The solid lines show the linear regression model fitted to the data (N = 3000). It can be seen that all Gestalt measures have a positive relationship with the F1 score. This is an indication that higher Gestalt measures usually relate to better segmentation and that they can thus be used to evaluate segments. The plot on the bottom right shows the results for the combined goodness measure using the trained neural network. The combined goodness shows a good linear relationship with the F1 score. Table I shows the correlation coefficients between the Gestalt measures and the F1 score along with the explained variance by the linear regression model (R2 ). All individual measures can explain a large proportion of the variance in the measurements, with color uniqueness and out-of-planeness as most successful measures. The explained variance is 0.80 when the different measure are combined using multivariate linear regression. This shows that the different measures are complimentary. Combining the measures with the neural network results in an explained variance of 0.87 with a correlation of 0.93. This shows that the combined goodness is a good predictor for the quality of segmentation. The results of selecting a segment based on the highest combined goodness value is shown in Fig. 6. The left plot uses random fixations and the right plot uses fixations selected by our object-detection method. The solid lines show the mean F1 score of the best possible segment, i.e., selected
0.97
0.96
0.22
0.09
0.97
0.85
Fig. 7: Examples of scenes with multiple objects. The numbers in the topright corners of the images indicate the goodness measure by our model. Each column corresponds to a fixation.
based on the F1 score, as a function of the number of fixations. This sets an upper bound. The gray bar shows the mean F1 score when the segment with the highest figural goodness is selected by our segment-evaluation method. For both plots, our method gets close to the upper bound. This shows that the model successfully evaluates the segments and usually chooses the best object hypotheses. Our model greatly improves the segmentation performance over simply selecting one of the first few segments. Fig. 7 demonstrates that the methods can also be used in scenes with multiple objects. V. DISCUSSION We introduced an integrated method for fast and bottom-up object detection and segmentation. As an important element, we have proposed a novel segment-evaluation method. The method determines the figural goodness of a segment based on a number of Gestalt principles. The evaluation of segments is important in bottom-up processing, in order to be able to recover from failures in detecting the objects and from errors in the segmentation process. The evaluation method contains seven Gestalt measures: good continuation, color contrast, 3D plane contrast, symmetry, parallelity, color uniqueness, and out-of-planeness. All measures showed a positive relation with the objective quality of the segmentation, indicating that they are all good predictors of the quality of segments. Especially the correlation for the color uniqueness and the out-of-planeness was high. Also contrast in 3D plane, symmetry, and parallelity performed well. An improved prediction using a linearly combination of the individual measures showed that the different measures are complimentary. To combine the different measures in one goodness measure, we used a multi-layer feedforward neural network. The trained network showed a very good correlation. Using the combined goodness, the method was indeed capable of improving the bottom-up object segmentation. The proposed method allows to select the best segment from a number of hypothesized segments, which greatly improves bottom-up object segmentation. R EFERENCES [1] K. Koffka, Principles of Gestalt Psychology. Humphries, 1935.
London: Lund
[2] S. E. Palmer, Vision Science. Photons to Phenomenology. Cambridge, MA: MIT Press, 1999. [3] ——, “Modern theories of gestalt perception,” in Understanding Vision: An Interdisciplinary Perspective – Readings in Mind and Language, G. W. Humphreys, Ed. Oxford, England: Blackwell, 1992, pp. 39–70. [4] G. Kootstra, N. Bergstr¨om, and D. Kragic, “Using symmetry to select fixation points for segmentation,” in Proceedings of the International Conference on Pattern Recognition, 2010. [5] ——, “Fast and automatic detection and segmentation of unknown objects,” in Proceedings of the IEEE-RAS International Conference on Humanoid Robots (Humanoids 2010), 2010. [6] D. G. Lowe, “Distinctive image features from scale-invariant keypoints,” International Journal of Computer Vision, vol. 60, no. 2, pp. 91–110, 2004. [7] V. Ferrari, L. Fevrier, F. Jurie, and C. Schmid, “Groups of adjacent contour segments for object detection,” IEEE Transactions on Pattern Analysis and Machine Intelligence, vol. 30, no. 1, pp. 36–51, 2008. [8] N. Dalal and B. Triggs, “Histograms of oriented gradients for human detection,” in Proceedings of the 2005 IEEE Computer Society Conference on Computer Vision and Pattern Recognition (CVPR05), 2005. [9] A. Levin and Y. Weiss, “Learning to combine bottom-up and top-down segmentation,” International Journal of Computer Vision, vol. 81, no. 1, pp. 105–118, 2009. [10] E. Borenstein and S. Ullman, “Combined top-down/bottom-up segmentation,” IEEE Transactions on Pattern Analysis and Machine Intelligence, vol. 30, no. 12, pp. 2109–2125, 2008. [11] L. Itti, C. Koch, and E. Niebur, “A model of saliency-based visual attention for rapid scene analysis,” IEEE Transactions on Pattern Analysis and Machine Intelligence, vol. 20, no. 11, pp. 1254–1259, 1998. [12] D. Reisfeld, H. Wolfson, and Y. Yeshurun, “Context-free attentional operators: The generalized symmetry transform,” International Journal of Computer Vision, vol. 14, pp. 119–130, 1995. [13] G. Kootstra, B. de Boer, and L. R. B. Schomaker, “Predicting eye fixations on complex visual stimuli using local symmetry,” Cognitive Computation, 2011, doi: 10.1007/s12559-010-9089-5. [14] C. Rother, V. Kolmogorov, and A. Blake, “Grabcut: Interactive foreground extraction using iterated graph cuts,” in ACM Transactions on Graphics (SIGGRAPH’04), 2004. [15] A. Blake, C. Rother, M. Brown, P. Perez, and P. Torr, “Interactive image segmentation using an adaptive gmmrf model,” in Proceedings of the European Conference on Computer Vision (ECCV), 2004. [16] M. Bj¨orkman and D. Kragic, “Active 3d scene segmentation and detection of unknown objects,” in International Conference on Robotics and Automation (ICRA), 2010. [17] A. Mishra, Y. Aloimonos, and C. L. Fah, “Active segmentation with fixation,” in Proceedings of the International Converence on Computer Vision (ICCV), 2009. [18] D. Reisfeld and Y. Yeshurun, “Preprocessing of face images: Detection of features and pose normalization,” Computer Vision and Image Understanding, vol. 71, no. 3, pp. 413–430, 1998. [19] X. Ren and J. Malik, “Learning a classification model for segmentation,” in Proceedings of the Internation Converence on Computer Vision (ICCV ’03), vol. 1, Nice, 2003, pp. 10–17. [20] S. Wang, T. Kubota, and J. M. Siskind, “Salient boundary detection using ratio contour,” Advances in Neural Information Processing Systems, vol. 16, pp. 1571–1578, 2003. [21] X. Ren, C. Fowlkes, and J. Malik, “Figure/ground assignment in natural images,” in Proceedings of the European Converence on Computer Vision (ECCV ’06), vol. 2, Graz, 2006, pp. 614–627. [22] ——, “Cue integration for figure/ground labeling,” in Advances in Neural Information Processing Systems, Y. Weiss, B. Sch¨olkopf, and J. Platt, Eds., no. 18. Cambridge, MA: MIT Press, 2006, pp. 1121– 1128. [23] C. C. Fowlkes, D. R. Martin, and J. Malik, “Local figure-ground cues are valid for natural images,” Journal of Vision, vol. 7, no. 8, pp. 1–9, 2007. [24] G. Heidemann, “Focus-of-attention from local color symmetries,” IEEE Transactions on Pattern Analysis and Machine Intelligence, vol. 26, no. 7, pp. 817–830, 2004.