A Easy, Fast and Energy Efficient Object Detection on Heterogeneous On-Chip Architectures1 Ehsan Totoni, University of Illinois at Urbana-Champaign Mert Dikmen, University of Illinois at Urbana-Champaign ´ , University of Illinois at Urbana-Champaign Mar´ıa Jesus ´ Garzaran
We optimize a visual object detection application (that uses Vision Video Library kernels) and show that OpenCL is a unified programming paradigm that can provide high performance when running on the Ivy Bridge heterogeneous on-chip architecture. We evaluate different mapping techniques and show that running each kernel where it fits the best and using software pipelining can provide 1.91 times higher performance, and 42% better energy efficiency. We also show how to trade accuracy for energy at runtime. Overall, our application can perform accurate object detection at 40 frames per second (fps) rate, in an energy efficient manner.
1. INTRODUCTION
Many computing platforms used by consumers are portable devices such as notebooks, tablets, smart phones and more. Since these devices are usually battery powered, achieving high energy efficiency is a crucial challenge. On the other hand, because of their portability, mobile devices encounter many situations where they are expected to understand their environment in a natural way. For example, many photo applications need to automatically adjust the focal range based on the size of faces looking at a camera. In addition, gestures are frequently preferred to classical keyboard and mouse based input. Furthermore, search engines can allow a query to be formulated using visual inputs without requiring the user to provide the semantic translation of the visual content. Most natural interactions, such as the examples mentioned, require some usage of vision and video analytics algorithms. These tend to be floating-point intensive and computationally demanding, but also regular, which make them good candidates for parallelism. Such data parallel algorithms adapt well to GPU type architectures, resulting in higher performance and energy efficiency [Kumar et al. 2005]. However, general purpose programming of GPUs requires knowledge of new programming paradigms, such as CUDA and OpenCL, which decreases programmer productivity. Traditionally, the GPU has been a peripheral component, used as a computational aid to the CPU (which is needed for latency-oriented functions such as the operating system). However, deploying stand-alone GPUs may not be desirable (or even practical) for portable platforms for different reasons. First, using an extra chip increases the system design and implementation cost significantly. Second, the extra chip, along 1 New
Paper, Not an Extension of a Conference Paper
This work has been done at the Intel-Illinois Parallelism Center of Department of Computer Science at the University of Illinois at Urbana-Champaign, Urbana, IL, 61801. Permission to make digital or hard copies of part or all of this work for personal or classroom use is granted without fee provided that copies are not made or distributed for profit or commercial advantage and that copies show this notice on the first page or initial screen of a display along with the full citation. Copyrights for components of this work owned by others than ACM must be honored. Abstracting with credit is permitted. To copy otherwise, to republish, to post on servers, to redistribute to lists, or to use any component of this work in other works requires prior specific permission and/or a fee. Permissions may be requested from Publications Dept., ACM, Inc., 2 Penn Plaza, Suite 701, New York, NY 10121-0701 USA, fax +1 (212) 869-0481, or
[email protected]. c YYYY ACM 1544-3566/YYYY/01-ARTA $15.00
DOI:http://dx.doi.org/10.1145/0000000.0000000 ACM Transactions on Architecture and Code Optimization, Vol. V, No. N, Article A, Publication date: January YYYY.
A:2
with its associated overheads such as power supplies, increases the power and energy consumption. Third, the off-chip connection between the CPU and the GPU may have high performance and energy overheads. A reasonable alternative for deploying a GPU is to put it on the same chip as the CPU, and create a heterogeneous on-chip architecture. Advancements in system-onchip design and increases in the number of available on-chip transistors has made hybrid architectures practical. Emerging examples such as Intel Ivy Bridge [Damaraju et al. 2012], AMD Fusion [Foley et al. 2012] and NVIDIA Tegra 250 [NVIDIA 2011] have implemented this idea. For this study, we have chosen an application, object detection using ViVid [Dikmen et al. 2012], as a representative of vision applications. The domain of our study is on-chip hybrid architectures, which are most predominantly found in mobile platforms. We believe that object detection is a representative mobile application because it is fairly computationally demanding and it processes streamed visual input from a camera. Similar to our study, most vision applications that would be utilized in mobile devices (e.g. recognition, tracking, stabilization) consist of a pipeline of small number of kernels, where kernels are the core compute intensive components of an application. Of course, there is a large variety of kernels across the spectrum of vision applications. However, from a computational perspective, the pipeline in this paper provides a good mixture of kernels efficient on GPU, CPU or both. In addition, object detection is an important application for future portable devices, which has not yet been realized beyond basic face detection. Notice that our focus on one application allows us to go deeper into the details of individual kernels. We describe and evaluate the steps one might take to improve performance and energy efficiency: (1) Code optimization, (2) Mapping strategies, (3) Dynamic Voltage and Frequency Scaling (DVFS) [Mudge 2001] and (4) Algorithmic tradeoff of accuracy. We report the lessons learned, which would give insight to application developers and system designers. In this paper, we evaluate and analyze different programming paradigms and strategies for energy efficiency. We implement and execute (on the Ivy Bridge architecture) four different code versions of ViVid using 1) OpenCL, 2) OpenMP + auto-vectorization, 3) OpenMP + vector intrinsics, and 4) the OpenCV vision library. The OpenCL version runs on both the CPU and the GPU, while the other versions only run on the CPU. Our experimental results show that OpenCL does not deliver the performance that can be attained when using lower level interfaces (e.g. vector intrinsics on CPU), but provides a reasonable performance (Section 4). The OpenCL code processes 40 frames per second (fps) for accurate object detection (Section 5), so it can be used for applications that require real-time object detection (33fps). Notice that the performance of our OpenCL implementation is superior or similar to recent works using much more capable discrete GPUs [Beleznai et al. 2011; Zhang and Nevatia 2008]. We also show that mapping each kernel to the device (CPU or GPU) where it executes more efficiently and overlapping the computation of the kernels is the best approach. Our results show that with these heterogeneous platforms it is possible to find mappings that, while executing relatively faster, are less energy efficient (this is discussed in Section 5). In addition, it is possible to gain better energy efficiency by sacrificing a small amount of accuracy algorithmically. For our application, we can reduce 20% of the energy consumed at the cost of an increase of only 1% miss-rate on image detection (Section 5.3). Note that manufacturers do not know how to design hardware and software of future portable devices to support new interfaces (e.g. for human interaction). For instance, specialized hardware accelerators and optimized vision libraries are considered. We show that using a unified programming paradigm (e.g. OpenCL), vision applications can deliver the required performance (for a typical number of frames per seconds) and ACM Transactions on Architecture and Code Optimization, Vol. V, No. N, Article A, Publication date: January YYYY.
A:3
energy efficiency on heterogeneous on-chip architectures. To the best of our knowledge, the literature only considers large discrete GPUs with very different trade-offs in performance and energy efficiency for these applications. The rest of this paper is organized as follows. Section 2 describes our application and experimental setup briefly. Section 3 evaluates and analyzes different optimizations for our kernels using OpenCL for the CPU and the GPU. Next, Section 4 compares the performance and programming effort of the OpenCL paradigm to others for the CPU. After that, Section 5 evaluates the performance and energy consumption of different kernels on either the CPU or GPU. It also optimizes the full application’s performance and energy consumption using different mapping methods. Finally, Section 6 reviews some related work and Section 7 concludes the paper. 2. ENVIRONMENTAL SETUP 2.1. ViVid
We focus our study on an object (e.g., face) detection algorithm [Dikmen et al. 2012] for finding objects with a specific shape or appearance in unconstrained visual input. This object detector is analogous to most practical approaches [Jones and Viola 2003; Felzenszwalb et al. 2010] to this problem, which follow a common work-flow called “sliding window object detection”. This process involves describing the visual information inside small rectangular regions of the image or video frame hypothesized to contain the object, and applying a decision function that yields a binary output indicating the presence or absence of the object in each of such rectangles. Sliding window detection is the most established approach for the unconstrained object detection problem. Other popular methods include generalized voting frameworks [Maji and Malik 2009] or contour matching [Ma and Latecki 2011]. In all cases, object detection is a very computationally demanding application because image information needs to be evaluated densely over all the potential locations which may contain the object. ViVid’s sliding window approach breaks up the problem into two distinct parts: 1) describing the image information, and 2) classifying it. The image information is described by correlating the gray-scale image with numerous 3 × 3 patterns and summarizing these correlations in terms of spatially local histograms. The classification is achieved by processing these histograms through linear support vector machines [Burges 1998]. Other than object detection, there are numerous applications of computer vision on mobile devices including video stabilization, panorama stitching, gesture recognition etc. However, the data description followed by a data association work-flow is a common pattern. Typically, the data description part touches every pixel at least once and builds a summarization of structures of interest (e.g. colors, gradients, textures). The data association part measures the distance between the data summaries against stored exemplars. In classification applications, these can be templates for objects, and in segmentation applications these are usually cluster centers. The computational stages in a mobile computer vision application may be computationally balanced or particular stages may give rise to performance bottlenecks. In our selected object detection algorithm, the data description and data association steps are well balanced in terms of their computational load. Therefore, we believe it comprises a good case study with challenges in both stages. To build our object detector pipeline, we use the ViVid library2 . ViVid includes several atomic functions common to many vision algorithms. We have used ViVid successfully in event detection applications [Dikmen et al. 2008; Yang et al. 2009].
2 http://www.github.com/mertdikmen/vivid
ACM Transactions on Architecture and Code Optimization, Vol. V, No. N, Article A, Publication date: January YYYY.
A:4
For the purposes of this work, we extended ViVid by adding OpenCL equivalents of several kernels. We use the C++ interface to orchestrate the calls to these OpenCL functions or kernels. 2.2. Blockwise Distance
This kernel needs to find the maximum response (normalized cross correlation) of 100 filters on a small square image patch (in this application, 3 × 3) centered at every pixel of the image, while remembering which filter delivered this maximum at every pixel. Algorithm 1 outlines the overall algorithm. for each 3 by 3 image patch centered at a pixel do for each filter j of 100 filters do response = 0; for each coefficient i of the 9 coefficients of filter[j] do response += filter[j][i]*pixel[i]; end if response > max response then max response = response; max index = j; end end end Algorithm 1: Filter kernel
2.3. Cell Histogram Kernel
Cell histogram kernel is the second stage of data description, where the low level information collected by the filter kernel is summarized for small, non overlapping square blocks of the image. A 100 bin histogram is populated for each of these blocks by accumulating the “max response” values in their respective bins (given by “max index”) from every pixel inside the block. Note that this operation is different from well known image histogramming problem, for which many parallel implementations exist. Our approach differs in two important aspects: (1) the histogram bins represent a weighted sum (not a simple count) and (2) we build many local histograms not a single global one. 2.4. Pairwise Distance
This kernel is the data association step in our application. It finds the Euclidean distance between two sets of vectors, where one vector corresponds to the histogram previously generated and the other vector represents the template. This kernel measures how close each descriptor is to the template of the object of interest. If the distance is small enough, it shall output a detection response. The kernel is structurally similar to the matrix multiply operation, which finds the dot product between every row of one matrix and every column of another one. However, in pairwise distance, we compute the square of the two values’ differences, instead of just multiplying them. 2.5. Ivy Bridge Architecture
For the experiments reported in this paper, we use the two different platforms shown in Table I, both based on the Intel Ivy Bridge architecture. The first one is a 3.3 GHz quad-core used for Desktops and the second one is 1.7 GHz dual-core used for ACM Transactions on Architecture and Code Optimization, Vol. V, No. N, Article A, Publication date: January YYYY.
A:5
Ultrabooks. Both platforms have an integrated GPU that can be programmed using OpenCL3 . GPUs exploit Single Instruction Multiple Thread (SIMT) type of parallelism by having an array of Compute Units (CUs). Each CU is assigned a work-group, where work-items in each group run in lock-step, executing the same instruction on different data. GPUs are designed to efficiently exploit data parallelism. Branchy codes may run poorly on GPUs, as all the different paths in a control flow need to be serialized. Note that the Ivy Bridge’s GPU is simpler than Nvidia [Lindholm et al. 2008] or AMD/ATI [Zhang et al. 2011] GPUs. It has a small number of compute units and simpler memory hierarchy, for instance. Table I: Intel Ivy Bridge (Core i5 3350 & 3317U) processor specifications Platform Desktop Ultrabook Processor Number i5-3550 i5-3517U # of Cores 4 2 Base Clock Speed 3.3 GHz 1.7 GHz Max Turbo Frequency 3.7 GHz 2.6 GHz Base CPU peak 105.6 GFLOPs 27.2 GFLOPs Max CPU peak 118.4 GFLOPs 41.6 GFLOPs Cache Size 6 MB 3 MB Lithography 22 nm 22 nm Max TDP 77 W 17 W Intel HD Graphics 2500 4000 GPU Execution Units 6 16 GPU Base Frequency 650 MHz 350 MHz GPU Max Dynamic Frequency 1.15 GHz 1.05 GHz Base GPU peak 31.2 GFLOPs 44.8 GFLOPs Max GPU peak 55.2 GFLOPs 134.4 GFLOPs The Ivy Bridge CPU contains multiple cores, where each core supports Advanced Vector Extensions (AVX) that apply the same instruction on multiple data simultaneously. AVX supports 256-bit wide vector units that allow vector operations to operate on 8 floating-point numbers simultaneously. Unless otherwise stated, the experiments reported in the paper use the Ultrabook platform. For comparison purposes, we have also run experiments on the Desktop platform and an Nvidia Fermi GPU. For the evaluation, we use Intel SDK for OpenCL [Int 2013a] to run OpenCL codes. We also wrote OpenMP code with and without vector intrinsics that we compiled using the intel ICC compiler and /O3 compiler flags. Table II summarizes the software environment we use for the experiments. OpenCL is a unified programming paradigm, used to write programs for heterogeneous platforms. OpenCL programs can use an address space qualifier (such as global for global variables or local for local variables) when declaring a variable to specify the memory region where the object should be allocated. The OpenCL implementations for the GPU in the Ivy Bridge accesses memory through the GPU-specific L3 cache and the CPU and GPU Shared Last Level Cache (LLC). Accesses to global variables go through the GPU L3 cache and the LLC. Accesses to local memory (also referred as shared local memory because this local memory is shared by all work-items in a work-group) is allocated directly from the GPU L3 cache. Thus, GPU L3 cache can be used as a scratch-pad or as a cache. The size of 3 http://www.khronos.org/opencl/
ACM Transactions on Architecture and Code Optimization, Vol. V, No. N, Article A, Publication date: January YYYY.
A:6
this memory is 64KB (obtained using the standard ”clGetDeviceInfo()” OpenCL call) for both platforms, the Desktop and the Ultrabook. The CPU does not have hardware support for local memory, so in principle codes running in the CPU do not benefit from using local memory. Additional details can be found in [Int 2013b]. Table II: Software environment used for experiments Operating System GPU driver OpenCL SDK Compiler
Windows 8 Build 9200 Intel 9.17.10.2867 Intel 3.0.0.64050 Intel ICC 13.0.1.119
2.6. Evaluation methodology
For the experimental results, we measure the time of thousands of iterations of the application and report the average. This is realistic for many vision applications, which are expected to perform analysis (e.g. detection) over a continuous input of frames, fed from the device camera. This setup is especially important for the Ivy Bridge GPUs, since the running times have high variance in the first few iterations, but stabilize after some “warm up” iterations. For all the experiments reported here, our input image size is 600 by 416 pixels. For power and energy measurements, we use hardware energy counters available in the Ivy Bridge architecture [David et al. 2010]. They measure three domains: “package”, “core” and “uncore”. Package means the consumption of the whole chip, including CPU, GPU, memory controllers, etc. Core is CPU domain and Uncore is the GPU domain. For power measurement of the whole system, we plug a power meter to the machine’s power input. The new Intel Turbo Boost Technology 2.0 [Rotem et al. 2012] makes the measurements complicated on this architecture. In a nutshell, it accumulates “energy budget” during idle periods and uses it during burst activities. Thus, the processor can possibly go over the Thermal Design Power (TDP) for a while. It takes it a few seconds to reach that limit and several seconds to go back to the TDP limit. This can change the performance and power of the processor significantly. One might turn this feature off for accurate measurements. However, it is an advanced strength of the architecture that can enhance the user experience significantly (e.g. for interactive use), so it should not be ignored. For our measurements, we run each program for around 10 seconds (which seems to be a valid common use case) and average the iteration times and power consumption. We used the machine peak performance numbers reported in the Intel documentation4 . However, those values are computed using the maximum frequency value and AVX vector units, but, as mentioned, the processor cannot be at the maximum frequency for a long time. Thus, in many cases, peak performance numbers are upper bounds of the actual peak performance. 3. OPTIMIZATION OF KERNELS IN OPENCL
In this Section, we describe the optimizations we applied to the OpenCL kernels described in Section 2.1. Then, in Section 3.4, we analyze the performance impact of each optimization. The OpenCL codes run in both the CPU and the GPU, but it is possible that an optimization that works well for the GPU would hurt the performance when 4 http://download.intel.com/support/processors/corei7/sb/core
i7-3700 d.pdf
ACM Transactions on Architecture and Code Optimization, Vol. V, No. N, Article A, Publication date: January YYYY.
A:7
running on the CPU or vice versa. From now on, we will refer to the Blockwise Distance Kernel as filter, the Cell Histogram Kernel as histogram, and the Pairwise Distance kernel as classifier. 3.1. Filter Kernel
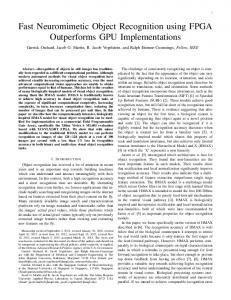
Here, we describe the optimizations that we applied to the filtering algorithm shown in Figure 1. 3.1.1. Parallelism. We exploit parallelism by dividing the image across multiple workgroups with several work-items. Then, each work-item runs the 100 filters on its image block. We use 16 by 16 work-group size following Intel OpenCL SDK’s recommendation (considering also our working set memory size). In addition, we use the Kernel Builder (from the Intel OpenCL SDK) tool’s work-group size auto-tuning capabilities to make sure this is the best size. 3.1.2. Loop Unrolling. We completely unroll the inner loop, which has 9 iterations. 3.1.3. Vectorization. This transformation tries to exploit the CPU’s AVX vector units. Without vectorization, this kernel calculates the response of every filter on a three-bythree image patch, keeping track of the maximum one. This requires nine multiplyadd operations, followed by an update guarded by an if statement. In this form, the inner loop cannot be fully vectorized. Since AVX supports 8 operations at a time, we can vectorize eight of the multiplies and partially vectorize the sum reduction, but still need to run one sequentially. Thus, to enable efficient vectorization, instead of working on one filter at a time, one can consider eight of them at the same time. Note that the number of filters (100) is not a multiple of eight so we need to handle the last four filters separately. Each pixel value needs to be replicated (broadcast) in a vector to participate in the vector operations. This transformation needs a reorganization of the filter coefficients’ data structure in the memory. Originally, a filter’s nine coefficients are located in consecutive memory locations (Figure 1(a)). However, we need the first coefficients of eight filters to be together to be able to load them in a SIMD vector (Figure 1(b)). Figure 1 illustrates these layouts using different colors for different filters, 9 floatsand numbers for different elements of a filter. Thus, effectively, we are transposing each 8 × 9 sub-matrix of eight filter coefficients to an 9 × 8 one. This transformation is generally useful for vectorizing ... 1 of2coefficients ... 9most1probably various filters of different sizes since the number does not match the SIMD size. Note that this transformation can be thought of as a customized instance of the Array of Structures (AoS) to Structure of Arrays (SoA) transformation.
8 floats
9 floats 1
2
...
9
1
(a) original coefficient layout
...
1
1
1
...
2
2
...
(b) vectorized coefficient layout
1: change of coefficient data layout for vectorization 8 floats ... is specific to the GPU. The filter kernel oper1 Memory. 1 1 This ... optimization 2 2 3.1.4. Local ates on an image and the 100 filter coefficients. The filter coefficients occupy 3.5KB that we copy (using all the work-items in parallel) to the local memory. Each workgroup also copies the image block it needs. This optimization may hurt performance ACM Transactions on Architecture and Code Optimization, Vol. V, No. N, Article A, Publication date: January YYYY.
A:8
when the code runs on the CPU due to the copying overheads. This is evaluated in Section 3.4. 3.2. Cell Histogram Kernel
The parallelism is achieved through a scatter operation. Every work-item in a workgroup accumulates a subset of the values inside the image block to their respective histogram bins. Note that this is a potential race if two or more work-items in the same work-group try to increment the same histogram bin. This race can be avoided if the language and the hardware allow for “atomic add” directives for floating point numbers. However, these atomic operations serialize memory accesses and can hurt the performance significantly. We allow this race in our OpenCL kernel because our Monte Carlo simulations have shown that the probability of such a race is low given the distribution of filter indexes in natural image patches. Therefore we do not expect the race conditions to change the shape of the histograms drastically, and we have validated this through experiments. Unlike scientific applications, media programs do not need full accuracy in many cases, and we should exploit this for better performance and energy efficiency. 3.3. Classifier Kernel 3.3.1. Parallelization. Parallelizing this code is similar to a tiled matrix multiply, where a work-group is responsible for a tile of the output matrix (as with the filter, we use 16x16 tiles). 3.3.2. Loop Unrolling. We manually unroll the innermost loop, which has 16 iterations. 3.3.3. Vectorization. Vectorizing this code is easy as operations are done in an element by element fashion, with elements in consecutive memory locations. After accumulating differences in a vector, a sum reduction is required (which we implement as a dot product with an identity vector). 3.3.4. Local Memory. All the work-items load the two blocks of elements they want to work on in parallel in the local memory. 3.4. Performance evaluation
In this Section, we evaluate the performance impact of each of the optimizations. Figure 2(a) shows the execution time for filter when running on the CPU or the GPU. The bars show the cumulative impact of the different transformations. Thus, Unroll+Vec+LocalMem corresponds to the execution time after all the optimizations have been applied. As Figure 2(a) shows, after applying all the above optimizations, this kernel runs more than 10 times faster on the GPU than the original non-optimized code. It now takes only 8.46ms. It also made it 6.4 times faster on the CPU (takes 25.5ms for the same image). Loop unrolling speeds up this kernel for both the CPU and the GPU. Vectorization speeds up filter for the CPU significantly. Also, even though the GPU does not have CPU-like vector units, execution times decreases by about 16% (this is discussed in Section 3.4.3). We also note that the use of the local memory for the filter coefficients does not have a significant overhead on the CPU. Thus, the same kernel code can be used for both architectures. Figure 2(b) shows the results for the classifier. As the figure shows, both unroll and vectorization improve the performance significantly. However, the use of local memory degrades performance for both devices. Hence, we did not use the local memory for classifier and, again, the same code is used for both the CPU and the GPU. To assess the utilization of the CPU and GPU, we measured the MFLOPs for both filter and classifier. Numbers on top of the bars in Figures 2(a) and 2(b) show the ACM Transactions on Architecture and Code Optimization, Vol. V, No. N, Article A, Publication date: January YYYY.
A:9 CPU 160
GPU
CPU 160
7%*
GPU
8%*
120 100 4%
80 18%
60 40 19%
20
44% 22%
45%
Execution time (ms)
Execution time (ms)
140 140
120
3% 3%
100
13%
80
17%
60 8% 9%
40 49%
20 42%
0
0
r
to
c m Ve e l+ lM ol ca nr o U +L
ec
V l+
ol
nr
U
l
ol
nr
U
se
ba
r
to
c m Ve e l+ lM ol ca nr o U +L
ec
V l+
ol
nr
U
l
ol
nr
U
se
ba
(a) Filter kernel
(b) Classifier kernel
2: Execution time of kernels with different optimizations (on Ultrabook); *- percentage of peak performance. performance of each code as a percentage of the peak performance of the machine. Our numbers show that filter runs at 45% and 42% of the peak performance on the CPU and GPU, respectively. Classifier runs at 49% and 9% on the CPU and GPU, respectively. Thus, filter utilizes both the CPU and GPU very well, while classifier only has that level of utilization on the CPU. The inefficiency of GPUs for certain workloads has been discussed in related work [Lee et al. 2010]. However, 9% utilization might be considered high for certain workloads on the GPU. Note that a more optimized code usually results in faster and more energy-efficient execution. In fact, in our experiments we observed that the programs were consuming the same or similar power before and after the optimization. Thus, decreasing execution time almost directly results in lower energy consumption in this case. Table III summarizes our results about which optimizations were effective on each device. Note that the OpenCL filter kernel that we use in the following sections uses the local memory optimization, since it does not hurt performance, and this allows us to have a single code version for both devices.
Table III: Effective optimizations for filter and classifier kernels on Ultrabook Kernel filter classifier
Unroll yes yes
GPU SIMD Local-Mem yes yes yes no
Unroll yes yes
CPU SIMD Local-Mem yes no yes no
Same code? yes yes
Next, we discuss the performance results, specifically the impact of using local memory, branching effects, and vectorization in more detail. 3.4.1. Local memory usage. Our results in Figures 2(a) and 2(b) show that the use of local memory is important for the filter kernel but undesirable for the classifier. Using the local memory is essential for the filter kernel on the GPU. The reason is that a small set of constant data (the filter coefficients) are needed for the whole execution (all the iterations of the outer loop). Relying on the GPU L3 cache is not ACM Transactions on Architecture and Code Optimization, Vol. V, No. N, Article A, Publication date: January YYYY.
A:10
effective because the data from the image that is being accessed at the same time might replace the filter coefficient in the cache. On the other hand, using the local memory is detrimental for the classifier kernel on the GPU of our Ivy Bridge Ultrabook. However, using the local memory for the classifier improves the performance on the smaller GPU (HD Graphics 2500 device) of the Desktop platform by 35%, even though the architecture is essentially the same (the Desktop GPU has only 6 CUs, while the Ultrabook GPU has 16 CUs). To understand the differences in performance (in the absence of performance counters), we used the memory streaming micro-benchmark of uCLbench package [Thoman et al. 2011] that measures the effective bandwidth to memory. This benchmark allocates arrays in memory (either local or global), that are accessed by all the work-items repeatedly. Our experimental results show that the effective bandwidth of local memory is less for the Ultrabook GPU than for the Desktop GPU (7.8 GB/s for the Ultrabook vs. 10.3 GB/s for the Desktop) when local arrays are accessed. On the other hand, the effective bandwidth of global memory is about the same for both machines (7 GB/s for the Ultrabook vs. 7.4 GB/s for the Desktop) when global arrays are accessed. Notice that the working set of the classifier is just the data that we are placing on the local memory and fits in the 64KB of the GPU L3 cache. Thus, since the Desktop has a higher effective bandwidth when accessing the data in the local memory, the local memory optimization reduces execution time. However, in the Ultrabook the bandwidth is similar and the use of local memory introduces some copying overheads. Using local memory for the code running on the CPU introduces some extra copying overhead. While this overhead is not visible for filter because of the small size of the filter coefficients data structure, it adds a significant overhead to the classifier kernel, due to the larger size of the data structure allocated in local memory. 3.4.2. Loop Unrolling and Branch Overhead. Unrolling results in a significant performance improvement in both kernels, classifier and filter, for both the CPU and GPU. In the CPU unrolling decreases loop overhead and increases Instruction Level Parallelism. In the GPU, unrolling reduces the number of branches. Branches on the GPU can have a significant impact on performance, specially in the case of divergent branches where work-items (threads) of a CU take different paths, and each branch path has to be serialized. On the other side, non-divergent branches, where all the work-items follow the same path, are usually fast. To assess the impact of non-divergent branches on the Ivy Bridge integrated GPU, we modified the filter kernel, and replaced the “if ” condition that finds the maximum filter response with additions that sum the filter responses (notice that this branch, although data dependent, is mostly non-divergent, as work-items execute on neighboring pixels that tend to be similar and hence the maximum response filter is mostly the same for all the work-items). This change made this code run 13% faster on the integrated GPU. We also ran both codes (with and without the “if ” statements) on the Fermi Nvidia GPU and found that the code without the branches had only 3% improvement. In addition, we used the “branch overhead” benchmark of uCLbench package [Thoman et al. 2011] to assess the difference in performance between divergent and non-divergent branches. In this benchmark, different cases of branch divergence are compared. For example, a branch might be taken by all the work-items, a subset of them or only one. The experimental results show that the Ivy Bridge’s integrated GPU is performing much better for non-divergent branches, as benchmarks can be up to 10 times slower on the Ivy Bridge’s integrated GPU when branches are divergent. Overall, our experiments show that non-divergent branches have a higher effect on the Ivy Bridge GPU than on a Fermi GPU. Thus, loop unrolling (that removes non-divergent branches) is an important optimization for this platform. Other nonACM Transactions on Architecture and Code Optimization, Vol. V, No. N, Article A, Publication date: January YYYY.
A:11
divergent branches, such as the “if ” associated with the max operator cannot be removed with loop unrolling, and would benefit from a better hardware support for nondivergent branches. 3.4.3. Vectorization. Vectorization speeds up both the codes for the CPU, as it makes it easier for the compiler to generate code using the AVX vector extensions in the Ivy Bridge. When running on the GPU, classifier is about 2.8 times faster with vectorization, despite the fact that vector units need to be emulated on the GPU, which might have some overheads. One reason is that the vector code has more unrolling on the GPU implicitly. Thus, to assess the effect of further unrolling, we unrolled the nonvectorized code’s outer loop as much as it is beneficial (and “jam” it into the inner loop, which is already unrolled). This code runs faster, but still 1.8 times slower than the SIMD version. The other reason for the difference in performance is found by looking at the code generated by the compiler for both versions (with and without SIMD). For the code with SIMD, the compiler generates different memory load instructions with better alignment, which is important for performance. As mentioned, filter kernel runs only slightly (13%) faster on the GPU when vectorization is applied. 4. COMPARISON WITH OTHER PROGRAMMING PARADIGMS
In this section, we assess if OpenCL is a suitable paradigm for the CPU, since it is desirable to have a single programming paradigm for both types of devices. For that, we compare the programming effort and execution times of the OpenCL filter code versus implementations of the same code written with other programming models for the CPU. Filter code is chosen for the comparison because it is a compute intensive kernel, based on a convolution operation used by many computer vision applications. We run the experiments of this section on the Desktop’s CPU, since it is more powerful and will reflect the effects better. In addition, the Ultrabook’s CPU does not support SSE vector instructions. Note that for all the experiments we use 4 byte “float” precision numbers (which are enough for the filter kernel). 4.1. OpenMP with Compiler Vectorization
Since OpenMP is well suited to exploit data parallel computation in multicores, we compare the OpenCL code with an OpenMP implementation. Although one could expect perfect speedups, our results show an overhead of 8% with respect to perfect scaling. This is due to the overhead of spawning and joining threads for every loop invocation on a different image. To exploit the machine’s potential, we need to exploit the CPU’s vector units. The simplest way is to have the compiler do this task. The Intel compiler that we use (Section 2.5) can vectorize this code, but needs the “/fp:fast” flag, to enable optimizations that can cause minor precision loss in vectorization of reductions. In addition, by looking at the assembly code, we realized that it did not generate aligned loads, which was fixed by using Intel compiler intrinsic function ( assume aligned()). Furthermore, with the hope that the compiler would generate better code, we generate another code version where we applied, at the source level, the transformation we applied to vectorize the OpenCL filter kernel (Section 3.1). 4.2. OpenMP with Manual Vectorization
We vectorized the code manually using vector intrinsics that map directly to assembly instructions. A disadvantage of this approach is that the code is not portable as it is tied to a specific machine’s instruction set and a compiler. Furthermore, it is close to ACM Transactions on Architecture and Code Optimization, Vol. V, No. N, Article A, Publication date: January YYYY.
A:12
the assembly level and hence, the programming effort including code readability and debugging will suffer. Nonetheless, if the performance difference can be very high, one might prefer paying the cost. We wrote three versions: using AVX and SSE, using only SSE and using only AVX. 4.2.1. AVX+SSE. The Ivy Bridge architecture supports the AVX and SSE instruction sets. AVX instructions can work on eight floating point elements, while SSE ones can only handle four elements. We use SSE, since AVX does not have an instruction equivalent to SSE’s “ mm comigt ss” (that compares two values and returns a 1 or a 0 depending on which one is larger), which simplifies the coding. Thus, we use AVX for multiply and add operations and SSE for conditional comparisons. Note that mixing AVX and SSE instructions can have significant translation penalties on Ivy Bridge [avx 2011]. However, we use “/Qxavx” flag to ask the compiler to generate AVX counterparts whenever possible. In addition, we use Intel vTune Amplifier to make sure these penalties are avoided. Since this kernel needs to find which filter resulted in the maximum response value, we compare the max response against each response value. A sample comparison is shown below, where we permute the result vector and compare the lowest index element using the “ mm comigt ss” intrinsic. __m128 p_tmp = _mm_extract_ps ( response1 , 0 x1 ); if ( _mm_comigt_ss ( p_tmp , max_response )) { max_response = ptmp ; best_filter = filter_ind +1; }
Note that we provide code snippets to be able to compare the complexity of different methods. We refer the interested reader to Intel’s documentations to fully understand the details. 4.2.2. SSE. We implemented an SSE version to evaluate AVX versus SSE and measure the effect on performance of SIMD width. 4.2.3. AVX. We also implemented a version that only uses AVX instructions. The implementation compares all the responses in parallel, gathers the sign bits in an integer mask and examines each bit separately. If the maximum response needs to be updated, we use a permutation instruction to broadcast the new maximum to the register, repeat the comparison and update the integer mask. There is a small complication because of “ mm256 permute ps” instruction’s semantics. Since it can only choose from each four element half of the register separately, we need to consider each half of the responses separately and copy it to the other one. Thus, the initialization code for comparing four elements of responses is shown below: // low 128 half // copy low to high __m256 response1 = _mm256_insertf128_ps ( response , _mm 256_ extra ctf1 28_ps ( response , 0) , 1); __m256 cpm = _mm256_cmp_ps ( response , max_response , _CMP_GT_OS ); int r = _mm256_movemask_ps ( cpm );
After that, we will have four tests of the mask with possible updates similar to the one below: if ( r &(1 <