Fast and Robust Bootstrap. 3. â numerical instability: the simulated bootstrap distribution may be severely affected by bootstrap samples with a higher proportion ...
Statistical Methods and Applications manuscript No. (will be inserted by the editor)
Fast and Robust Bootstrap Mat´ıas Salibi´ an-Barrera1 , Stefan Van Aelst2? , Gert Willems2 1
University of British Columbia, Dept. of Statistics, Vancouver, Canada.
2
Ghent University - UGent, Dept. of Applied Mathematics and Computer Science, Gent, Belgium.
Received: date
Abstract
In this paper we review recent developments on a bootstrap method for robust estimators
which is computationally faster and more resistant to outliers than the classical bootstrap. This fast and robust bootstrap method is, under reasonable regularity conditions, asymptotically consistent. We describe the method in general and then consider its application to perform inference based on robust estimators for the linear regression and multivariate location-scatter models. In particular, we study confidence and prediction intervals and tests of hypotheses for linear regression models, inference for location-scatter parameters and principal components, and classification error estimation for discriminant analysis.
Key words
?
Robust inference, bootstrap, multivariate models
The research of Stefan Van Aelst was supported by a grant of the Fund for Scientific Research-Flanders
(FWO-Vlaanderen).
2
Mat´ıas Salibi´ an-Barrera et al.
1 Introduction
Inference based on robust estimators for linear regression or multivariate location-scatter models is generally based on the asymptotic distribution of these estimators. These asymptotic distributions have, until recently, been studied mainly under the assumption that the distribution of the data is symmetric or elliptical. For inference purposes one can, for example, use the normal approximation and an estimate of the appropriate asymptotic variance-covariance matrix. Unfortunately, these assumptions (symmetric errors for the linear regression model, or elliptical distributions for multivariate observations) do not hold in most practical situations when robust methods would be recommended, i.e. when outliers may be present in the data. If one relaxes the assumption on symmetric or elliptical distributions, the calculation of the asymptotic distribution of robust estimators becomes involved (for example, for the linear regression case see Carroll, 1978, 1979; Huber, 1981; Rocke and Downs, 1981; Carroll and Welsh, 1988; Salibian-Barrera, 2000; and Croux et al., 2003). An alternative approach to perform inference based on robust estimators is given by the bootstrap (Efron 1979) which does not generally require stringent distributional assumptions. In most practical cases the bootstrap is based on simulating the distribution of the estimator of interest by generating a large number of new samples randomly drawn from the original data. The estimator is recalculated in each of these “bootstrap samples”, and the empirical distribution of these “bootstrapped estimates” yields an approximation to the estimator’s true sampling distribution. This method has been extensively studied for diverse models. However, two main problems arise when we want to use the bootstrap to estimate the sampling distribution of robust estimators:
Fast and Robust Bootstrap
3
– numerical instability: the simulated bootstrap distribution may be severely affected by bootstrap samples with a higher proportion of outliers than in the original data set; and – computational cost: due to the non-convex optimization problems that generally have to be solved in order to calculate robust estimates, it may not be feasible to re-compute these estimators a few thousand times.
Intuitively, the reason for the numerical instability mentioned above is as follows. Since outlying and non-outlying observations have the same chance of belonging to any bootstrap sample, with a certain positive probability, the proportion of outliers in a bootstrap sample may be larger than the fraction of contamination that the robust estimator can tolerate. In other words, a certain proportion of the recalculated values of the robust estimate may be heavily influenced by the outliers in the data. Thus, the tails of the bootstrap distribution can be heavily influenced by the outliers, regardless of the robustness of the statistic being bootstrapped. Stromberg (1997) and Singh (1998) quantified this problem in the context of robust location estimation. The former pointed out that the usual bootstrap estimates for standard errors or covariances have a breakdown point converging to 1/n (with n the sample size) when the number of bootstrap samples increases. This holds independently of the breakdown point of the bootstrapped estimate. Singh (1998) investigated the estimates of the quantiles of the asymptotic distribution of univariate location estimates. He defined the breakdown point for bootstrap quantiles and showed that it is disappointingly low, although not as low as that of the bootstrap estimator of standard errors. He proposed to draw the bootstrap samples from Winsorized observations and showed that the quantile estimates obtained with this method have the highest attainable breakdown point and that they converge to the quantiles of the asymptotic distribution of the estimate. However, for higher dimensional models (as linear regression), this approach may still be computationally too costly, as it needs to fully re-compute the robust estimators on the bootstrap samples.
4
Mat´ıas Salibi´ an-Barrera et al.
The computation of robust estimates is generally not trivial since it typically requires solving a non-convex minimization problem in multiple dimensions. Moreover, the objective function of this optimization problem is often defined implicitly. The number of bootstrap samples needed to obtain reliable distribution estimates naturally grows with the dimension of the statistic, which makes the problem computationally even more expensive to solve. This large number of non-linear optimization problems may render the method unfeasible for high dimensional problems. As an illustration of the computational cost that can be expected, the evaluation of 5000 bootstrap recalculations of a 50% breakdown point and 95% efficient MM-regression estimator on a simulated data set with 2000 observations and 10 explanatory variables took about 2 CPU hours on an IBM PC 3.1GHz with 1GB of RAM. The computations where carried out in R using the robustbase library (available at the CRAN website http://cran.r-project.org). Note that this implementation of MM-regression estimators includes the fast-S algorithm (Salibian-Barrera and Yohai 2006) for the initial S-estimator. Recently, Salibian-Barrera and Zamar (2002) introduced a new bootstrap method for robust estimators which has the advantage of being at the same time easy to compute and resistant to outliers in the sample (in other words, it can overcome the two problems mentioned above). The method can in principle be used for any estimator that can be written as the solution of a system of smooth fixedpoint equations. Examples of well-known robust estimators that fulfill this condition are S-estimators (Rousseeuw and Yohai 1984; Davies 1987), MM-estimators (Yohai 1987; Tatsuoka and Tyler 2000) and τ -estimators (Yohai and Zamar 1988; Lopuha¨a 1992). In what follows we describe the method in general. Its application to linear regression and multivariate ˆ n ∈ Rm models are discussed in detail in Sections 2 and 3, respectively. Consider a sample Zn and let θ ˆ n may include estimates for the regression coefficients be the robust parameter estimates of interest (θ and scale in the linear model, or for the location and scatter matrix in the multivariate model). Suppose
Fast and Robust Bootstrap
5
ˆ n can be represented as a solution of fixed-point equations: now that θ
ˆ n = gn (θ ˆ n ), θ
(1)
where the function gn : Rm → Rm generally depends on the sample Zn . Given a bootstrap sample Zn∗ , ˆ ∗ then solves the recalculated estimate θ n ˆ ∗ = g∗ (θ ˆ∗ θ n n n ),
(2)
ˆ ∗ for every bootstrap where the function gn∗ now depends on Zn∗ . As explained above, computing θ n sample Zn∗ can be a computationally expensive task for robust estimates such as S- or MM-estimates. Moreover, even though we may assume that the solution to (1) was resistant to outliers in Zn , this does not guarantee that we will obtain an equally resistant solution to (2) as gn∗ is potentially more severely affected by outliers than gn is. ˆ ∗ , however, we can compute the approximation Instead of computing θ n ˆ 1∗ := g∗ (θ ˆ θ n n n)
(3)
ˆ ∗ with initial value θ ˆ n . It can be shown that, under which can be viewed as one-step estimation of θ n ˆ ∗ consistently estimates the sampling distribution of θ ˆ n . It is certain conditions, the distribution of θ n ˆ 1∗ may not have this property in general. Indeed, intuitively clear, however, that the distribution of θ n ˆ 1∗ typically underestimate the actual variability of θ ˆ n , mainly because every bootstrap the recalculated θ n sample uses the same initial value in the one-step approximation. To remedy this, a linear correction ˆ n ’s can be applied as follows. Using the smoothness of gn , we can calculate a Taylor expansion about θ limiting value θ, ˆ n = gn (θ) + ∇gn (θ)(θ ˆ n − θ) + Rn , θ
(4)
6
Mat´ıas Salibi´ an-Barrera et al.
where Rn is the remainder term and ∇gn (.) ∈ Rm×m is the matrix of partial derivatives. When the remainder term is negligible (Rn = op (1)), equation (4) can be rewritten as √
.
ˆ n − θ) ∼ [I − ∇gn (θ)]−1 n(θ
√
n(gn (θ) − θ) ,
.
where ∼ denotes that both sides have the same limiting distribution. Under certain conditions we will have that
√
√ . √ ˆ . √ ˆ∗ − θ ˆn) ∼ ˆn) − θ ˆ n ). If we furthermore n(θ n(θ n − θ) and n(gn∗ (θ) − θ) ∼ n(gn (θ n
ˆ n )]−1 we obtain approximate [I − ∇gn (θ)]−1 by [I − ∇gn (θ √
√ . ˆ∗ − θ ˆn) ∼ ˆ n )]−1 n(g∗ (θ ˆ ˆ n(θ [I − ∇gn (θ n n n ) − θ n ).
(5)
Define then the linearly corrected version of the one-step approximation (3) as ˆ R∗ := θ ˆ n + [I − ∇gn (θ ˆ n )]−1 (θ ˆ 1∗ − θ ˆ n ). θ n n
(6)
ˆ R∗ will be estimating the same limiting distribution as the actual bootstrap When (5) indeed holds, θ n ˆ ∗ do. For the case of S- and MM-estimates for regression and multivariate location and calculations θ n scatter, formal consistency proofs under relatively mild conditions have been given in Salibian-Barrera (2000), Salibian-Barrera and Zamar (2002) and Salibian-Barrera et al. (2006). ˆ R∗ is not only much easier It will become clear from the applications in the next sections that θ n ˆ ∗ , but also more numerically stable (more robust). Following Salibian-Barrera and to compute than θ n Zamar (2002), we will therefore refer to the resulting inference method as the Fast and Robust Bootstrap (FRB). Section 2 will consider the FRB in the linear regression setting, for which it was originally introduced. We will review the general results for standard errors and confidence intervals of the regression parameters, and we will discuss Salibian-Barrera’s (2005) adaptation that can be used to estimate p-values for hypothesis tests in the linear model. Additionally, we consider the potential of the method for obtaining
Fast and Robust Bootstrap
7
robust prediction intervals. Section 3 then focuses on applications of the FRB in multivariate methods. First we review how the method was used in the context of robust principal components analysis (PCA) in Salibian-Barrera et al. (2006). Next we reconsider its use for inference purposes in robust multivariate regression as described in Van Aelst and Willems (2005). Finally, we propose the application of the bootstrap method as a means of estimating the classification error in robust discriminant analysis. Section 4 illustrates the FRB method on two real-data examples, while Section 5 concludes.
2 Robust regression
Let Zn = {(y1 , zt1 )t , . . . , (yn , ztn )t } be a sample of independent random vectors where xi = (1, zti )t ∈ Rp . We will assume that they follow the linear regression model yi = xti β 0 + σ0 εi ,
i = 1, . . . , n ,
(7)
where the vector of regression coefficients β 0 is the parameter of interest. Ideally, one would like to assume that yi and zi are independent, with joint distribution function Hc (y, z) = Fc (y) Gc (z), where Fc is a particular symmetric distribution (typically the standard normal distribution). However, to allow for the occurrence of outliers and other departures from the classical model we will only assume that the distribution H of the vectors (yi , zti )t belongs to the contamination neighbourhood H² = {H = (1 − ²)Hc + ²H ∗ }
(8)
where 0 ≤ ² < 1/2, and H ∗ is an arbitrary and unspecified distribution. In the rest of this section we will focus on MM-regression estimators (Yohai 1987). However, all results are valid as well for S-estimators (Rousseeuw and Yohai 1984), since these can be seen as a special case of MM-estimators. In addition, similar results can be derived for other estimators that can
8
Mat´ıas Salibi´ an-Barrera et al.
be represented by a smooth fixed-point equation like (1), for example: τ -estimators (Yohai and Zamar 1988) or GM-estimates (e.g. Krasker and Welsch 1982). MM-estimates are based on two loss functions ρ0 : R → R+ and ρ1 : R → R+ which determine the breakdown point and the efficiency of the estimate, respectively. More precisely, assume that ρ0 and ρ1 satisfy: (R1) ρ is symmetric, twice continuously differentiable and ρ(0) = 0, (R2) ρ is strictly increasing on [0, c] and constant on [c, ∞) for some finite constant c. ˆ satisfies The MM-estimate β n n
1X 0 ρ n i=1 1
Ã
ˆ yi − xti β n σ ˆn
! xi = 0 ,
(9)
where σ ˆn is a scale S-estimate. That is, σ ˆn minimizes the M-scale σ ˆn (β) implicitly defined by the equation n
1X ρ0 n i=1
µ
yi − xti β σ ˆn (β)
¶ = b.
(10)
˜ be the S-regression estimate defined by For future reference, let β n ˜ = arg min σ β ˆn (β) . n p β∈R
˜ also satisfies It is easy to see that β n n
1X 0 ρ n i=1 0
Ã
˜n yi − xti β σ ˆn
! xi = 0 ,
(11)
In order for σ ˆn to be consistent under the central model we set EFc [ρ0 (u)] = b. The breakdown point of the S-estimator is min(b/ρ0 (∞), 1 − b/ρ0 (∞)), and thus we normally choose ρ0 so that b = ρ0 (∞)/2. ˆ inherits the breakdown point of the initial S-estimator, while its efficiency at The MM-estimator β n the central model depends only on ρ1 . In this way these estimators, unlike the S-estimators, are able to achieve simultaneous high-breakdown point and high efficiency at the central model.
Fast and Robust Bootstrap
9
Under the assumption that the data follow the central model in (8) the asymptotic distribution of MM-estimates for random and fixed designs has been studied by Yohai (1987) and Salibian-Barrera (2006a), respectively. However this assumption does not hold in typical situations when one wishes to ˆ under use highly robust MM-estimates. The FRB yields a consistent estimate for the covariance of β n rather general conditions, including the case H ∈ H² . A widely used family of functions ρ that satisfy (R1) and (R2) above was proposed by Beaton and Tukey (1974) and is commonly referred to as Tukey’s Biweight family:
ρ (u) =
3 ( u/ d)2 − 3 ( u/ d)4 + ( u/ d)6 if |u| ≤ d 1
(12)
if |u| > d,
where d > 0 is a fixed constant. An alternative is provided by Yohai and Zamar (1998), whose Optimal weight functions minimize the maximum asymptotic bias of the MM-estimates for a fixed Gaussian efficiency.
2.1 Standard errors and confidence intervals
In this section we will consider constructing confidence intervals for the regression coefficients based on MM-regression estimators. We identify two different ways to construct confidence intervals based on MM-estimators: (i) using the fact that MM-estimators are asymptotically normally distributed, we can √ ˆ ± zα/2 σ build a (1 − α)% confidence interval for the j-th regression coefficient β 0,j of the form β ˆj / n, n,j ˆ ˆ where zα/2 is the standard normal quantile, β ˆj is an estimate of n,j is the j-th coordinate of β n , and σ ˆ . its asymptotic standard error; and (ii) we can use the quantiles of the estimated distribution of β n,j ˆ . Since for these We can use the bootstrap to either obtain σ ˆj or an estimate of the distribution of β n,j ˆ cannot be computed in closed form, we use the computer to estimators the bootstrap distribution of β n
10
Mat´ıas Salibi´ an-Barrera et al.
simulate it in the usual way. The rest of this section describes how to use the FRB in this context to solve the problems mentioned in Section 1. ˆ denotes the MM-regression estimate, σ ˜ the S-regression estimate. Recall that β ˆn is the S-scale and β n n ˆ depends on that of the scale estimator σ ˆn (Carroll 1978, Since in general the asymptotic behaviour of β n 1979; Carroll and Welsh 1988; Salibian-Barrera 2000; and Croux et al. 2003) we need to consider all the ˆ and σ equations for β ˆn when bootstrapping these estimators. n t ˆ ˆ and β ˜ : ri = yi − xt β For each pair (yi , xti ) , i = 1, . . . , n, define the residuals associated with β n n i n
˜ , respectively. Note that β ˆ ,σ ˜ and r˜i = yi − xti β n n ˆn and β n can be formally represented as the result of a weighted least squares fit. For i = 1, . . . , n define the weights ωi , vi and ω ˜ i as
ωi = ρ01 ( ri / σ ˆn )/ ri , vi =
σ ˆn ρ0 ( r˜i / σ ˆn )/ r˜i , nb
(13)
ˆn )/ r˜i . ω ˜ i = ρ00 ( r˜i / σ
Simple computations yield the following representation of equations (9), (10) and (11):
ˆ = β n σ ˆn =
à n X
!−1 ωi xi xti
ωi xi yi ,
˜ ), vi (yi − xti β n
à n X i=1
(14)
i=1
i=1 n X i=1
˜ = β n
n X
!−1 ω ˜ i xi xti
n X
(15)
ω ˜ i xi yi .
(16)
i=1
˜t t ˆ n =(β ˆt , σ Hence, by setting θ n ˆn , β n ) , MM-estimates can be written in the general form given by (1).
Fast and Robust Bootstrap
11
t ∗ ∗t t Let Zn∗ = {(y1∗ , z∗t 1 ) , . . . , (yn , zn ) } be a bootstrap sample from the observations. The corresponding 1∗ ˜ 1∗ ˆ 1∗ , σ one-step estimates β n ˆn and β n as defined by (3) are obtained as follows:
à ˆ 1∗ β n
=
σ ˆn1∗ =
!−1 ωi∗ x∗i x∗t i
i=1 n X vi∗ i=1
à ˜ 1∗ β n
n X
=
n X
n X
ωi∗ x∗i yi∗ ,
(17)
i=1
˜ (yi∗ − x∗t i βn )
ω ˜ i∗
!−1 x∗i
x∗t i
i=1
(18) n X
ω ˜ i∗ x∗i yi∗ ,
(19)
i=1
ˆ where ωi∗ = ρ01 ( ri∗ / σ ˆn )/ ri∗ , vi∗ = σ ˆn ρ0 ( r˜i∗ / σ ˆn )/ (n b r˜i∗ ), ω ˜ i∗ = ρ00 ( r˜i∗ / σ ˆn )/ r˜i∗ , ri∗ = yi∗ − x∗t i β n , and ˜ ˆ r˜i∗ = yi∗ − x∗t i β n for 1 ≤ i ≤ n. The FRB recalculations for the MM-regression coefficients β n , as defined by (6), are then given by ¡ 1∗ ¢ ˆ R∗ = β ˆ + Mn (β ˆ 1∗ − β ˆ ) + dn σ ˜ 1∗ − β ˜ ), f n (β β ˆn − σ ˆn + M n n n n n n
(20)
where Mn = σ ˆn
à n X
!−1 ρ001
( ri / σ ˆn , xi ) xi xti
i=1
à dn = an =
a−1 n 11 nb
n X
!−1 ρ001
( ri / σ ˆn , xi ) xi xti
i=1 n X
[ρ00 ( r˜i / σ ˆn ) r˜i / σ ˆn ] .
n X
fn = 0 , ωi xi xti , M
(21)
ρ001 ( ri / σ ˆn , xi ) ri xi ,
(22)
i=1 n X i=1
(23)
i=1
˜ through (19) when we are only f n = 0, in practice we do not need to recalculate β Note that since M n ˆ . interested in doing inference based on β n ˆ R∗ values then provides the standard error estimate σ The empirical standard deviation of the β ˆj , n,j ˆ ’s sampling distribution. The number of whereas their empirical quantiles estimate the quantiles of β n,j bootstrap recalculations required for accurate estimates is similar as in classical bootstrap. Typically, a few hundreds suffices for standard error estimates, while at least a thousand is often recommended
12
Mat´ıas Salibi´ an-Barrera et al.
for quantile estimates. The number of samples should be increased with the dimension of the problem, however, when interested in simultaneous inference for the different parameters. Note the computational ease and stability of the FRB estimates in (20): – computational cost: for each bootstrap sample, instead of solving the non-linear system of equations ˆ R∗ we only need to solve the linear system of equations corresponding to (9) to (11), to compute β n (17) and calculate the weighted average (18). The correction factors Mn , dn and an arise from two linear systems and a weighted average respectively and are computed only once with the full sample. – numerical stability: the FRB method is effectively as stable as the estimator itself. If the MMestimator was able to resist the outlying observations, then the latter are associated with large residuals (ri and r˜i ) and thus small or even zero weights in (14)-(16). Indeed, if ρ0 and ρ1 satisfy (R1) and (R2), we have ρ01 (t)/t −→ 0, |t|→∞
ρ0 (t)/t −→ 0 |t|→∞
and
ρ00 (t)/t −→ 0 . |t|→∞
The outliers take along their small weights into the one-step bootstrap approximations of (17)-(19). Hence, the influence of harmful outlying observations is limited, regardless of the number in which they appear in the bootstrap sample. The linear correction factors, finally, do not depend on the bootstrap sample and will not break down if the original MM-estimates did not break down. The analysis above on computational ease and numerical stability can similarly be applied to other applications of the FRB, such as the multivariate models discussed in Section 3.
2.1.1 Consistency of the fast and robust bootstrap
The next theorem (proved in Salibian-Barrera and
Zamar (2002)) shows that, under certain regularity conditions, if the S- and MM-estimators are consistent, then the asymptotic distribution of the FRB coincides with that of the MM-regression estimator. Sufficient conditions for the S-estimator to be consistent and asymptotically normally distributed are
Fast and Robust Bootstrap
13
given in Davies (1990), while MM-estimators were studied by Yohai (1987), Salibian-Barrera (2000) and Salibian-Barrera (2006a). See also Omelka and Salibian-Barrera (2006) for verifiable regularity conditions to obtain consistency and asymptotic normality for S- and MM-regression estimators uniformly over sets of distributions of the form (8).
Theorem 1 (Salibian-Barrera and Zamar 2002) - Let ρ0 and ρ1 satisfy (R1) and (R2) with continˆ be the MM-regression estimator, σ ˜ the associated uous third derivatives. Let β ˆn the S-scale and β n n P ˜ P P ˜ − ˆ − S-regression estimator and assume that β ˆn − → σ and β n → β. Then, under certain regularity n → β, σ
conditions, along almost all sample sequences, the same limit distribution as
√
√
ˆ R∗ − β ˆ ) converges weakly, as n goes to infinity, to n (β n n
ˆ − β). n (β n
2.1.2 Robustness of confidence intervals
Confidence intervals for the regression parameters can be based
on the quantiles of the bootstrap distribution estimate. It is clear from the discussion above that the FRB method will yield estimates of the distribution quantiles that are more reliable (less affected by outliers) than those of the classical bootstrap. In this section we give a formal result for the breakdown point of the quantile estimates of the FRB. Following Singh (1998) we define the upper breakdown point of a quantile estimate qˆt as the minimum proportion of asymmetric contamination that can drive it over any finite bound. There are two closely related scenarios in which the bootstrap quantile estimates can break down. The first unfavourable situation is when the proportion of outliers in the original data is larger than the breakdown point of the estimate. In this case the estimate may already be unreliable, and so can be the inferences derived from it. The second case is related to the number of outliers appearing in the bootstrap samples. If we let τ ∗ denote the expected proportion of bootstrap samples that contain more outliers than the breakdown point of the estimate, then the estimate qˆt may be severely affected by the outliers when τ ∗ > t. The
14
Mat´ıas Salibi´ an-Barrera et al.
next theorem shows that the FRB is not affected as severely as the classical bootstrap by the second scenario. Note that the breakdown point of the FRB quantile estimates can be affected by the geometric characteristics of a sample in the same way as the breakdown point of robust regression estimates. Recall that k points in Rp are said to be in general position if no subset of size p + 1 of them determines an affine subspace of dimension p (Rousseeuw and Leroy 1987). The breakdown point of the quantile estimates based on the FRB when the sample is in general position are given by the following theorem. Theorem 2 (Salibian-Barrera and Zamar 2002) Assume that the sample (x1 , . . . , xn ) is in general posiˆ be an MM-regression estimate with breakdown point ²∗ . The breakdown point of the FRB tion, and let β n ˆ , j = 1, . . . , p is given by min (²∗ , ²t estimate for the t-th quantile of the sampling distribution of β nj F RB ), where ²tF RB satisfies ²tF RB = inf {δ ∈ [0, 1] : P [ Binomial (n, δ) ≥ n − p ] ≥ t } .
(24)
Singh (1998) showed that the upper breakdown point ²tC of the bootstrap estimate qˆt of qt satisfies ²tC = inf {δ ∈ [0, 1] : P [ Binomial (n, δ) ≥ [²∗ n] ] ≥ t} ,
(25)
where [x] denotes the smallest integer larger or equal to x. Since [²∗ n] ≤ [ n/ 2] < n − p for n > 2 p, we immediately see from (24) and (25) that ²tC < ²tF RB and thus that the FRB quantile estimators are more robust than those based on the classical bootstrap. A comparison of ²tC and ²tF RB for different values of t, sample sizes (n) and number of covariates (p) can be found in Table 1.
2.2 Hypothesis tests In this section we show how to use the FRB to estimate the distribution of robust test statistics for the linear regression model. Following Salibian-Barrera (2005) we will focus on scores-type tests (Markatou
Fast and Robust Bootstrap
15
Table 1 Comparison of quantile upper breakdown points for MM-regression estimates with 50% breakdown point and 95% efficiency at the central model.
FR Bootstrap p
Classical Bootstrap
n qˆ0.005 qˆ0.025 qˆ0.05 qˆ0.005 qˆ0.025
qˆ0.05
10 0.456 0.500 0.500 0.128 0.187 0.222 2 20 0.500 0.500 0.500 0.217 0.272 0.302 30 0.500 0.500 0.500 0.265 0.313 0.339 10 0.191 0.262 0.304 0.011 0.025 0.036 5 20 0.500 0.500 0.500 0.114 0.154 0.177 30 0.500 0.500 0.500 0.185 0.226 0.249 100 0.500 0.500 0.500 0.368 0.398 0.414 20 0.257 0.315 0.347 0.005 0.012 0.018 10 50 0.500 0.500 0.500 0.180 0.212 0.230 100 0.500 0.500 0.500 0.294 0.322 0.336
et al. 1991), although the same approach can be used with other tests (e.g. robust dispersion and Wald type tests). The finite-sample distribution of these test statistics is generally unknown and their p-values are approximated using their asymptotic distribution. As in the case of linear regression estimators, the asymptotic distribution of robust tests has been studied under the restrictive assumption that the scale of the errors is known or that it can be estimated without affecting the asymptotic behavior of the test statistic. This is generally only true when the errors have a symmetric distribution. In the rest of this section we describe how to use the FRB to estimate the p-values of scores-type tests for the linear regression model (7). Partition the vector of parameters β 0 = (β t0,1 , β t0,2 )t where β 0,2 ∈ Rq , q < p.
16
Mat´ıas Salibi´ an-Barrera et al.
Without loss of generality assume that the covariates have been re-arranged so that the hypotheses to be tested are H0 : β 0,2 = 0
versus
Ha : β 0,2 6= 0 .
(26)
ˆ (0) ∈ Rp−q and β ˆ (a) ∈ Rp be the robust In a similar way, write xi = (xti (1) , xti (2) )t where xi (2) ∈ Rq . Let β n n (0)
estimates under H0 and Ha . Correspondingly, let ri (a)
ri
(a)
ˆ , = yi − xti β n
(a)
and ri (0)
ri
be the associated residuals: (0)
ˆ , = yi − xti (1) β n
(a)
for i = 1, . . . , n. Also, let σ ˆn be the scale estimate calculated under Ha . Scores-type tests (Markatou et al. 1991) are defined as follows: t ˆ −1 Wn2 = n−1 [Σ (0) [Σ (0) n ] U n ],
with Σ (0) n =
n X
ˆ (0) )/ˆ ρ01 ((yi − xti (1) β σn(a) ) xi (2) , n
i=1
and ˆ =Q ˆ 22 − M ˆ 21 M ˆ −1 Q ˆ 12 − Q ˆ 21 M ˆ −1 M ˆ 12 + M ˆ 21 M ˆ −1 Q ˆ 11 M ˆ −1 M ˆ 12 , U 11 11 11 11 ˆ and Q ˆ are the empirical estimates of where M
M11 M12 , M = E[ρ001 (r) xxt ] = M21 M22 and
Q11 Q12 , Q = E[ρ01 (r)2 xxt ] = Q21 Q22 respectively. ˆ (0) is expected to approximately solve the score equations (even the part involving the Under H0 , β n xi (2) ’s). Hence, in this case Wn2 will tend to be small and large values of Wn2 indicate evidence against H0 .
Fast and Robust Bootstrap
17
When the errors have a symmetric distribution around zero, Wn2 has, under H0 , an asymptotic χ2 distribution with q degrees of freedom (Markatou et al. 1991). It is easy to see (Salibian-Barrera 2005) that when the errors are not symmetrically distributed (due to the presence of outliers or other forms of contamination) Wn2 may have a different asymptotic distribution. We propose to use the FRB to estimate this distribution. When bootstrapping tests it is important that the bootstrap re-sampling scheme resembles the null hypothesis H0 (even when the data actually follow the alternative hypothesis Ha , see Fisher and Hall (1990) and Hall and Wilson (1991)). In other words, to properly simulate the null distribution of the test statistics we have to draw bootstrap samples from data that follow H0 . One way to do this in the context of non-parametric bootstrap for linear regression is to create a data set with this property by adding the residuals obtained under Ha to the fitted values obtained under H0 . Furthermore, to construct bootstrap samples following H0 we add a bootstrap sample of the residuals obtained under Ha to the fitted values computed under H0 . These bootstrapped data will follow the null model when the original sample follows either H0 or Ha . Since the robust scores-type statistics are of the form (0)
(a)
ˆ ,β ˆ ) Wn2 = Wn2 (y1 , . . . , yn , x1 , . . . , xn , β n n ˆ (0) and β ˆ (a) . The following “null data” follow H0 : we need to estimate the null distribution of (yi , xi ), β n n ˆ (0) + r(a) , y˜i = xti β n i
(27)
for i = 1, . . . , n. Note that these “null data” satisfy H0 approximately by construction even when the original data (yi , xi ), i = 1, . . . , n follow Ha . ˆ ’s we first calculate the robust estimates under the In order to use the FRB to re-calculate the β n restricted and full models with the complete “null” data set, that is with (˜ yi , xi ), where y˜i is given by (27).
18
Mat´ıas Salibi´ an-Barrera et al.
¨ (0) and β ¨ (a) be the MM-regression estimates calculated under H0 and Ha respectively. Similarly, Let β n n (a)
σ ¨n
∗ (a)
denotes the scale estimate calculated under the full model on the “null data”. Let r1 (a)
∗ (a)
, . . . , rn
(a)
be a bootstrap sample from the residuals r1 , . . . , rn and construct the bootstrap observations (0)
∗ (a)
ˆ +r y˜i∗ = xti β n i
,
i = 1, . . . , n .
(a) ¨ (0) , β ¨ (a) and σ We can apply the FRB to β ¨n to obtain fast and robust bootstrap recalculations and n n
evaluate the test statistics with them. These values will be the bootstrap estimate of the sampling distribution of the test statistics. The consistency of the FRB under this re-sampling scheme (which is equivalent to bootstrapping linear regression estimators with fixed designs (Freedman 1981)) was studied in Salibian-Barrera (2006b). (0)
ˆ +r Let (˜ yi∗ , xi ) be a bootstrap sample where y˜i∗ = xti β n i
∗ (a)
¨ R∗ (0) and β ¨ R∗ (a) be the FRB . Let β n n
re-calculations under H0 and Ha respectively. The FRB re-calculated test statistic is ¨ R∗ (0) ) , ¨ R∗ (0) )t UR∗ −1 Σ R∗ (β Wn2 R∗ = n−1 Σ R∗ n n n (β n
with UR∗ the corresponding matrix, and
Σ R∗ n (β)
=
n X
± (a) ¨n ) xi (2) . yi∗ − β t xi ) σ ρ01 ( (˜
i=1
The FRB p-value estimate is © ª± pˆ = # Wn2 R∗ > Wn2 B ,
(28)
where B is the number of bootstrap samples used. In Salibian-Barrera (2005) it is shown that these bootstrap p-values maintain the nominal level even under the presence of contamination, and are equivalent to those obtained with the asymptotic χ2 approximation when the data do not contain outliers.
Fast and Robust Bootstrap
19
2.3 Mean response and prediction intervals
The bootstrap distribution obtained from the FRB estimates (20) can be used to construct confidence intervals for the mean response at a fixed x0 in the predictor space. Similarly as for confidence intervals of the regression parameters, there are two ways to construct such intervals based on the FRB estimates: (i) using the asymptotic normality of the MM-estimators, we can build a (1 − α)% confidence interval for q ˆ ± zα/2 xt Σx ˆ 0 , where Σ ˆ is a bootstrap estimate of the covariance matrix µ0 = xt0 β 0 of the form xt0 β n 0 ˆ ; and (ii) we can use the bootstrap to estimate the distribution of x0 β ˆ and use quantiles of this of β n n distribution estimate to construct confidence intervals. The consistency of the FRB for the MM-estimator of the regression parameters in Theorem 1 immediately implies consistency of the FRB at x0 under the same conditions, in the sense that the distribution limit distribution as
√
√
ˆ ˆ R∗ − xt β n(xt0 β n 0 n ) converges weakly to the same
ˆ − µ0 ). Moreover, for samples in general position the FRB estimates for n(xt0 β n
ˆ will have the breakdown point given by Theorem 2. A the quantiles of the sampling distribution of x0 β n q ˆ ±zα/2 xt Σx ˆ 0+σ prediction interval for the unobserved response y0 at x0 can be constructed as xt0 β ˆn n 0 where σ ˆn is the scale S-estimate as before. To investigate the performance of these confidence and prediction intervals we performed a short simulation study. We generated 5000 datasets of size n = 40, 100 and dimension p = 2, 5 (including the intercept). The explanatory variables were generated from the standard normal distribution N (0, 1). In the first simulation setting, the errors were generated according to (n − 2m) N (0, 1) + m N (−4, 0.12 ) + m N (4, 0.12 ) which means that (n − 2m) points are drawn from N (0, 1) and m points from each of the two contaminating distributions, leading to symmetrically distributed outliers. In the second simulation setting, the errors were generated according to (n − 2m) N (0, 1) + 2m N (4, 0.12 ) which produces asymmetric outliers. For both settings we considered m = 0, .05n and .10n corresponding to 0%, 10%, and 20% of contamination. 95% and 99% confidence and prediction intervals were constructed at x0 = (1, d)t
20
Mat´ıas Salibi´ an-Barrera et al.
Table 2 Coverage and length of 99% FRB based confidence and prediction intervals at x0 = (1, 0)t = and x0 = (1, 3)t . Samples of size n = 100 with 2m symmetrically distributed outliers in p = 5 dimensions for m = 0, 5 and 10. x0
(1, 0)t
(1, 3)t
m
FRB-quantile CI
FRB-SE CI
FRB Pred Int
0
0.985 (0.547)
0.986 (0.547)
0.987 (5.051)
5
0.992 (0.694)
0.993 (0.691)
0.994 (5.952)
10
0.999 (1.037)
0.999 (1.032)
0.999 (7.240)
0
0.987 (3.399)
0.985 (3.357)
0.985 (6.056)
5
0.990 (4.395)
0.987 (4.331)
0.993 (7.359)
10
0.991 (6.580)
0.994 (6.469)
0.998 (9.721)
with d = (d, . . . , d) ∈ Rp−1 for d = 0, 1, 2, 3. We used MM-estimators with ρ functions in Tukey’s Biweight family (12), tuned to have 50% breakdown point and 95% Gaussian efficiency. Since for n = 100 and p = 5, 20% of outliers in the original sample do not influence the classical bootstrap distribution estimator noticeably (e.g. the 0.5% quantile does not breakdown, as can be seen from Table 1), there will not yet be problems with numerical stability of the classical bootstrap, and hence the classical bootstrap here shows similar behavior as the FRB but needs much more time. For symmetrically distributed outliers, Table 2 shows the coverage level and average length of 99% confidence and prediction intervals at x0 = (1, 0)t = and x0 = (1, 3)t which are points in the center and at the border of the predictor space. The results shown are for n = 100 and p = 5. From this table we see that all intervals become more conservative when the amount of contamination increases. The coverage level is comparable throughout the predictor space but not surprisingly the length of the intervals increases with the distance from the center of the predictor space. The increase is more pronounced for the confidence intervals than for the prediction intervals. With this simulation design, the
Fast and Robust Bootstrap
21
Table 3 Coverage and length of 99% FRB based confidence and prediction intervals at x0 = (1, 0)t = and x0 = (1, 3)t . Samples of size n = 100 with 2m asymmetric outliers in p = 5 dimensions for m = 0, 5 and 10. x0
(1, 0)t
(1, 3)t
m
FRB-quantile CI
FRB-SE CI
FRB Pred Int
0
0.985 (0.547)
0.986 (0.547)
0.987 (5.051)
5
0.970 (0.726)
0.959 (0.723)
0.996 (5.965)
10
0.373 (0.959)
0.327 (0.952)
0.997 (7.230)
0
0.987 (3.399)
0.985 (3.357)
0.985 (6.056)
5
0.988 (4.470)
0.987 (4.411)
0.994 (7.414)
10
0.986 (6.670)
0.985 (6.570)
0.997 (9.780)
confidence intervals based on bootstrap quantile estimates tend to be slightly larger than the confidence intervals based on a bootstrap estimate of the standard error. Table 3 shows the results for asymmetric outliers. The coverage of the confidence intervals at x0 = (1, 3)t is a little bit below the nominal level of 99% but the performance is still acceptable. However, for x0 = (1, 0)t the coverage is very low. This negative effect is due to the large bias on the MM-estimate of the intercept caused by the outliers in this simulation setting. The confidence and prediction intervals based on FRB only reflect sampling variability of the estimates but do not take bias into account. Therefore, if asymmetrically distributed outliers may be present in the data, we recommend that the FRB be combined with globally robust inference methods as those discussed in Adrover et al. (2004) which are designed to reflect both sampling variability and bias.
3 Robust multivariate methods Although not as widespread as in linear regression, the bootstrap has various useful applications in multivariate methods. In this section, we will discuss three of these: (1) inference and stability assess-
22
Mat´ıas Salibi´ an-Barrera et al.
ment in principal components analysis; (2) inference in multivariate linear regression; and (3) error rate estimation in discriminant analysis. Applying classical bootstrap to robust multivariate estimators comes with the same problems as in robust regression: a high computational cost and low breakdown. The FRB method offers a much more practical and reliable alternative. It can be applied in the case of some well-known robust multivariate estimators, most notably multivariate S-estimators (Rousseeuw and Leroy 1987; Davies 1987) or multivariate MM-estimators (Tatsuoka and Tyler 2000). Similarly to the linear regression setting, MMestimators avoid the S-estimators’ trade-off between Gaussian efficiency and breakdown point. However, as the dimension p of the data increases, the relative efficiency of a high breakdown S-estimator increases as well (see e.g. Salibian-Barrera et al., 2006). Hence, the trade-off is less severe than in univariate regression. For this reason, and because of their popularity, we will focus on S-estimators in this section. Note however that the FRB can equally well be applied to multivariate MM-estimators (as in SalibianBarrera et al., 2006), or to other “smooth” estimators for that matter (for example Lopuha¨a’s (1992) multivariate τ -estimators).
3.1 Principal components analysis
Principal components analysis is a very common technique in multivariate statistics. It aims to explain the covariance structure of the data by projecting the observations onto a small number of principal components, which are linear combinations of the original variables. Classical PCA is based on the eigenvectors and eigenvalues of the sample covariance or shape matrix. Robust PCA methods which replace the latter by a robust estimate of scatter or shape have been proposed and investigated by many authors starting with Maronna (1976), Campbell (1980) and Devlin et al. (1981). More recently Croux
Fast and Robust Bootstrap
23
and Haesbroeck (2000) compared several robust estimators in a more formal manner, and suggested the use of S-estimators. Suppose we have a sample Zn = {x1 , . . . , xn } ⊂ Rp , and let ρ be a function that satisfies (R1) and bn , minimize |C| subject to b n and Σ (R2). Then the S-estimates of location and scatter, µ ´ 1 1X ³ ρ [(xi − T )t C −1 (xi − T )] 2 = b n i=1 n
(29)
among all T ∈ Rp and C ∈ PDS(p). Here, PDS(p) denotes the set of positive definite symmetric p × p matrices. The constant b is usually chosen such that b = EΦ [ρ(kxk)], which ensures consistency at the bn equals min(b/ρ(∞), 1 − b/ρ(∞)). For any b n and Σ normal model. The asymptotic breakdown point of µ given dimension p, ρ can be tuned in order to achieve a 50% breakdown point. bn . Regarding The corresponding robust PCA method is based on the eigenvalues and eigenvectors of Σ inference, results based on asymptotic normality can be used to construct confidence intervals or to estimate standard errors of the eigenvalues and eigenvectors (see e.g. Croux and Haesbroeck, 2000). However, these results only hold under the assumption of some underlying elliptical distribution, which is of course not appropriate in those cases where robust estimation is most recommended. Inference based on the asymptotic variances derived at the central model may still yield reasonable results for small amounts of contamination when the sample size is large. The bootstrap, however, is expected to work better for smaller sample sizes and for larger deviations from the central model. Moreover, since the bootstrap can estimate the sampling distribution of the estimator of interest, it offers a wider range of inference applications and allows to assess the stability of the PCA results. Salibian-Barrera et al. (2006) used the fast and robust bootstrap for robust PCA based on multivariate MM-estimates. Their discussion and theoretical results are valid for S-estimates as well, since the latter can be seen as a special case of MM-estimates. The FRB method basically generates many
24
Mat´ıas Salibi´ an-Barrera et al.
bn , and inference or stability assessment is based on the eigenvalues and eigenvectors recalculations of Σ of these recomputed matrices. ˆn = We can fit the multivariate S-estimates into the fixed-point setting of (1) when we take θ bn )t )t . Indeed, analogously to the regression equations (14)-(16), it can be shown that the ((b µn )t , vec(Σ ˆ n satisfy the following weighted mean and covariance expressions: estimates θ Ã n !−1 n X ρ0 (di ) X ρ0 (di ) bn = µ xi di di i=1 i=1 Ã n ! n ³X ´ 1 X ρ0 (di ) t b b b n )(xi − µ b n) + Σn = p (xi − µ si Σn nb i=1 di i=1
(30) (31)
bn−1 (xi − µ b n )]1/2 and si = ρ(di ) − ρ0 (di )di . b n )t Σ where di = [(xi − µ ˆ 1∗ are again obtained by taking the bootstrap versions of (30)The one-step bootstrap estimates θ n ˆ R∗ , (31), but letting each observation keep its original weight. Subsequently we compute (6) to obtain θ n bnR∗ . Herein, we need the partial derivatives of the function and in particular the statistic of interest here, Σ gn as defined by (30)-(31), which are obtained through some tedious though straightforward calculations (see also Van Aelst and Willems, 2004). bnR∗ may not be Note that, because of the linear correction in (6), the recalculated shape estimates Σ positive definite and hence the bootstrapped eigenvalue estimates can be negative. In practice this seems to occur very rarely, but care must be taken, especially for small sample sizes. A simple solution is to discard those bootstrap samples where this happens. Alternatively, one can consider transformations of bnR∗ such as those described in Rousseeuw and Molenberghs (1993). Σ Salibian-Barrera et al. (2006) proved the consistency of the FRB for multivariate MM-estimates of location and scatter. We state their theorem here for the special case of S-estimates. Similarly to the bn be consistent estimates. See Lopuha¨a (1989) for b n and Σ conditions of Theorem 1, it is required that µ weak assumptions under which S-estimates are consistent.
Fast and Robust Bootstrap
25
bn ) be the corTheorem 3 (Salibian-Barrera et al. 2006) Let ρ satisfy (R1) and (R2) and let (b µn , Σ P P bn → b n → µ, Σ responding multivariate S-estimates. Assume that µ Σ. Then, under certain regularity
conditions, along almost all sample sequences the distributions of converge weakly to the same limit distributions as those of
√
√
b n ) and n(b µR∗ n −µ
n(b µn − µ) and
√
√
bnR∗ − Σ bn ) n(Σ
bn − Σ) respectively. n(Σ
Bickel and Freedman (1981) show that the bootstrap commutes with smooth functions. This can be bn . We do need used to prove the consistency of bootstrapping the eigenvalues and eigenvectors of Σ a restriction to simple eigenvalues though, since otherwise we do not have the necessary smoothness conditions. Theorem 4 (Salibian-Barrera et al. 2006) Let λΣ be a simple eigenvalue of Σ, with normalized eigenvector vΣ . Then in some neighbourhood N (Σ) of Σ there exists a real-valued function λ and vector function v such that λ(Σ) = λΣ and v(Σ) = vΣ , as well as Cv = λv, v t v = 1 for all C ∈ N (Σ). Assuming the same regularity conditions as in the previous theorem, we have that the distributions of √ of
bnR∗ ) − λ(Σ bn )) and √n(v(Σ bnR∗ ) − v(Σ bn )) converge weakly to the same limit distributions as those n(λ(Σ √
bn ) − λ(Σ)) and n(λ(Σ
√
bn ) − v(Σ)) respectively. n(v(Σ
Theorem 4 serves as the theoretical justification for applying the FRB method in robust PCA. Examples of (classical) bootstrap applied to (classical) PCA can be found in Diaconis and Efron (1983), Daudin et al. (1988) or Beran and Srivastava (1985) amongst others. Salibian-Barrera et al. (2006) considered three different bootstrap applications: bn , as estimates of the eigenvalues of the population 1. Assessing the variability of the eigenvalues of Σ scatter matrix Σ; simulations showed that confidence intervals based on the FRB are reasonably short and have good coverage, generally comparable to confidence intervals based on the asymptotic normality approach; both bootstrap and asymptotic inference for eigenvalues is less reliable, however, bn is small. when the difference between consecutive eigenvalues of Σ
26
Mat´ıas Salibi´ an-Barrera et al.
bn and those of Σ; simulations 2. Estimating the distribution of the angles between the eigenvectors of Σ showed that this is quite efficiently estimated by the distribution of the angles between the FRB bnR∗ and the eigenvectors of Σ bn ; for example, an eigenvector of Σ bn which recalculated eigenvectors of Σ bnR∗ , can be considered an accurate estimate of is relatively aligned with its recalculations based on Σ the corresponding eigenvector of Σ. 3. Assessing the variability of pbk = (
Pk i=1
bi )/(Pp λ b b λ i=1 i ), where λi ; i = 1, . . . , p are the ordered eigen-
bn ; the statistic pbk estimates the percentage of variance explained by the first k robust values of Σ principal components (k = 1, . . . , p−1) and is often used to decide on how many principal components to retain for further analysis; confidence limits accompanying pbk can give additional information on which to base such a decision; simulations showed that confidence intervals based on the FRB usually outperform the intervals based on asymptotic normality. Note that Salibian-Barrera et al. (2006) in fact worked with the eigenvalues and eigenvectors of the bn (which is defined as Γbn := |Σ bn |−1/p Σ bn ), instead of with those of Σ bn itself. This shape component of Σ approach in principle yields exactly the same robust PCA method, although inference for eigenvalues tends to be less troubled by outlier-induced bias.
3.2 Multivariate linear regression
Consider now a sample of the form Zn = {(y1t , xt1 )t , . . . , (ynt , xtn )t } ⊂ Rq+p . The multivariate linear regression model is given by yi = B0t xi + ²i ,
i = 1, . . . , n ,
(32)
where B0 is the p × q matrix of regression coefficients. It is again assumed that the distribution of the observations belongs to a contamination neighbourhood where the central model is such that the
Fast and Robust Bootstrap
27
q-variate error vectors ²i have an elliptically contoured density with zero center and scatter parameter Σ0 ∈ PDS(q). Quite similar to the univariate situation, least squares estimation of B0 is very sensitive to outliers and several robustifications have been proposed. One of these is Van Aelst and Willems’ (2005) proposal to incorporate the regression model into the multivariate S-estimates as defined in (29). The resulting bn minimize |C| subject to multivariate regression S-estimates Bbn and Σ ´ 1 1X ³ ρ [(yi − B t xi )t C −1 (yi − B t xi )] 2 = b n i=1 n
(33)
among all B ∈ Rp×q and C ∈ PDS(q). Robust multivariate regression based on S-estimates has good robustness and efficiency properties (Van Aelst and Willems 2005) and of course allows the application of the FRB method for inference ˆ n = (vec(Bbn )t , vec(Σ bn )t )t , are now given by purposes. The estimating equations (1), with θ Ã n !−1 n X ρ0 (di ) X ρ0 (di ) t Bbn = xi xi xi yit d d i i i=1 i=1 Ã n ! n ³X ´ 0 X ρ (di ) 1 t t t b b b b p Σn = (yi − Bn xi )(yi − Bn xi ) + si Σn nb i=1 di i=1
(34) (35)
bn−1 (yi − Bbnt xi )]1/2 and where si = ρ(di ) − ρ0 (di )di as before. where we redefined di as di = [(yi − Bbnt xi )t Σ bnR∗ are again defined by (6). Expressions for the partial derivatives of The FRB recalculations BbnR∗ and Σ the function gn for this particular application are given in Van Aelst and Willems (2004). The asymptotic consistency of the FRB method in multivariate regression can be shown by straightforward adaptation of the proofs of Theorem 1 and 3. The principal purpose of the bootstrap in multivariate regression would be to obtain standard errors or confidence intervals for the individual coefficients in Bbn . Analogously to the result stated in Theorem 2, Van Aelst and Willems (2005) show that the quantiles of the bootstrap distribution of BbnR∗ have a high breakdown point, contrary to those of the classical bootstrap.
28
Mat´ıas Salibi´ an-Barrera et al.
Also in Van Aelst and Willems (2005), extensive simulation results are given on the performance of the FRB confidence intervals. The latter were found to have a coverage close to the nominal value and a reasonable average length, for various data configurations. The FRB outperformed intervals based on the asymptotic variance, especially when bad leverage points were present. Another robust approach for multivariate regression is based on robust estimates of the location and scatter of the joint distribution of the x- and y-variables (Rousseeuw et al. 2004, amongst others). If we use multivariate location S- or MM-estimates for this purpose, then the fast and robust bootstrap can readily be applied for inference in this context as well.
3.3 Discriminant analysis
Linear and quadratic discriminant rules are widely used for classification of multivariate data in two or more populations. For simplicity, we will restrict the discussion to the situation with two populations, π1 and π2 , having respective means µ1 and µ2 , and respective covariance matrices Σ1 and Σ2 . Furthermore, we will assume equal prior probabilities. The quadratic Bayes rule then classifies an observation x into Q population π1 if dQ 1 (x) > d2 (x), where
1 1 t −1 dQ j (x) = − log|Σj | − (x − µj ) Σj (x − µj ); j = 1, 2, 2 2
(36)
and into population π2 otherwise. Assuming now that Σ1 = Σ2 = Σ yields the linear rule based on the scores dL j (x): 1 t −1 x − µtj Σ −1 µj ; j = 1, 2. dL j (x) = µj Σ 2
(37)
Since the true parameters µ1 , µ2 , Σ1 and Σ2 are unknown, they need to be estimated from a so-called training sample of the form Zn ={x11 , . . . , x1n1 , x21 , . . . , x2n2 } ⊂ Rp . Classical linear and quadratic discriminant analysis is based on the empirical means and covariances of Zn . Alternative and more robust
Fast and Robust Bootstrap
29
methods are naturally obtained by using more robust estimates of location and scatter instead (e.g. Randles et al., 1978, Hawkins and McLachlan, 1997, Croux and Dehon, 2001 and Hubert and Van Driessen, 2004). S-estimates are once again excellent candidates for this purpose. b 1n1 , Simply computing the S-estimates, as defined by (29), for both groups contained in Zn yields µ bn1 and Σ bn2 , which can be plugged into the quadratic scores (36). For robust versions of the linear b 2n2 , Σ µ 1 2 scores (37), where we need an estimate for the common covariance matrix Σ, several options exist. One bn1 and Σ bn2 . Another, somewhat more efficient approach possibility consists of pooling the estimates Σ 1 2 bn minimize |C| subject to b 1n , µ b 2n and Σ is offered by He and Fung’s (2000) two-sample S-estimates: µ n1 ³ ´ 1 1 X ρ [(x1i − T1 )t C −1 (x1i − T1 )] 2 + n1 i=1 n2 ´ ³ 1 1 X ρ [(x2i − T2 )t C −1 (x2i − T2 )] 2 = b n2 i=1
(38)
among all T1 , T2 ∈ Rp and C ∈ PDS(p). The performance in terms of misclassification error rates of several such robust discriminant rules has been investigated in the references mentioned above. However, the question of how to estimate the error rate in practice has not often been addressed. Hubert and Van Driessen (2004) acknowledge that the popular cross-validation (CV) technique might be too time-consuming. Therefore, they advocate to split the available data in a training set and a validation set, even though this approach is wasteful of data and has some other shortcomings. The bootstrap has often been proposed as an alternative and possible improvement on cross-validation (e.g. Efron 1983). The classical bootstrap obviously suffers from similar computational problems as cross-validation does, but since we are using S-estimates, the FRB method can be applied instead. The idea of bootstrap error estimation is to reconstruct the discriminant rule for every bootstrap sample, based on the recalculated parameter estimates. Each time, then, the rule is evaluated on those
30
Mat´ıas Salibi´ an-Barrera et al.
observations that were not included in that particular bootstrap sample and the percentage of misclassifications is computed. The averaged percentage over all bootstrap samples, say err c boot , gives an estimate of the true error rate of the original rule. This estimate generally has an upward bias and therefore Efron (1983) proposed to average it with the downwardly biased resubstitution estimate err c resub (obtained by evaluating the rule on the sample Zn itself). Efron’s proposal is well-known as the .632 estimator: err c .632 = .632 err c boot + .368 err c resub The choice of the weight .632 is based on the fact that it approximately equals the probability for a given observation to be included in a given bootstrap sample. For the quadratic discriminant rule, the FRB formulas from Section 3.1 can simply be applied twice bn1R∗ and Σ bn2R∗ . For the linear discriminant rule based on the b 1R∗ b n2R∗ to obtain the recalculations µ ,Σ n1 , µ 2 1 2 two-sample S-estimates given by (38), we can obtain analogous formulas by noting that the estimating ˆ n = ((b bn )t )t are given by equations for θ µ1n )t , (b µ2n )t , vec(Σ !−1 n Ãn (1) (1) 1 1 X X ρ0 (di ) 1 ρ0 (di ) 1 bn = µ xi (1) (1) di di i=1 i=1 Ãn !−1 n (2) (2) 2 2 X X ρ0 (di ) ρ0 (di ) 2 2 bn = µ xi (2) (2) di di i=1 i=1 Ãn n1 (1) 1 ³X ´ 1 X ρ0 (di ) 1 (1) b b b 1n )(x1i − µ b 1n )t + Σn = p (1) (xi − µ si Σ n nb i=1 di i=1 ! n2 n2 (2) ³X ´ X ρ0 (di ) 2 (2) 2 2 bn b n )t + b n )(x2i − µ si Σ + p (2) (xi − µ d i=1 i=1 i (1)
where di
(1)
bn−1 (x1 − µ b 1n )t Σ b 1n )]1/2 , si = [(x1i − µ i
(1)
(1)
(1)
(39)
(40)
(41) (2)
= ρ(di ) − ρ0 (di )di , and analogously for di
(2)
and si .
bnR∗ . b 1R∗ b 2R∗ Through (6) we then once more obtain the recalculations µ and Σ n , µ n We performed a short simulation study to examine the accuracy of the bootstrap error rate estimates in robust discriminant analysis, focusing on the linear rule based on the two-sample S-estimates. We used the same simulation design as the one reported in He and Fung (2000). That is, we have two groups of
Fast and Robust Bootstrap
31
observations, drawn from populations π1 and π2 , in dimension p = 3 and we consider 5 different settings: π1
π2
A:
50 N (0, I)
50 N (1, I)
B:
40 N (0, I) + 10 N (5, 0.252 I)
40 N (1, I) + 10 N (−4, 0.252 I)
C:
80 N (0, I) + 20 N (5, 0.252 I)
8 N (1, I)
D:
16 N (0, I) + 4 N (0, 252 I)
16 N (1, I) + 4 N (1, 252 I)
E:
58 N (0, I) + 12 N (5, 0.252 I)
25 N (1, 4I) + 5 N (−10, 0.252 I)
+ 2 N (−4, 0.252 I)
Here, m N (a, S1 ) + n N (b, S2 ) means that we draw m points from N ((a a a)t , S1 ) and n points from N ((b b b)t , S2 ). Hence, setting A corresponds to uncontaminated normal data, whereas in the other settings 20% of the observations are outliers. Note that He and Fung’s (2000) experiment was meant to compare the rule based on two-sample S-estimates to other discriminant rules, including the classical linear rule. Here, we are not particularly concerned with the actual error rate of the rule, but rather with the performance of the bootstrap in estimating this error rate.
We generated N = 1000 samples for each setting listed above, for which we computed the robust linear discriminant rule based on the 50% breakdown S-estimates (using Tukey’s biweight). We then in each sample estimated the error rate of this rule through the FRB-based .632 and the classical bootstrap .632 estimator (both with varying number of bootstrap samples: B = 10, 30 and 100), as well as through k-fold CV (varying k: k = 5, 10 and n) and through resubstitution. Both bootstrap and cross-validation were performed in a stratified manner, ensuring that the ratio between observations from π1 and from π2 in the new samples is approximately similar to the ratio in the original sample Zn . Also, observations that were identified as outliers through their Mahalanobis distances based on the two-sample S-estimates, were always ignored when computing the misclassification percentages.
32
Mat´ıas Salibi´ an-Barrera et al.
Table 4 Root mean squared error for misclassification rate estimates for linear discriminant rule based on two-sample maximum breakdown S-estimates A
B
C
D
E
B = 10
.045
.047
.067
.076
.094
.03
error [ .632
B = 30
.044
.045
.065
.072
.093
.06
(FRB)
B = 100
.044
.045
.064
.070
.093
.16
B = 10
.046
.055
.065
.080
.091
1.37
error [ .632
B = 30
.045
.051
.062
.076
.089
4.12
(Classical)
B = 100
.045
.049
.062
.074
.088
13.72
k=5
.048
.053
.067
.092
.094
.64
k = 10
.048
.051
.068
.086
.096
1.34
k=n
.048
.048
.068
.085
.097
13.80
error [ resub
.053
.050
.072
.093
.117
.00
“True” error rate
.204
.205
.215
.223
.290
error [ CV
time
Table 4 lists the root mean squared error of the different estimates for the misclassification rate. The “true” error rate is obtained by evaluating the rules on a large test sample (n = 2000) drawn from the uncontaminated parts of π1 and π2 respectively, and is also reported in Table 4. The last column contains the corresponding average computation times (in CPU seconds) for a sample from setting A. We used a standard implementation of Salibian-Barrera and Yohai’s (2006) algorithm for S-estimators, adapted for the multivariate two-sample situation. These values are mainly listed for comparison reasons. The mean squared errors (MSEs) seem to indicate that both the FRB and the classical bootstrap estimates on average have a slight advantage over CV. The two bootstrap methods take turns in achieving
Fast and Robust Bootstrap
33
the lowest MSE values for the five situations, with the differences being relatively small. The FRB estimates of course have the advantage of being much faster to compute. It should be noted that the difference in computation time will become more of practical significance when the sample sizes become larger than in this experiment. Concerning CV, the possibly very time-consuming n-fold CV does not always yield better results than the faster 5-fold CV. Note, however, that even 5-fold CV is much slower than the FRB and that small values of k generally carry a higher risk of numerical instability due to high percentages of outliers, similarly to the classical bootstrap situation. In this simulation study, though, this type of numerical instability did not occur in CV nor in the classical bootstrap: the 20% outliers in the original sample did not constitute a real challenge to the 50% breakdown point of the S-estimator. Table 4 further shows that increasing the number of bootstrap samples B generally improves the accuracy of the error rate estimates, as could be expected. Given the small computational cost of the FRB method, it seems reasonable to choose a relatively high number, say B = 100 at least. Note, finally, that the .632 estimates for every setting outperform the resubstitution estimate.
4 Examples
In this section we give two real data examples to illustrate the use and the benefits of the FRB method in the context of PCA and discriminant analysis, respectively. For examples in the context of linear regression, we refer to Salibian-Barrera (2000), Salibian-Barrera and Zamar (2002) and Van Aelst and Willems (2005).
34
Mat´ıas Salibi´ an-Barrera et al.
4.1 PCA : Bank notes data
For an illustration of the FRB method for robust PCA, we consider the measurements on n = 100 forged old Swiss 1000 franc bills, which are part of the ‘Swiss bank notes data’ from Flury and Riedwyl (1988). The data consist of p = 6 variables corresponding to length, height and other distance measurements on the bills, and was also analysed in Salibian-Barrera et al. (2006). We applied PCA based on the 50% breakdown S-estimator. The distances di based on the robust location and covariance estimates are shown in Figure 1 (left). It can be seen that the S-estimator detected a group of 15 outlying observations (with large robust distances). b The S-estimates for the eigenvalues of the shape matrix are given by λ=[1.38, 0.24, 0.14, 0.07, 0.06, 0.03]. The coefficients or weights of the first PC are vb1 = [−0.068 0.028 −0.020 0.816 −0.568 −0.082]. Hence, the first principal component can be interpreted as the difference between the 4th and the 5th
V1
10
V2 V4
V3
6
4
V5
Robust distance
8
V6
2
0 0
20
40
60
80
100
−1
−0.5
0
0.5
1
Index
Fig. 1 Swiss bank notes data; Left: robust distances based on S; Right: weights in the first PC, with FRB histograms
Fast and Robust Bootstrap
35
variable. These correspond to the distance from the inner frame on the bill to respectively the lower border and the upper border.
The right panel of Figure 1 plots the weights in vb1 along with bootstrap histograms obtained by performing the FRB with B = 1000. This is another application of bootstrap for PCA, not mentioned in the previous section. Some care is needed here, since the coefficients of the principal components are not uniquely defined. In order to obtain meaningful inference results, we imposed that, for each vbj ; j = 1, . . . , 6, the coefficient with the largest absolute value should be positive in every bootstrap recalculation, as well as in the S-estimate vbj itself. The bootstrap result in Figure 1 indicates that the coefficients of vb1 , i.e. the weights associated with the first PC, are quite stable. Note that the bootstrap can also be used to construct confidence intervals for the weights and to determine which original components contribute significantly to a PC.
As an alternative way of assessing the stability of the first PC, we look at the bootstrap distribution of the angles acos(|b v1t vb1∗ |). The upper panels in Figure 2 compare the result from the classical bootstrap (left) with that from the FRB (right).
While the fast and robust bootstrap recalculations yield angles no larger than about 0.2, the classical bootstrap suggests a somewhat higher variability. This is in fact an illustration of the instability of the classical bootstrap. Indeed, it turns out that the bootstrap samples corresponding to the larger angles all contained more than 15 replications from the original group of 15 outliers. This is shown in the lower panels in Figure 2, where we plotted for each bootstrap sample the angle between vb1 and vb1∗ versus the total number of replications of the 15 outliers in that bootstrap sample. The left panel again corresponds to the classical bootstrap, the right to the fast and robust bootstrap. Clearly, in the classical procedure higher proportions of outlying observations give rise to a larger variability concerning the eigenvector
36
Mat´ıas Salibi´ an-Barrera et al.
250
300 250
200
200 150 150 100 100 50
0.1
0.2 0.3 angle(v1*, v1)
0.4
0 0
0.5
0.5
0.4
0.4 angle(v *, v )
0.5
0.1
0.2 0.3 angle(v1*, v1)
0.4
0.5
1
1
angle(v *, v )
0 0
50
0.3
1
1
0.3
0.2
0.1
0 0
0.2
0.1
5 10 15 20 25 Number of ’outliers’ in bootstrap sample
30
0 0
5 10 15 20 25 Number of ’outliers’ in bootstrap sample
30
Fig. 2 Swiss bank notes data: Upper: bootstrap histograms for the angles between vb1∗ and vb1 ; Lower: angles between vb1∗ and vb1 versus number of observations from the outlier group present in the bootstrap sample; Left: classical bootstrap; Right: FRB
angles. On the other hand, in the FRB procedure the group of 15 outliers is severely downweighted, due to the large robust distances, and hence has very little influence on the recalculated eigenvectors. We now turn to the question of how many components should be retained. The S-estimates yield pb1 = 72.0%, pb2 = 84.5%, pb3 = 91.6%, pb4 = 95.2% and pb5 = 98.4%. We used the FRB to construct 95% confidence intervals for these percentages. The left panel of Figure 3 shows the bootstrap intervals (BCa method; see Davison and Hinkley, 1997, page 202) and as a comparison also gives the intervals based on an empirical version of the asymptotic variance. The classical bootstrap intervals, which are not shown on the plot, were very similar to the FRB intervals. The dotted vertical lines indicate the point
Fast and Robust Bootstrap
37
ASV FRB
5
5
4 k
4 k
3
3
2
2
1
1 65
70
75 80 85 90 Percentage of variance
95
100
65
70
75 80 85 90 Percentage of variance
95
100
Fig. 3 Swiss bank notes data. Left: 95% confidence intervals for the percentage of variance explained by the first k principal components; FRB (solid) compared to intervals based on asymptotic normality (dashed). Right: 95% one-sided confidence intervals (FRB) for the percentage of variance explained by the first k principal components
estimates. The difference between both methods here is rather small, although the intervals based on asymptotic normality are slightly more optimistic. Recall that the simulation study in Salibian-Barrera et al. (2006) demonstrated that bootstrap intervals usually have better coverage. The intervals in general are somewhat long, although there is no overlap present. Concerning the number of PCs to retain, suppose we adopt the criterion of choosing the smallest k for which the percentage pk exceeds some cutoff value. Then, if the cutoff is set at 70%, we might decide to play it safe and take two components into account, instead of just the first. Indeed, the point estimate pb1 equals 72.0%, but the lower limit of the confidence interval is as low as 63.5%. If the cutoff is set at 80%, the choice for k = 2 would be obvious since both the point estimate and almost the whole interval exceeds 80%. In case of a 90% cutoff, the estimate pb3 leads to the choice of k = 3 but the corresponding interval again suggests to be careful and to choose k = 4 instead. Finally, note that we could apply the duality between hypothesis tests and confidence intervals to test null hypotheses of the form H0 : pk ≥ π. Here, π would then equal e.g. 80% or 90%. We can decide to accept H0 at the level α whenever π is contained in a (1 − α)100% one-sided confidence interval for
38
Mat´ıas Salibi´ an-Barrera et al.
pk . As an example we plotted in in the right panel of Figure 3 the 95% one-sided intervals for pk based on the fast bootstrap, where we again used the BCa method. On this plot we can immediately see which hypotheses would be accepted on the 5% significance level. E.g. H0 : pk ≥ 80% is accepted for k ≥ 2, while H0 : pk ≥ 90% is accepted for k ≥ 3.
4.2 Discriminant analysis: Hemophilia data
For an example in the context of robust discriminant analysis we turn to the Hemophilia data (Habbema et al. 1974), which consists of n1 = 30 observations on normal women and n2 = 45 on hemophilia A carriers, in p = 2 variables. The data are depicted in the upper left panel of Figure 4. Group 1 observations are plotted by crosses (x), group 2 observations by dots (•). Robust discriminant analysis methods were applied to these data by Hawkins and McLachlan (1997) and by Hubert and Van Driessen (2004), both of which concluded that their robust method gave similar results as the classical discriminant method. Such a conclusion can be considered desirable for a robust method in this case, since it is clear that there are no real outliers in the data and hence the classical method’s performance would be close to optimal. Here we applied the robust linear discriminant method based on S-estimates, where we chose to tune the biweight function such that we have a 25% breakdown value (and hence a better efficiency than the 50% breakdown version). The resulting discriminant line is again very similar to the classical line. It is superimposed on the data in the upper left panel of Figure 4, which also shows the tolerance ellipses of the two groups. The location and shape of the tolerance ellipses are based on the two-sample S-estimates bn ) and (b bn ) respectively. The volumes are such that the ellipses include those observations (b µ1n , Σ µ2n , Σ (1)
from the group with distances (di
(2)
resp. di ) not larger than the .975 χ2p quantile. It can be seen that
only a few very small outliers (i.e. observations outside their respective tolerance ellipse) are found by the S-estimates.
Fast and Robust Bootstrap
39
To estimate the misclassification rate of the discriminant rule based on the S-estimates, we applied both the FRB and the classical bootstrap, with B = 100. Averaged over 10 runs (corresponding to different bootstrap samples), the .632 rules of the two bootstrap procedures respectively estimated .1621 and .1625. Hence, the FRB and the classical bootstrap did not yield appreciably different results here, except that the FRB was much faster. This indicates that the FRB is not only fast and robust but also accurately mimics the classical bootstrap whenever the latter is supposed to work well, i.e. in outlier-free data. Now to get an appreciation of the robustness of the FRB method, we did a small experiment by drawing observations from N2 ((−1, .8)t , .1I), sequentially adding them to the data and labeling them as belonging to group 1. This results in the contaminated data depicted in the lower panels of Figure 4, for 10, 15 and 20 outliers respectively. These plots also show the results of the linear discriminant rule based on the S-estimates. As can be seen, the S-estimates are not influenced much by the outliers until the number of outliers reaches 20. At this point the S-estimator no longer detects and downweights the outliers, and the method breaks down. While the S-estimates may not be bothered by less than 20 such outliers, it is interesting to ask whether the corresponding bootstrap error rate estimates remain unaffected as well. The upper right panel of Figure 4 gives the answer, by plotting the error rate estimates as a function of the number of outliers, starting at 10. The solid line corresponds to the FRB, the dashed line to the classical bootstrap, and the dotted line are the resubstitution estimates. The bootstrap estimates are again averaged over 10 runs. The horizontal line indicates the error rate as estimated on the original data (.162). The FRB estimates deviate very little from the original estimate, until the S-estimates themselves finally break down at 20 outliers. On the other hand, the classical bootstrap estimates are clearly affected by the outliers, starting from 15 outliers say, long before the discriminant rule itself is affected. This can be
40
Mat´ıas Salibi´ an-Barrera et al.
Misclassification rate estimate
0.5
0
−0.5 −0.8
−0.6
−0.4
−0.2
0
0.4
.632 (FRB) .632 (Clas) resub
0.35 0.3 0.25 0.2 0.15 0.1 10
0.2
12
14
16
18
20
Number of outliers
+ 10 outliers
+ 15 outliers
1
+ 20 outliers
1
1
0.8 0.6
0.5
0.5
0.4 0.2
0
0
0 −0.2
−0.5 −0.4
−0.5
−0.6 −1
−0.5
0
0.5
−1
−0.5
0
0.5
−1 −1.5
−1
−0.5
0
0.5
Fig. 4 Upper left: Hemophilia data with S-based linear discriminant result; Upper right: misclassification rate estimates as a function of the number of added outliers; Lower: Hemophilia data contaminated with 10, 15, and 20 outliers respectively, with S-based linear discriminant result
attributed to the fact that some bootstrap samples will contain enough outliers to break down the Sestimates, resulting in many misclassifications corresponding to those bootstrap samples and thus an overestimation of the error rate.
Fast and Robust Bootstrap
41
5 Conclusion The fast and robust bootstrap method reviewed in this paper has been proven to be a practical and reliable tool for inference based on robust estimators in various settings. The method is especially valuable in linear regression, for which robust inference in terms of confidence intervals and hypothesis tests is of crucial importance. Its application, however, is not limited to robust regression. It has been demonstrated that the FRB performs well as an inference technique in multivariate models, particularly regarding robust principal components analysis. Also, in this paper we have given an example of the method’s usefulness in robust discriminant analysis. The FRB procedure was specifically developed for S- and MM-estimators, which are among the most prominent robust estimators in the literature as well as in practice. Other estimators to which the method can be applied include GM-estimators and τ -estimators.
References 1. Adrover, J., Salibian-Barrera, M. and Zamar, R. (2004). Globally robust inference for the location and simple linear regression models. Journal of Statistical Planning and Inference, 119, 353–375. 2. Beaton, A.E. and Tukey, J.W. (1974). The fitting of power series, meaning polynomials, illustrated on bandspectroscopic data. Technometrics, 16, 147–185. 3. Beran, R. and Srivastava, M.S. (1985). Bootstrap tests and confidence regions for functions of a covariance matrix. The Annals of Statistics, 13, 95–115. 4. Bickel, P.J. and Freedman, D.A. (1981). Some asymptotic theory for the bootstrap. The Annals of Statistics, 9, 1196–1217. 5. Campbell, N.A. (1980). Robust procedures in multivariate analysis: robust covariance estimation. Applied Statistics, 29, 231–237. 6. Carroll, R.J. (1978). On almost sure expansions for M-estimates. The Annals of Statistics, 6, 314–318.
42
Mat´ıas Salibi´ an-Barrera et al.
7. Carroll, R.J. (1979). On estimating variances of robust estimators when the errors are asymmetric. Journal of the American Statistical Association, 74, 674–679. 8. Carroll, R. J. and Welsh, A. H. (1988). A Note on Asymmetry and Robustness in Linear Regression. The American Statistician, 42, 285–287. 9. Croux, C. and Dehon, C. (2001). Robust linear discriminant analysis using S-estimators. Canadian Journal of Statistics, 29, 473–492. 10. Croux, C., Dhaene, G. and Hoorelbeke, D. (2003). Robust standard errors for robust estimators. Research report, Dept. of Applied Economics, K.U. Leuven. 11. Croux, C. and Haesbroeck, G. (2000). Principal components analysis based on robust estimators of the covariance or correlation matrix: influence functions and efficiencies. Biometrika, 87, 603–618. 12. Davies, P.L. (1987). Asymptotic behavior of S-estimates of multivariate location parameters and dispersion matrices. The Annals of Statistics, 15, 1269–1292 13. Davies, P.L. (1990). The asymptotics of S-estimators in the linear regression model. The Annals of Statistics, 18, 1651–1675 14. Davison, A.C. and Hinkley, D.V. (1997). Bootstrap Methods and their Application. Cambridge Series in Statistical and Probabilistic Mathematics. Cambridge: Cambridge University Press. 15. Daudin, J.J., Duby, C. and Trecourt, P. (1988). Stability of principal component analysis studied by the bootstrap method. Statistics, 19, 241–258. 16. Devlin, S.J., Gnanadesikan, R., and Kettenring, J.R. (1981). Robust estimation of dispersion matrices and principal components. Journal of the American Statistical Association, 76, 354–362. 17. Diaconis, P. and Efron, B. (1983). Computer-intensive methods in statistics. Scientific American, 248, 96– 108. 18. Efron, B. (1979). Bootstrap methods: another look at the jackknife. The Annals of Statistics, 7, 1–26. 19. Efron, B. (1983). Estimating the error rate of a prediction rule: some improvements on cross-validation. Journal of the American Statistical Association, 78, 316–331.
Fast and Robust Bootstrap
43
20. Fisher, N.I. and Hall, P. (1990). On bootstrap hypothesis testing. The Australian Journal of Statistics, 32, 177–190. 21. Flury, B. and Riedwyl, H. (1988). Multivariate Statistics: A Practical Approach, Cambridge University Press. 22. Freedman, D. A. (1981). Bootstrapping regression models. The Annals of Statistics, 9, 1218–1228. 23. Habbema, J.D.F., Hermans, J. and Van den Broeck, K. (1974). A stepwise discriminant analysis program using density estimation. In: Bruckmann, G., Ferschl, F. and Schmetterer, L. (Eds.) Proceedings in Computational Statistics, Physica-Verlag, Vienna, pp. 101–110. 24. Hall, P. and Wilson, S.R. (1991). Two guidelines for bootstrap hypothesis testing. Biometrics, 47, 757–762. 25. Hawkins, D.M. and McLachlan, G.J. (1997). High breakdown linear discriminant analysis. Journal of the American Statistical Association, 92, 136–143. 26. He, X. and Fung, W.K. (2000). High breakdown estimation for multiple populations with applications to discriminant analysis. Journal of Multivariate Analysis, 72, 151–162. 27. Huber, P.J. (1981). Robust Statistics. New York: Wiley. 28. Hubert, M. and Van Driessen, K. (2004). Fast and robust discriminant analysis. Computational Statistics and Data Analysis, 45, 301–320. 29. Krasker, W.S. and Welsch, R.E. (1982). Efficient bounded influence regression estimation. Journal of the American Statistical Association, 77, 595–604. 30. Lopuha¨ a, H. (1989). On the relation between S-estimators and M-estimators of multivariate location and covariance. The Annals of Statistics, 17, 1662–1683. a, H. (1992). Multivariate tau-estimators. Canadian Journal of Statistics, 19, 307–321. 31. Lopuha¨ 32. Markatou, M., Stahel, W. and Ronchetti, E. (1991). Robust M-type testing procedures for linear models. In Directions in robust statistics and diagnostics, Part I, pp. 201–220, IMA Vol. Math. Appl., 33, Springer, New York. 33. Maronna, R.A. (1976). Robust M-estimators of multivariate location and scatter. The Annals of Statistics, 4, 51–67.
44
Mat´ıas Salibi´ an-Barrera et al.
34. Omelka, M. and Salibian-Barrera, M. (2006). Uniform asymptotics for S- and MM-regression estimators. Unpublished manuscript. Available on-line at http://hajek.stat.ubc.ca/~matias/pubs.html. 35. Randles, R.H., Broffitt, J.D., Ramsberg, J.S. and Hogg, R.V. (1978). Generalized linear and quadratic discriminant functions using robust estimators. Journal of the American Statistical Association, 73, 564–568. 36. Rocke, D.M. and Downs, G.W. (1981). Estimating the variances of robust estimators of location: influence curve, jackknife and bootstrap. Communications in Statistics, Part B – Simulation and Computation, 10, 221–248. 37. Rousseeuw, P.J. and Leroy, A.M. (1987). Robust Regression and Outlier Detection. New York: Wiley. 38. Rousseeuw, P.J. and Molenberghs, G. (1993). Transformation of non positive semidefinite correlation matrices. Communications in Statistics, Part A - Theory and Methods, 22, 965–984. 39. Rousseeuw, P.J., Van Aelst, S., Van Driessen, K. and Agullo, J. (2004). Robust multivariate regression. Technometrics, 46, 293–305. 40. Rousseeuw, P.J. and Yohai, V.J. (1984). Robust regression by means of S-estimators. In Robust and Nonlinear Time Series. (J. Franke, W. Hardle and D. Martin, eds.). Lecture Notes in Statist., 26 256-272. Berlin: Springer-Verlag. 41. Salibian-Barrera, M. (2000). Contributions to the Theory of Robust Inference. Unpublished Ph.D. Thesis. University of British Columbia, Department of Statistics, Vancouver, BC. Available on-line at ftp://ftp.stat.ubc.ca/pub/matias/Thesis. 42. Salibian-Barrera, M. (2005). Estimating the p-values of robust tests for the linear model. Journal of Statistical Planning and Inference, 128, 241–257. 43. Salibian-Barrera, M. (2006a). The asymptotics of MM-estimators for linear regression with fixed designs. Metrika, 63, 283-294. 44. Salibian-Barrera, M. (2006b). Bootstrapping MM-estimators for linear regression with fixed designs. Statistics and Probability Letters, 76, 1287-1297. 45. Salibian-Barrera, M., Van Aelst, S. and Willems, G. (2006). PCA based on multivariate MM-estimators with fast and robust bootstrap. Journal of the American Statistical Association, 101, 1198–1211.
Fast and Robust Bootstrap
45
46. Salibian-Barrera, M. and Yohai, V. (2006). A fast algorithm for S-regression estimates. Journal of Computational and Graphical Statistics, 15, 414–427. 47. Salibian-Barrera, M. and Zamar, R. H. (2002). Bootstrapping robust estimates of regression. The Annals of Statistics, 30, 556–582. 48. Singh, K. (1998). Breakdown theory for bootstrap quantiles. The Annals of Statistics, 26, 1719–1732. 49. Stromberg, A.J. (1997). Robust covariance estimates based on resampling. Journal of Statistical Planning and Inference, 57, 321–334 50. Tatsuoka, K.S. and Tyler, D.E. (2000). The uniqueness of S and M-functionals under non-elliptical distributions. The Annals of Statistics, 28, 1219–1243 51. Van Aelst, S. and Willems, G. (2004). Multivariate regression S-estimators for robust estimation and inference. Technical report, available at http://users.ugent.be/~svaelst/publications.html. 52. Van Aelst, S. and Willems, G. (2005). Multivariate regression S-estimators for robust estimation and inference. Statistica Sinica, 15, 981–1001. 53. Yohai, V.J. (1987). High breakdown-point and high efficiency robust estimates for regression. The Annals of Statistics, 15, 642–656. 54. Yohai, V.J. and Zamar, R.H. (1988). High breakdown-point estimates of regression by means of the minimization of an efficient scale. Journal of the American Statistical Association, 83, 406–413. 55. Yohai, V.J. and Zamar, R.H. (1998). Optimal locally robust M-estimates of regression. Journal of Statistical Planning and Inference, 64, 309–323.


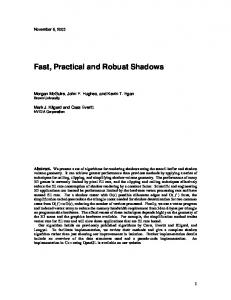


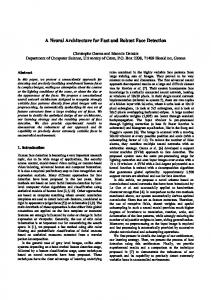


![[ujm-00374332, v1] Fast and Robust Image Matching ... - CiteSeerX](https://m.moam.info/img/260x300/ujm-00374332-v1-fast-and-robust-image-matching-cit_59e3c5ad1723dde4690ae2c0.jpg)