Proceedings of the 7th International Conference on Functional-Structural Plant Models, Saariselkä, Finland, 9 - 14 June 2013. Eds. Risto Sievänen, Eero Nikinmaa, Christophe Godin, Anna Lintunen & Pekka Nygren. http://www.metal.fi/fspm2013/proceedings. ISBN 978-951-651-408-9.
Fast automatic method for constructing topologically and geometrically precise tree models from TLS Data Pasi Raumonen1*, Eric Casella2, Mathias Disney3, Markku Åkerblom1 and Mikko Kaasalainen1 Department of Mathematics, Tampere University of Technology, P.O. Box 553, 33101, Tampere, Finland 2 Sustainable Forestry and Climate Change, Forest Research Agency, Surrey GU10 4LH – UK 3 Department of Geography, University College London, London WC1E 6BT, United Kingdom
1
*correspondence:
[email protected] Highlights: We present a computational method that produces automatically precision models of trees from terrestrial laser scanning (TLS) data. The method is fast, typically few minutes per tree, and the resulting model contains both the topological and geometrical information of the tree. The method is validated using artificial and real TLS data. The results show that TLS together with computational reconstruction method provides fast and nondestructive means to collect structural information of trees. Keywords: Tree models, TLS, topological branching structure, branch size distribution INTRODUCTION Scanning the surface of a tree with terrestrial laser scanning (TLS) produces easily and quickly a point cloud with millions of measurements, which form a dense and comprehensive sample of the tree surface. The sample contains information of the topological and geometrical structure of the measured tree. Retrieving this information requires computational methods to process the data (van Leeuwen et al.). We have presented a fast and automatic method producing a tree model containing practically any external structural information of woody parts of the tree (Raumonen et al., Åkerblom et al.). In the method the point cloud is segmented into trunk and branches and then the segments are approximated flexibly with multiple cylinders or their generalizations such as cones. From the resulting tree model one can approximate e.g. the volumes, lengths, and taper of trunk and branches, branch size distribution, branching angles and frequency, branching structure, etc. The method works even when there are some small gaps in the measurement cover and the trunk and branches are not measured all around. THE METHOD In the method the point cloud is first partitioned into small subsets corresponding to connected patches on the tree surface. These subsets form easy-to-handle sample of the tree surface and their size needs to be small enough to capture all the details. Geometrical and topological properties of the sets, such as the neighborrelation and underlying branch direction, are easy to determine. With these known local details the unknown global tree structure can be reconstructed. First, possible points not part of the tree, such as the measurements from the ground, are automatically removed and the base of the trunk is determined. Because some branches will often shadow other parts of the tree, there are often lots of gaps in the measurement cover and thus the subsets are in multiple connected components. To get the subsets into one component, connections between close by components are formed by updating the neighbor-relation. Then using the neighbor-relation, one can locally expand along the tree surface and recognize bifurcations. This way the subsets are automatically partitioned into segments corresponding to pieces of the trunk and branches: each segment is connected and has no bifurcations, ideally corresponding to a real branch (see Figs. 1 and 2). The segmentation starts from the base of the trunk and proceeds hierarchically separating each branch from its sub-branches. Next the surface of every segment is reconstructed with cylinders using least squares fitting. Also generalized cylinders such as cones and deformed cylinders can be used for the surface reconstruction. Finally, possible gaps between cylinders can be filled with new cylinders and the branching structure can be updated. VALIDATION For validation and controlled testing of the reconstruction method we will use an artificial tree model with simulated scanning to produce point clouds. We also use a real eucalyptus tree (see Fig. 2) and laser scanning in a laboratory. The 3D structural tree model used here represents a 30 yr old Scots pine tree (see
89
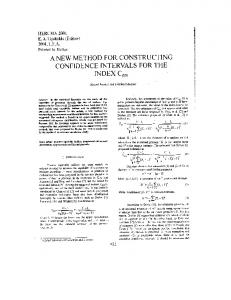
Fig. 1. Segmented point cloud (left) and the reconstructed cylinder model (right) of the artificial Scots pine. The point cloud contains measurements from tree scanning positions. Model reconstruction time: 8 min. Fig. 1). The model is generated using an empirical growth model parameterized by species-dependent branching statistics in conjunction with specified external environmental conditions (Leersnijder). TLS point clouds were simulated using the librat Monte Carlo ray tracing code (Disney et al.). For the artificial tree model we know the cylinders defining it, thus we know all the same attributes as in our reconstructed models. In the eucalyptus the mass (corresponds to volume) of the branches and the trunk is measured. We will test how well the reconstructions correspond to original tree attributes (geometrical and topological) and how the reconstructions depend on the number of scanning positions and density. For the eucalyptus we have used 1 to 4 scanning positions and three different scanning resolutions with angular sampling resolutions of 0.036 (low), 0.018 (mid) and 0.009 (high) degrees. RESULTS AND DISCUSSION Figs. 1 and 2, showing the segmented point clouds and the reconstructed models, show that most of the tree structures are reconstructed faithfully. Particularly for the pine the reconstruction and original model have 100 and 99 first order branches, respectively. The reconstructions of the trunk and large branches are nearly perfect. For the smallest pine branches the measurement cover is too sparse to get meaningful reconstructions (cf. branch lengths and number of branches in Table 1). For the eucalyptus the results (see Table 1) show that the more scanning positions the better the cover is and more branches are revealed. Similarly for the scanning density: higher density reveals more branches. The volume and length of the trunk are quite well reconstructed in all cases. For branches the reconstructed volume is much larger compared to the measured one, but the situation is more complex. Most of the branches in this case are smaller or comparable with the size of the laser spot, which is about few millimeters in size. Also there is few millimeters error when different scans are registered into one coordinate system. Thus in this case the reconstruction of the radius and thus the volume is not accurate for branches. However, the branching structure and the lengths of the branches can be still reconstructed with much less error. 90
Fig. 2. Segmented point cloud (left) and the reconstructed cylinder model (right) of the eucalyptus fixed in a stand. The point cloud contains measurements from three high-resolution scans. Model reconstruction time: 30 sec. Table 1. Some tree attributes for the pine and eucalyptus. For the eucalyptus there is measured values and reconstructed values with 1, 2, 3, and 4 scanning positions with “high” resolution and also for 2 scanning positions there are reconstructed values for “low” and “mid” resolutions. Pine original Pine reconstructed Euca measured Euca 1 pos. high res. Euca 2 pos. high res. Euca 3 pos. high res. Euca 4 pos. high res. Euca 2 pos. mid res Euca 2 pos. low res.
tot. vol. (dm3) 651 758 3.7 6.6 7.1 6.7 9.5 7.4 8.6
trunk vol. (dm3) 348 349 3.2 3.6 3.0 2.8 2.8 2.8 2.6
branch vol. (dm3) 303 409 0.5 3.0 4.1 3.9 6.7 4.6 6.0
trunk length (m) 17.2 17.2 4.5 4.5 4.5 4.5 4.5 4.5 4.4
branch length (m) 2623 2109
Number of branches 13607 7799
62 77 82 87 48 26
137 209 255 317 94 41
ACKNOWLEDGEMENT We thank Sanna Kaasalainen and Harri Kaartinen for providing measured TLS data from trees for development and validation of the method. LITERATURE CITED Disney M, Lewis P, Saich P. 2006. 3D modelling of forest canopy structure for remote sensing simulations in the optical and microwave domains. Remote Sensing of Environment. 100: 114-132. Leersnijder R.P. 1992. PINOGRAM: A pine growth area model. WAU dissertation 1499, Wageningen Agricultural University, The Netherlands. van Leeuwen M, Nieuwenhuis M. 2010. Retrieval of forest structural parameters using lidar remote sensing. European Journal of Forest Research. 129: 749-770. Raumonen P, Kaasalainen M, Åkerblom M, Kaasalainen S, Kaartinen H, Vastaranta M, Holopainen M, Disney M, Lewis P. 2013. Fast Automatic Precision Tree Models from Terrestrial Laser Scanner Data. Remote Sensing. Åkerblom M, Raumonen P, Kaasalainen M, Kaasalainen S, Kaartinen H. 2012. Comprehensive quantitative tree models from TLS data. Geoscience and Remote Sensing Symposium (IGARSS) 2012, 6507-6510.
91