Fast Content Based Color Image Retrieval System Based on Texture Analysis of Edge Map Hesamoddin Salehian1, Fatemeh Zamani1, Mansour Jamzad1 1
Department of Computer Engineering, Sharif University of Technology, Tehran, Iran
{salehyan, f_zamani}@ce.sharif.edu,
[email protected]
Abstract— in this paper we propose a method for CBIR based on the combination of texture, edge map and color. As texture of edges yields important information about the images, we utilized an adaptive edge detector that produces a binary edge image. Also, using the statistics of color in two different color spaces provides complementary information to retrieve images. Our method is time efficient since we have applied texture calculations on the binary edge image. Our experimental results showed both the higher accuracy and lower time complexity of our method with similar related works using SIMPLIcity database. Keywords- content based image retrieval; texture;
edge map.
I.
INTRODUCTION
Digital image databases have been widely used in recent decades. As a result the need for efficient storage and retrieval methods for large image databases has been increased. Image searching is a routine task in these databases for which there are two main approaches: the first uses image textual metadata and the second approach, uses image content information. The first approach needs human to describe every image in the database; it seems to be impossible for very large collections, unless there are some reliable automatic image tagging or image annotation methods. Thus, Content Based Image Retrieval (CBIR) is the main solution for this problem [1]. CBIR has a wide variety of applications in medical diagnosis, crime prevention, geographic information and remote sensing. In a CBIR system, digital image processing techniques are used to extract a feature vector based on low level properties of the image, like color, shape and texture. Connecting low-level visual features to high-level semantic concepts is an ongoing problem which should be considered. A solution to this problem is given in [2]. The organization of the paper is as follows. Section 2 includes a literature review of the problem. Section 3 explains color and texture extraction analysis methods used in our approach. Section 4 explains our experimental results and provides a number of comparisons between our proposed method and other
related methods. Finally we conclude our work in section 5.
II.
RELATED WORKS
Wide variety of approaches has been used in image retrieval. These approaches have different costs and complexities. Two commonly used techniques are based on color and texture. Color histogram, is one of the earliest algorithms based on the color information of image. Although this method has low computational cost but it does not provide any information about the spatial distribution of colors. Color correlogram, is another useful technique in which the relation between different color levels is considered in spatial domain. Despite of its advantages, color correlogram depends on scaling, and illumination changes [3]. On the other hand, there are several approaches based on image textural information. Co-occurrence matrix and Gabor filter are two such methods that have been used many times [4]. Despite of their high performance, they have high computational complexity [5]. Another common approach in feature extraction is analyzing edges of image. Jain and Vailaya [6] used a method based on edge directions. This method first finds the edges of the image and then quantizes them to build an edge direction histogram (EDH). The performance of this approach is limited, because it does not consider the correlations between edges. Shanbehzadeh [7] improved this method and considered correlations between neighboring edges by using a weighted function. The result was a directional histogram of similar edges (DHSE). Mahmoudi, presented a new progressive method in this area in [8]. In this method, orientations of edges are quantized and organized in an auto-correlogram matrix and an edge orientation auto-correlogram is produced (EOAC).
III.
FEATURE EXTRACTION
The basis of the proposed method is to extract a binary edge map from edges of the image and then analyze the edge map as a texture. This approach results a reduction in computational complexity. Moreover, we have used statistical parameters in two color spaces. In the following subsections we will explain the extracted features in more detail. 1.
Texture of Edge Map
Extracting texture from the edge map of image involves two phases: Edge Detection and Texture Extraction.
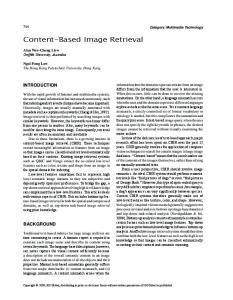
(a) (b) (c) Figure 1: A comparison between the result of Canny edge detector for two values for σ, (a) Original image (b) Result for σ = 0.1, (c) Result for σ = 3
A. Edge Detection The overall content of an image can be described by its major edges and boundaries. This is why we first compute a binary image involving the major edges. This causes a considerable reduction in the amount of data in an image while preserving its important overall structural features. We have used Canny edge detector, because it has numerous advantages in comparison with classical methods, such as Sobel, Prewitt and Roberts due to its option of defining a standard deviation threshold σ which produces an edge image related to input parameter σ. In addition, Canny has better performance on a noisy images and it uses a probability to find the error rates which causes more precision in detecting edges [9]. Canny edge detector first applies a Gaussian filter on the original image. The filter can be obtained by the following equation.
G ( x, y ) e 2
(
x2 y 2 ) 2 2
(1)
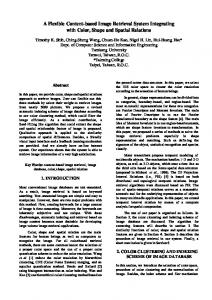
where G is the value of Gaussian filter in coordination (x, y) and σ is its standard deviation. Varying the value of σ produces different edge maps. Using large values for σ, more details are discarded from image, while small σ provides a lot of detailed information. Figure 1 has shown this fact on an image. Adaptive calculation of standard deviation for canny edge detector is determined by the level of detail or complexity of the image. Figure 2 shows three examples for images with low, medium and high detail. There are several methods to calculate the image complexity. In this paper we have used the following equation for complexity:
(a) (b) (c) Figure 2: A comparison between different levels of complexity, (a) low, (b) medium and (c) high
image
1 MN
N
M
( I (i, j) mean)
2
(2)
i 1 j 1
where I shows grayscale representation of a given image and M, N are its dimensions. Also, image and mean are the standard deviation and the mean of intensities in I, respectively. We have used an adaptive approach to obtain the appropriate value for σ used in Canny edge detector where the value of σ is obtained according to the level of image complexity. For an image with high level of complexity, the standard deviation of its grayscale representation is large. On the other hand, we need to keep enough information about the detail of an image. For example Figure 1(b) is more suitable as an edge map than Figure 1(c) in retrieval purposes; because it better represents the high complexity in the original image, while Figure 1(c) represents a highly simplified version of edges in the original image. Therefore the value of σ should be small enough for complex images. As a conclusion, there is an inverse relation between the standard deviation of intensities in input image and the standard deviation used by Canny. We have modeled this relation by the following equation:
canny
C
image
(3)
where 𝝈canny is the standard deviation which is used in Canny filter for the given image according to its level of detail or complexity, and 𝝈image shows the standard deviation for grayscale representation of input image. The constant C is obtained by experience and has been set to 100 in our work. B. Texture Extraction We have used two texture analysis techniques: cooccurrence matrix and Gabor filter. Co-occurrence matrix extracts texture information relevant to higher frequency components more accurately, while Gabor filter is more powerful in extracting lower frequency components [5]. Therefore, by fusion of these two techniques, both low and high frequencies analysis can be obtained. a) Co-occurrence Matrix As described in [4], co-occurrence matrices of an image I for a certain ∆x and ∆y are obtained by the following equation.
Especially its L component closely matches human perception and it is useful in closing the semantic gap in CBIR. Moreover, several works have used RGB color space as well. We have extracted statistical values of the two mentioned color spaces. These values include the first, the second and the third moments. Mean is the first statistical moment. Although the mean of a colored image holds some information about its color features, but it is not enough. In this regard, we used the standard deviation and skewness as well, according to the following equations:
mean
std
N
M
1 MN
I (i, j )
1 MN
N
skewness
(7)
i 1 j 1 M
( I (i, j) mean)
2
(8)
i 1 j 1
3
1 MN
N
M
( i 1 j 1
I (i, j ) mean 3 ) (9) std
(4) b) Gabor Filter This texture extraction technique can find the texture information of an image in a given orientation and frequency. In general, a Gabor filter is defined according to this equation.
where I refers to one of color channels of an input image and M, N are its dimensions, in all equations above.
IV.
where x and y are rotated versions of x and y. Θ and f represent the orientation and frequency. Also, σx and σy are standard deviations of Gaussian function. We did not use Gabor features directly. Instead, we used the energy of each filtered image with the following equation: N
M
E real (G (i, j ))2
(6)
i 1 j 1
where G stands for the Gabor filtered image and M and N are the dimensions of the image. It is important to note that imaginary values of Gabor transform are not important in image retrieval [10], thus they have been discarded.
2.
EXPERIMENTAL RESULTS
y 2
G( x, y, , f ) exp([1/ 2{( x ) ( y ) }]) cos(2 xf ) (5) x 2
Color Features
We have used RGB and L*a*b* color spaces, because it is a uniform perceptual color space [11].
Feature vector of each image consists of the following parts: Three statistical parameters are calculated for each channel of RGB and L*a*b* channels. Therefore totally, 18 features for color are generated. An edge detection stage is applied using Canny edge detector which its standard deviation is found adaptively. Co-occurrence matrices are computed on the binary image resulted by Canny operator, by using 12 pairs of (∆x, ∆y): (0, d), (-d, d), (d, 0) and (-d, -d) where d=1, 2 and 3. It will result 12 matrices with the size 2x2 (e.g. co-occurrence matrix of a binary image is always of size 2x2) and totally 48 real numbers. Finally, 10 Gabor filters are applied to the binary edge map. We have used 2 orientations (0° and 90°) and 5 frequencies (4√2, 8√2, 16√2, 32√2 and 64√2), because these values have optimal performance [10]. We also have set the standard deviations in Eq. 4. to 1. Then, the energy of each output matrix is computed and stored as vector with 10 components.
Table 1 shows the number of features of each visual descriptor in our proposed feature vector. All of the obtained values are normalized in [0,1] before further calculations.
where nk represents the number of relevant images within the first k retrieved images. A comparison between the results of the designed system and the system proposed in [3] for all categories are summarized in the Table 2. Figure 3 shows the retrieval results for two query images, of two different categories.
Table 1: The number of each visual descriptor in the vector Visual Descriptor
Number of
Table 2: Comparison between average precisions of Texture Analysis of Canny Edge Map and Wavelet Correlogram [3]
Features Color
18
Co-occurrence Matrix
48
Gabor Filter
10
Total
76
Category
The system works as follows: the feature vectors for all images in the database were calculated and saved. Then for each query image, the first N most similar images with the least Euclidean distances to the given image were retrieved. The proposed method has been tested on SIMPIcity database. This database contains 1000 images of 10 categories. The images are of sizes 256×384 or 384×256. We have used MATLAB 7 to implement the system and have run it on a Pentium IV processor. The feature extraction time for the entire database lasts 10 minutes which is surprisingly less than other presented methods using texture [3], [7] and [8]. For example, the method described in [3] consumes hours to extract feature vectors, as it applies wavelet transform on the entire image. (i.e. our implementation of [3] on all 1000 images using MATLAB and using the same computer as we implemented our method, took about 50 hours. However, we may assume some in-efficiency in our implementation of [3], but it is clear that [3] has more computational complexity due to its wavelet implementation compared to our method that simply uses a Canny edge detector and analysis its binary edge map) We have used the following two parameters to evaluate the accuracy of the system: precision and weighted precision. The precision of the system for a query image I is obtained by the following equation: | Y (I ) | (10) N where Y(I) is the set of N retrieved images which are in the same category as the query image. We have chosen N=10 to be able to compare the results with previously used methods. The weighted precision is a quantity to measure the rank of the relevant images and is obtained by the following equation: P( I )
WP( I )
1 N
N
nk
k k 1
(11)
Africa people & villages Beach Buildings Buses Dinosaurs Elephants Flowers Horses Mountains & glaciers Food
Total
Proposed
Wavelet
Method
Correlogram
0.63
0.63
0.64 0.45 0.78 0.99 0.74 0.92 0.92 0.50
0.61 0.59 0.90 0.86 0.64 0.89 0.83 0.50
0.74 0.73
0.64 0.71
Table 3 compares the proposed system with some other methods tested on SIMPLIcity database. The main advantage of our method is that it has a considerably less running time compared with most other proposed methods, while it provides better performance. Table 3: Comparison of Different Image Retrieval Systems1 Method
Feature Vector
Precision
Size (bytes)
Weighted Precision
WBIIS
>768