Fast Cross-correlation based Wrist Vein Recognition. Algorithm with Rotation and Translation. Compensation. Olegs Nikisins, Teodors Eglitis, André Anjos, ...
Fast Cross-correlation based Wrist Vein Recognition Algorithm with Rotation and Translation Compensation Olegs Nikisins, Teodors Eglitis, Andr´e Anjos, S´ebastien Marcel
Abstract—Most of the research on vein biometrics addresses the problems of either palm or finger vein recognition with a considerably smaller emphasis on wrist vein modality. This paper paves the way to a better understanding of capabilities and challenges in the field of wrist vein verification. This is achieved by introducing and discussing a fully automatic crosscorrelation based wrist vein verification technique. Overcoming the limitations of ordinary cross-correlation, the proposed system is capable of compensating for scale, translation and rotation between vein patterns in a computationally efficient way. Introduced comparison algorithm requires only two cross-correlation operations to compensate for both translation and rotation, moreover the well known property of log-polar transformation of Fourier magnitudes is not involved in any form. To emphasize the veins, a two-layer Hessian-based vein enhancement approach with adaptive brightness normalization is introduced, improving the connectivity and the stability of extracted vein patterns. The experiments on the publicly available PUT Vein wrist database give promising results with FNMR of 3.75% for FMR ≈ 0.1%. In addition we make this research reproducible providing the source code and instructions to replicate all findings in this work.
I. I NTRODUCTION Among a vast variety of modalities, vein biometrics has a number of motivating points: it is easily collectable, nonintrusive, unique, can be used in a non-contact manner and is challenging to spoof leaving no latent marks. These properties have attracted a lot of attention both from research and industrial communities with a high emphasis on palm and finger vein recognition systems. Probably, the most known R industrial players in the field are Fujitsu PalmSecure and R
Hitachi VeinID , designing palm and finger vein recognition systems respectively, which are already well deployed in many security-sensitive applications. At the same time, the smart watch industry paves the way to introduce biometrics in wearable devices, considering wrist veins as a modality with high usability potential. In contrast to industrial interest, wrist vein biometrics is not sufficiently explored in scientific literature, which is also highlighted in most recent published work [1]. To bridge this gap, current paper introduces a robust cross-correlation based fully automatic wrist vein verification algorithm. The recognition system is designed to be robust to two specific challenges in vein recognition: noise and pose [2]. The noisy and low contrast images are caused by active imaging in near-infrared (NIR) spectrum.
Preprocessing Input
Feature extraction
Comparison
Similarity score
Idiap Research Institute Rue Marconi 19, CH - 1920, Martigny, Switzerland Email: {olegs.nikisins, teodors.eglitis, andre.anjos, sebastien.marcel}@idiap.ch
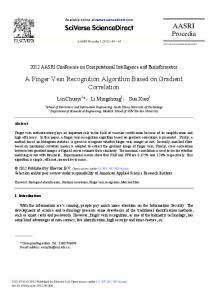
Fig. 1. The block-diagram of the proposed automatic wrist vein verification system.
The appearance of veins is further affected by such factors as ambient air temperature and lighting, thickness and color of the skin, body constitution. As a result, the input images usually suffer from low signal to noise ratio and non-uniform brightness. Therefore various image processing techniques are mandatory for quality improvement. The pose challenge is coming from the way the data subjects are presented to the system. Significant geometrical transformations among images are common for unconstrained and contactless image capturing approaches, which is true for the database used in the evaluation experiments of this paper. The structure of the proposed algorithm follows the block-diagram in Figure 1. The system is composed of three main units: 1) preprocessing and Region Of Interest (ROI) extraction; 2) feature extraction / vein segmentation; 3) comparison stage. In our case, the feature extraction unit is designed to deal with noise and low contract issues, while the pose is compensated in preprocessing and comparison stages. These modules are discussed in the following paragraphs. The main task of the preprocessor is to find the ROI in the input image. In palm and finger vein recognition systems, characteristic points of the palm contour, such as finger gaps and tips, are usually involved in the ROI localization [3], [4], [5]. Authors in [3] applied the same strategy using wrist joints as referencing points for ROI detection in the wrist images. In our case, no referencing points are present in images. Instead, ROI detection is based on an empirical observation: in active NIR imaging systems the wrist region usually appears as a bright spot in the darker background. Therefore, our proposed ROI detection method is based on adaptive thresholding of gray-scale values presented in the image. Additionally, scale normalization and image centering is done in the preprocessing
stage minimizing geometrical transformations between the images to be compared. The introduced preprocessing unit is discussed in Section II-A. In this paper the network of wrist veins is used as features for recognition. Therefore the task of the feature extraction module is to segment veins in the input image. The literature on vein segmentation is vast with many methods developed for biometric and medical applications [6]. Algorithms can be classified as matched-filter based [7], Hessian / curvature based [8], [6], [9], and machine learning methods [6]. There is a number of attempts to use an enhanced structure of the veins in wrist vein recognition tasks. Authors in [1] use Maximum Curvature Points (MCP) [8] and matched filters [7] in combination with cross-correlation based comparison. Kabacinski and Kowalski in [10] demonstrate that even simple vein segmentation strategies can cope with the task fairly well. Authors obtain a binary pattern thresholding a smoothed input image. In this work both binary and gray-scale vein patterns are discussed and employed in experiments. The selected binary extractor is MCP [8]. The proposed gray-scale vein extractor is Hessian-based with an additional brightness normalization, which is discussed in Section II-B. The task of the comparison stage is to compare two extracted vein patterns. Previous research on wrist vein recognition can be classified into cross-correlation versus machine learning based methods [11], [3], [1]. The most recent publication in the field [1] covers both of these comparison approaches. Authors propose a physical set-up for the collection of wrist vein images and demonstrate the performance of a number of algorithms on the collected database. The data was acquired using the device with wrist positioning stand minimizing the displacements of the subject. Despite the fact that wrist a positioning stand was used, authors report low performance for the methods based on cross-correlation of local features, such as MCP and matched filters. This fact can be explained with limitations of cross-correlation methods being robust to translation only. The database used in this work is not publicly available, limiting reproducibility potential. Another cross-correlation based recognition algorithm is introduced in [10]. In the comparison stage the cross-correlation of two images is computed iteratively rotating the probing sample in the range of [−15◦ , 15◦ ] with 1◦ steps. The gain of the approach is robustness to both translation and rotation, which comes at a cost of computational inefficiency. In this paper authors introduce the PUT Vein database of palm and wrist vein images and report global results. The database contains 1200 NIR images of both wrists of 50 individuals. A drawback of [10] is the absence of clear evaluation protocol, nor separate recognition performance is provided for the wrist vein modality. There is also a number of cross-correlation based methods using vein minutiae points instead of entire vein patterns [2]. Authors propose to extract characteristic minutiae points - the ending and branch points in the skeletonized structure of the veins. Vein minutiae are then transformed into translation and
scale invariant representation, where rotations can be compensated as-well. In fact, the transformation is a Fourier spectrum of minutia pattern sampled in the log-polar coordinates. The similarity score is the normalized cross-correlation computed for two log-polar spectra of minutiae patterns. To compensate for the rotation, the horizontal circular shift of spectra is used raising the time complexity of the comparison stage. The wrist-related results are reported for the UC3M [12] database, which is relatively small with 348 NIR vein images of 29 data subjects. The main contribution of this paper is the proposed crosscorrelation based comparison principle capable of compensating both translation and rotation between vein patterns in a computationally efficient manner. The introduced comparison algorithm requires only two cross-correlation operations in the Fourier domain to compensate for both translation and rotation, regardless of the number of observed angles. In contrast, in the classical approach, namely cross-correlating with rotated templates, the number of cross-correlation operations is equal to the number of observed angles. Moreover, the well known and less computationally efficient comparison approach, utilizing the properties of log-polar transformation of Fourier magnitudes [13], [2], is not involved in any form, making our method, to the best of our knowledge, unique. The algorithm can cope with both binary and gray-scale vein patterns in the input. The detailed description of the approach is given in Section II-C. The supportive preprocessing and feature extraction units are developed as-well, demonstrating the gain from the proposed comparison in the task of automatic wrist vein recognition. The output of the proposed feature extractor is a grayscale vein pattern. The well known MCP features are used to demonstrate the operation of our comparison algorithm in the case of binary inputs. The results reported in this work are fully reproducible: (i) the publicly available PUT Vein database is used in all experiments, (ii) the evaluation protocols are strictly defined and, finally, (iii) the source code and instructions to replicate all findings are available. The experimental results are summarized in Section III. II. P ROPOSED WRIST VEIN VERIFICATION SYSTEM This section is dedicated to the proposed wrist vein verification system discussing all the modules in details. The system is composed of three main units, (Figure 1): 1) preprocessing and ROI extraction; 2) feature extraction / vein segmentation; 3) comparison stage. The main tasks of the first module are ROI detection and scale normalization. The second unit highlights the structure of the veins in the input image, which is mandatory due to low signal to noise ratio. Finally, the comparison block, prior to score computation, compensates the rotation and translation between enrolment and probe samples. A. Preprocessing The ROI detection algorithm is briefly discussed in this section. The steps of the algorithm are as follows. First, the input image I ∈ Rm×n is smoothed using Gaussian filter with
(a)
(b)
(c)
(d)
(e)
(f)
Fig. 2. An example of the preprocessing and ROI extraction. From left to right: wrist image from PUT Vein database; centered and scaled image of the wrist, k = 0.2; binary mask of the ROI.
standard deviation σ. Next, Np points are uniformly selected from the smoothed image. The points are split into two clusters using a trivial k-means++ algorithm [14]. Applying clustering on the subset of pixels accelerates the computations, however the value of Np can’t be too small to ensure a proper convergence of k-means. The global threshold is computed as an average of two centroids produced by the clustering algorithm. The binary mask of the ROI is defined by pixels above threshold. If the number of disjoint blobs in binary mask of the ROI is larger than one, then only the largest blob is preserved removing the small ones. To compensate for the scale, both input image and ROI are scale-normalized. Scale normalization makes the area of ROI k times smaller comparing to the area of the input image. Parameter k is fixed. Centering is next applied to both scaled input image and scaled ROI aligning the center of mass of ROI with the center of the image. An example of ROI and correspondingly preprocessed input image are displayed in Figure 2. The ROI is of an arbitrary shape, similar to the idea in [4], maximizing the area to extract the vein pattern from. B. Feature extraction This section is dedicated to a brief description of the proposed vein segmentation algorithm. The segmentation algorithm is Hessian-based producing a gray-scale vein pattern with a normalized intensity. A brief description of the approach is given next. First, the Hessian matrix is computed for each pixel in the smoothed input image. The smoothing is done using Gaussian filter parametrised by standard deviation σ. The Hessian matrix describes second order intensity variations around each pixel. Next, the eigenvalues of Hessian matrices are computed. Eigenvalues reflect the curvature in principal orientations for a given position. The image with highlighted veins is obtained selecting the maximum eigenvalue of Hessian matrices. At this point the image with highlighted veins is the result of onelayer vein enhancement. To segment the veins in the image of eigenvalues, the elements below mean are set to zero, see example in Figure 3 (b). To enhance the veins even further, a two-layer processing is proposed. In this case, the intensity values in the image of eigenvalues are inverted making the veins dark in the brighter background. Next, all operations of one-layer vein enhancement are applied to the image of inverted eigenvalues. The result of this operation is shown in Figure 3 (d). Veins
Fig. 3. Vein segmentation example: (a) input image; (b) segmented veins pattern, one-layer case; (c) normalized veins pattern, one-layer case; (d) enhanced veins image before thresholding, two-layer case; (e) segmented veins pattern after thresholding, two-layer case; (f) normalized veins pattern, twolayer case.
(a)
(b)
(c)
(d)
Fig. 4. Feature comparison example: (a) enrolled vein pattern Ve ; (b) sum of pre-rotated enrolment patterns after cropping Sec ; (c) result of crosscorrelation of Sec and probe; (d) probe vein pattern Vp .
are expected to have positive curvature. Therefore, to segment veins after two-layer enhancement, negative values of are set to zero, see the result in Figure 3 (e). The gain of the proposed two-layer processing is: better connectivity of the veins, sustainability to non-vein artefacts, see (b)(c) vs. (e)(f) in Figure 3. To compensate the uneven brightness of blood vessels, Figure 3 (e), the following normalization procedure is introduced. The disjoint peaks are detected in every row of the vein image and normalized so as the value of the maximum of the peak becomes 1. The peaks (veins) in a row are disjoint by a set of zeros. The same normalization procedure is also done columnwise and for two 45◦ diagonals of the veins image. All the normalized matrices are then stacked giving the 3D matrix. To find the final normalized image of the veins the maximum is determined along the dimension corresponding to the number of normalized images. The resulting normalized vein patterns are displayed in Figure 3 (c) and (f) for one-layer and twolayer vein segmentation strategies respectively. C. Feature comparison In the comparison stage two extracted vein patterns, namely enrolment and probe samples, are compared. The details of the proposed approach are discussed next. Let’s introduce the following notations: Ve and Vp representing the vein patterns of the enrolment and probe sample
respectively, as shown in Figure 4 (a) and (d). First, the enrolment sample Ve is rotated around the center in the specified range of angles [α1 , αk ] with an angular step of ∆α , producing a set of rotated enrolment images Ve : Ve = {Ve,α1 , Ve,α2 , . . . , Ve,αk }
(1)
The elements of the set Ve from (1) are next summed up: X X (2) Se = X∈Ve
The dimensionality of Se and Ve is identical Se = (se,ij ) ∈ Rm×n . Next, Se is cropped leaving the central part of the image: Sec = (se,ij ), i = cv , . . . , m − cv , j = ch , . . . , n − ch . (3) In Equation (3) cv is the number of pixels to remove from top and bottom of the image, ch is the number of pixels to be removed from left and right. The dimensionality of Sec is (m − 2cv ) × (n − 2ch ), see an example in Figure 4 (b). The cross-correlation of Sec and Vp is computed next, which can be done efficiently using a Fast Fourier Transform (FFT). The position of the maximum in the crosscorrelation output, Figure 4 (c), defines the translation between the images. Furthermore, the proposed transformation of the enrolment sample Sec makes cross-correlation robust to the rotations in the [α1 , αk ] range of angles. No zero-padding is used in the cross-correlation operation. Therefore, parameters cv and ch define the maximum possible displacement in vertical and horizontal directions between the images Sec and Vp . At this point angle estimation between enrolled and probe vein patterns is done. Given the position rm = (xm , ym ) of the maximum in the cross-correlation, the probe Vp is cropped: Vpc = (vp,ij ), i = ym , . . . , ym + m − 2cv , j = xm , . . . , xm + n − 2ch .
(4)
The dimensionality of the cropped probe image becomes Vpc ∈ R(m−2cv )×(n−2ch ) . Next, all images in the set Ve are also cropped using the Equation (3) giving the set: Vec = {Vec,α1 , Vec,α2 , . . . , Vec,αk }
(5)
After cropping operations (4) and (5) the image Vpc is translation-registered (aligned) with all images in the set Vec . Next the image Vpc is compared to all images in the set Vec producing the angular scores: (m−2cv ) (n−2ch )
sα,l =
X
X
i=1
j=1
(Vpc ◦ Vec,αl )ij , l = 1, . . . , k
(6)
The symbol ◦ in (6) means element-wise multiplication. The maximum angular score in sα = (sα,i ) ∈ Rk points to the angle in α = (αi ) ∈ Rk , which is an estimated angle αep between enrolled and probe vein patterns. Given the angle αep the enrolment sample Ve is rotated matching the orientation of Vp . At this point the crosscorrelation based comparison inherited from [15] is used to
compute the similarity score. In this approach the enrolment sample is cropped similarly to the strategy adopted in the Equation (3) giving Vec . The cross-correlation of Vec and Vp is next computed. The maximum value of cross-correlation is denoted as cm , which has the position rm = (xm , ym ). With known rm the probe is cropped according to Equation (4). The cropped enrolment pattern Vec and probe Vpc are now registered both in terms of translation and orientation. The resulting similarity score: (m−2cv ) (n−2ch ) X X s = cm / (Vec + Vpc )ij (7) i=1
j=1
In the proposed comparison approach only two crosscorrelation operations are needed to compensate both the translation and rotation. In contrast, the exhaustive-search proposed so far requires the number of cross-correlations to be proportional to the number of search angles [10]. III. E XPERIMENTS Wrist vein verification experiments are conducted using the publicly available PUT Vein database [10], which, to the best of our knowledge, is the largest publicly available dataset of wrist vein images. There are two more datasets of wrist vein images were introduced in the literature [12], [1], however both of them are smaller than PUT Vein, with 348 images of 29 clients in [12], and 1000 images of 50 clients in [1]. Another limitation of database from [12] is that it was captured in one session. The database in [1] has two sessions, which is still less than in PUT Vein with 3 sessions. Moreover, it is not mentioned in [12], [1], that the databases are publicly available, nor the download links are provided. Thus, these databases are not included in the experiments. The PUT Vein database contains 1200 wrist vein images collected from both wrists of 50 individuals. In the proposed scenario each hand is considered as a separate client, therefore Nclients = 100. The data was collected in 3 sessions, Nsessions = 3, with at least one week interval between each session, capturing 4 images per session for each client/hand. Unfortunately, no evaluation protocol is described in [10]. Therefore, evaluation protocols are introduced in this paper paving the way for reproducibility. Two evaluations protocols are proposed, namely ”P 1” and ”P 4”. All protocols are split into development (”dev”) and evaluation (”eval”) sets. Images of the left wrist belong to the development set, while images of the right wrist form the evaluation set. Images in the ”eval” set are mirrored to better match the appearance of left wrists found on the ”dev” set. The development set is used to tune hyper parameters related to proposed recognition methods, while the evaluation set is solely used for reporting performance. One notable parameter estimated from ”dev” set is the recognition threshold related to the selected operational point of the system. The number in protocol names indicates how many enrolment images are used to produce a single similarity score, being 1 or 4. In the proposed experiments, a maximum score fusion strategy is used for protocol ”P 4”.
TABLE I P ROTOCOLS STATISTICS ( IDENTICAL FOR ” DEV ” AND ” EVAL ” SETS ).
Nenrolls 200 200
Nprobes 400 400
Ngenuine 1600 400
Nimpostor 78400 19600
FNMR (%)
Protocol P 1 P 4
20
P P P P
FNMR (%)
20
1 1 4 4
+ + + +
rotation compensation no rotation compensation rotation compensation no rotation compensation
0.1
1 FMR (%)
10
+ + + +
rotation compensation no rotation compensation rotation compensation no rotation compensation
0.1
1 FMR (%)
10
100
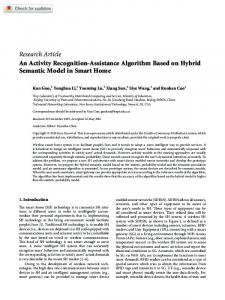
Fig. 6. ROC curves for different evaluation protocols, evaluation set. Features: proposed Hessian based gray-scale vein patterns. Comparison: solid lines proposed cross-correlation based approach; dashed lines - cross-correlation based algorithm [15].
10 0 0.01
1 1 4 4
10 0 0.01
30
P P P P
30
100
Fig. 5. ROC curves for different evaluation protocols, evaluation set. Features: MCP binary vein patterns. Comparison: solid lines - proposed crosscorrelation based approach; dashed lines - cross-correlation based algorithm from [15].
Sets ”dev” and ”eval” are further divided into enrolment and probe sub-sets. Images of the first session are considered to be enrolment samples, sessions 2 and 3 are probes. The resulting statistics containing the number of enrolment Nenrolls and probe images Nprobes as well as the number of genuine Ngenuine and Nimpostor comparisons/scores for different protocols is summarized in Table I. The statistics is identical for ”dev” and ”eval” sets having the same number of clients Nclients = 50 in each. In our experiments both binary and gray-scale vein patterns are tested as features to be compared. The comparison algorithms with and without compensation for the rotation are tested. The hyper-parameters of the system are tuned on the ”dev” set. The selected settings are discussed next. The preprocessing / ROI extraction (Subsection II-A) module is identical in all experiments. The specifications are: dimensions of the input image m = 1024, n = 768; σ = 1; Np = 10000; ROI area normalization constant k = 0.2. The corresponding preprocessing example is displayed in Figure 2. In the feature extraction stage both binary and gray-scale features are produced. In the case of the gray-scale vein extraction algorithm (Subsection II-B) two-layer processing and brightness normalization are enabled. The standard deviation of the Gaussian filter is σ = 9. The Maximum Curvature Points (MCP) [8] algorithm is used to extract the binary vein structures. The only parameter of the algorithm is standard deviation, which is also set to σ = 9. To estimate the gain of the proposed rotation compensation scheme, two comparison strategies are tested: cross-correlation based comparison inherited from [15] and the introduced approach (Section II-C). In both cases the enrolment sample cropping parameters are cv = 300, ch = 225 pixels, Equation (3). With rotation compensation the range of angles is [α1 = −10◦ , α2 = 10◦ ] with a step ∆ = 1◦ . In the case of
TABLE II FNMR AND HTER IN % REPORTED FOR THE evaluation SET GIVEN THRESHOLDS CHOSEN a priori ON THE development SET. T HRESHOLDS FOR THE REPORTED FNMR ARE ESTIMATED ON THE DEVELOPMENT SET FOR FMR=0.1 %. T HRESHOLDS FOR HTER ARE ESTIMATED ON THE DEVELOPMENT SET FOR THE EER OPERATION POINT.
Comparison: No rotation [15] Protocol ↓ FNMR HTER MCP features: P 1 26.06 9.58 P 4 12.00 5.86 Hessian-based features: P 1 20.19 13.89 P 4 8.25 7.76
Proposed FNMR HTER 10.00 3.75
9.26 3.58
13.13 4.75
12.93 6.20
binary images the veins are morphologically dilated with a disk-shaped structuring element of 3 pixels radius, reducing the negative effect of local perturbations. The ROC for the evaluation sets are plotted in Figure 5 for MCP features, and in Figure 6 for Hessian-based features, Subsection II-B. The False Match Rate (FMR) axis is plotted in logarithmic scale detailing the low range of false positives. The numerical performance results are also summarised in Table II reporting the False Non-Match Rate (FNMR) and the HTER (Half Total Error Rate) for different protocols of the ”eval” set of the database. The FNMR is computed given threshold, which is estimated on the ”dev” set for a value of FMR=0.1 %. The HTER is computed for threshold estimated on the ”dev” set for EER operation point. The paper [11], to the best of our knowledge, is the only one reporting recognition results using PUT Vein database. However, the precise evaluation protocol is unknown. First, no splitting into development and evaluation sets is introduced. Second, the all-vs-all strategy is used for score computation. In the most similar experiment authors use the first session to train the proposed system, while sessions 2 and 3 are used for testing. The reported EER is 1.23 %. However, based on the ROC curves provided in [11], the FNMR values for FMR≤0.1% are higher comparing to our results. Our proposed system is developed in Python using Bob library [16], [17] and was tested using Linux machine with
TABLE III E XECUTION TIMES FOR DIFFERENT PROCESSING STEPS .
Features: Processing step ↓ ROI + preprocessing Feature extraction No rotation comparison [15] Brute-force comparison [10] Proposed comparison
MCT time, s 0.37 1.10 0.12 2.71 0.26
Hessian-based time, s 0.37 0.62 0.12 2.71 0.30
when no rotation compensation is involved. Moreover, the multi-enrollment strategy, protocol ”P 4”, helps to boost the performance in all cases. ACKNOWLEDGMENT The authors would like to thank the Swiss Commission for Technology and Innovation (CTI) for supporting the research leading to results published in this paper. R EFERENCES
i7-5930K CPU and 32 GB of RAM. The source code1 is available. The timing for all steps of the proposed system is summarised in Table III. The comparison incorporating bruteforce/exhaustive search of the rotation angle is added, highlighting the gain of the introduced rotation robust comparison strategy. The speed-up is approximately of a factor of ×10. At the same time the comparison is just ×2.5 times slower than ordinary cross-correlation. IV. C ONCLUSION This work introduces a fully automatic wrist vein verification algorithm, capable of dealing with more realistic recognition scenarios. Moreover, to the best of our knowledge, this is the first paper paving the way to the reproducible research in the field of wrist vein verification. The proposed verification system is composed of three main modules: ROI extraction and preprocessing; feature extraction; comparison. In the first stage a methodology for the extraction of arbitrary shaped mask of the ROI is developed, maximizing the area to extract the veins from. Moreover a scale normalization is moved to this step, simplifying the comparison stage. Enhanced pattern of the veins is an output of the feature extraction module. In this step a two-layer Hessian-based vein enhancement is introduced improving the connectivity of the veins and minimizing the presence of non-vein artifacts in the output. Moreover an adaptive brightness normalization is proposed in extraction unit making the intensity of the veins uniform across the image. The main contribution of the paper is the cross-correlation based comparison capable of compensating both rotation and translation between the images in a computationally efficient way. The comparison is ∼ ×10 faster than the equally performing brute-force approach, and is just ×2.5 times slower than ordinary cross-correlation. The comparison is also capable of dealing with both binary and gray-scale inputs. The verification performance is promising demonstrating the applicability of wrist veins modality in biometric systems. The lowest HTER is 3.58% and FNMR = 3.75% for FMR ≈ 0.1%. The advantage of the discussed system is a stability across a wide range of FMR values, which is important in realistic applications. Interestingly, that in most cases techniques using binary patterns of the veins perform better. The gray-scale approaches give lower FNMR (FMR≤0.1%) only 1 Available
at: https://gitlab.idiap.ch/bob/bob.bio.vein
[1] R. Raghavendra and C. Busch, “A low cost wrist vein sensor for biometric authentication,” in 2016 IEEE International Conference on Imaging Systems and Techniques (IST), Oct 2016, pp. 201–205. [2] D. Hartung, M. A. Olsen, H. Xu, H. T. Nguyen, and C. Busch, “Comprehensive analysis of spectral minutiae for vein pattern recognition,” IET Biometrics, vol. 1, no. 1, pp. 25–36, March 2012. [3] O. C. Kurban, . Nyaz, and T. Yildirim, “Neural network based wrist vein identification using ordinary camera,” in 2016 International Symposium on INnovations in Intelligent SysTems and Applications (INISTA), Aug 2016, pp. 1–4. [4] O. Nikisins, T. Eglitis, M. Pudzs, and M. Greitans, “Algorithms for a novel touchless bimodal palm biometric system,” in 2015 International Conference on Biometrics (ICB), May 2015, pp. 436–443. [5] M. Yakno, J. Mohamad-Saleh, and B. A. Rosdi, “New technique for larger roi extraction of hand vein images,” in 2015 International Conference on BioSignal Analysis, Processing and Systems (ICBAPS), May 2015, pp. 82–87. [6] R. D. Rudyanto et al., “Comparing algorithms for automated vessel segmentation in computed tomography scans of the lung: the vessel12 study,” Medical Image Analysis, vol. 18, no. 7, pp. 1217 – 1232, 2014. [Online]. Available: http://www.sciencedirect.com/science/article/ pii/S136184151400111X [7] R. Fuksis, M. Greitans, O. Nikisins, and M. Pudzs, “Infrared imaging system for analysis of blood vessel structure,” Elektronika ir Elektrotechnika, vol. 97, no. 1, 2015. [Online]. Available: http://eejournal.ktu.lt/index.php/elt/article/view/9943 [8] N. Miura, A. Nagasaka, and T. Miyatake, “Extraction of finger-vein patterns using maximum curvature points in image profiles,” IEICE - Trans. Inf. Syst., vol. E90-D, no. 8, pp. 1185–1194, Aug. 2007. [Online]. Available: http://dx.doi.org/10.1093/ietisy/e90-d.8.1185 [9] C. Zhou et al., “Automatic multiscale enhancement and segmentation of pulmonary vessels in ct pulmonary angiography images for cad applications,” Medical Physics, vol. 34, no. 12, pp. 4567–4577, 2007. [10] R. Kabacinski and M. Kowalski, “Vein pattern database and benchmark results,” Electronics Letters, vol. 47, no. 20, pp. 1127–1128, September 2011. [11] A. Das, U. Pal, M. A. F. Ballester, and M. Blumenstein, “A new wrist vein biometric system,” in 2014 IEEE Symposium on Computational Intelligence in Biometrics and Identity Management (CIBIM), Dec 2014, pp. 68–75. [12] J. E. S. Pascual, J. Uriarte-Antonio, R. Sanchez-Reillo, and M. G. Lorenz, “Capturing hand or wrist vein images for biometric authentication using low-cost devices,” in 2010 Sixth International Conference on Intelligent Information Hiding and Multimedia Signal Processing, Oct 2010, pp. 318–322. [13] C. Y. Lin, M. Wu, J. A. Bloom, I. J. Cox, M. L. Miller, and Y. M. Lui, “Rotation, scale, and translation resilient watermarking for images,” IEEE Transactions on Image Processing, vol. 10, no. 5, pp. 767–782, May 2001. [14] D. Arthur and S. Vassilvitskii, “K-means++: The advantages of careful seeding,” in Proceedings of the Eighteenth Annual ACM-SIAM Symposium on Discrete Algorithms, ser. SODA ’07. Philadelphia, PA, USA: Society for Industrial and Applied Mathematics, 2007, pp. 1027–1035. [Online]. Available: http://dl.acm.org/citation.cfm?id= 1283383.1283494 [15] N. Miura, A. Nagasaka, and T. Miyatake, “Feature extraction of finger-vein patterns based on repeated line tracking and its application to personal identification,” Machine Vision and Applications, vol. 15, no. 4, pp. 194–203, 2004. [Online]. Available: http: //dx.doi.org/10.1007/s00138-004-0149-2
[16] A. Anjos, M. G¨unther, T. de Freitas Pereira, P. Korshunov, A. Mohammadi, and S. Marcel, “Continuously reproducing toolchains in pattern recognition and machine learning experiments,” in International Conference on Machine Learning (ICML), Aug. 2017. [Online]. Available: http://publications.idiap.ch/downloads/papers/2017/ Anjos ICML2017-2 2017.pdf [17] A. Anjos, L. E. Shafey, R. Wallace, M. G¨unther, C. McCool, and S. Marcel, “Bob: a free signal processing and machine learning toolbox for researchers,” in 20th ACM Conference on Multimedia Systems (ACMMM), Nara, Japan. ACM Press, Oct. 2012. [Online]. Available: https://publications.idiap.ch/downloads/ papers/2012/Anjos Bob ACMMM12.pdf