ical diagnosis, high quality video conference, high definition. Television broadcasting .... We call each homogenous region a connected component because the ...
FAST IMAGE SUPER-RESOLUTION USING CONNECTED COMPONENT ENHANCEMENT Jinjun Wang, Yihong Gong NEC Laboratories America, Inc. Cupertino, CA 95014, USA {jjwang,ygong}@sv.nec-labs.com ABSTRACT The paper focuses on reconstructing the discontinuity between homogenous color regions in an interpolated image to improve its perceptual quality. A low-resolution input image is firstly interpolated and then decomposed into several patches. Each patch is then segmented into multiple homogenous regions using Connected Component Analysis technique. Then a spatial-filter is applied to enhance the color/intensity transition between neighboring components. The designed spatialfilter combines the advantages of both bilateral-filtering and unsharp masking methods, with high computational efficiency. The proposed method can be used for image/video superresolution applications. Experimental results are promising. 1. INTRODUCTION Images with high pixel density are desirable in many applications, such as high resolution (HR) medical images for medical diagnosis, high quality video conference, high definition Television broadcasting, Blu-ray movies, etc. While people can use higher resolution camera for the purpose, there is an increasing demand to shoot HR image/video from lowresolution (LR) cameras such as cell phone camera or webcam, or converting existing standard definition footage into high definition video material. Hence software resolution enhancement techniques are very desirable for these applications. However, the performance of simple interpolation methods is poor due to the aliasing effect. The super-resolution (SR) idea was first introduced by Tsai and Huang [1] who proposed to “construct” one high-resolution (HR) image from multiple LR images using signal processing techniques. The SR approach has attracted increasing research attentions in recent years, and many improved methods such as single image SR and real-time SR, have been reported [2]. Existing SR methods can be divided into three categories, specifically the reconstruction-based method, the learningbased method, and the functional interpolation method. The reconstruction-based method forms the largest body of SR research [3]. It builds a HR image from a sequence of LR images. The limitation of reconstruction-based methods is that, as the image magnification factor increases, the reconstruction constraints provide less and less useful information [4]. In addition, it requires that the image pairs are related by
978-1-4244-2571-6/08/$25.00 ©2008 IEEE
157
global parametric transformations, and/or the parameter of the camera’s Point-Spread-Function (PSF) is known in advance. Besides, moving the camera to obtain a set of displaced LR images, while minimizing the motion blur caused by camera/object movement, requires expensive hardware devices [5]. The second category, the learning-based methods, learns the co-occurrence prior between HR and LR image patches or coefficients [3], and process the LR input along with appropriate smoothness constraint [6, 7] to generate HR image. Learning-based SR for certain types of image has also been attempted, such as face [8] and fingerprints [9] images. Although learning-based SR method is suitable for both multiframe and single-frame SR, it is somewhat dependent on the training set. Hence the result is not stable and sometimes produces artifacts in real applications [10]. The third category is the functional interpolation approach which applies an existing function on the LR input. In this line some well known image interpolation methods can be found, such as bi-cubic and polynomial spline interpolation. However, simple interpolation function cannot recover the highfrequency components lost and often blurs the discontinuities of interpolated images. Irani and Peleg [12] introduced a different approach by iterative back projection. However, excessive projection would produce serious ringing artifact. Dai [13] applied the alpha-matting model to obtain a MAP decomposition of any local image patch into background and foreground components and reconstruct the discontinuity between the two. The method generates SR images with good perceptual quality, but is very computational expensive. In this paper we introduce an image SR method that also belongs to the functional interpolation category. Similar to Dai’s method [13], we decompose a local image patch into multiple components to reconstruct the discontinuities between neighboring ones, using a proposed efficient and robust method. Our proposed method generates SR images with good perceptual quality but requires much less processing time. Hence it is suitable for computation-cheap environments and real-time SR applications. The rest of the paper is organized as follows: Section 2 gives an overview of the proposed technique, and Section 3 explains each processing module in detail. Experimental results are listed in Section 4, and Section 5 draws conclusion and discusses some future work.
ICME 2008
2. OVERVIEW Human eyes are most sensitive to high frequency areas in an image. This high frequency information is however lost during the image downgrading process, and is not reconstructed in the interpolated image. Since the high frequency components exist at locations with abrupt color/intensity transitions, we aim at reconstructing such discontinuity to improve the perceptual quality of interpolated image, i.e., to estimate both the location and the amount of the discontinuity. Although the aliasing effect restrains perfect estimation of neither of the two, it is observed that, the location of discontinuity can be simply detected using standard edge detection techniques. Hence the major challenge of the research is how to estimate the amount of discontinuity for reconstruction. We proceed to analyze the neighboring homogenous regions that form the discontinuity to estimate how much the discontinuity should be. We call each homogenous region a connected component because the pixels inside the region are connected to each other and share similar color/intensity. We extract multiple patches from the interpolated LR image, each centered at an edge pixel. Then we detect the connected components from each patch and enhance the color/intensity contrast between neighboring ones to improve the overall perceptual quality of the processed image. The next section elaborates our method in more detail.
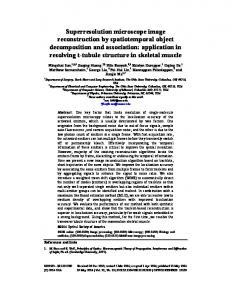
(CCA) technique to detect the connected component in every patch. CCA works by scanning a patch and grouping its pixels into components based on defined pixel connectivity. Once all groups have been determined, each pixel is labeled with a number according to the component it was assigned to.
6 250
4 200 150
2
100
0 0
50
5
0 20 15
20
10
20
15 15
15
10
10
5
5 0
10 20
5 25
0
(a) lr image patch
(b) edge detection
6
6
4
4
2
2
0 0
0 0 5
20
10
15 15
10 20
5 25
(c) standard CCA
5
20
10
15 15
10 20
5 25
(d) post-processing result
Fig. 1. Illustration of connected component extraction
In our problem, CCA is applied on the edge image patch (Fig.1.a) by extracting component segmented by edge pixels (Fig.1.b). 4-connectivity is used. After the standard CCA 3.1. Patch Extraction processing, a post-processing step is applied to label the edge pixels which works in the following manner: For any edge As explained above, we aim at reconstructing the color/intensity pixel, we search its 4 neighbors in top, left, bottom, and right discontinuity. We first upsample the LR input using bicubic order and label the edge pixel as the first non-edge neighbor’s interpolation. Then canny edge detection is applied to obtain component label number. In this way, the final component a binary image where 1 means an edge pixel which represents detected from an edge image patch is shown in Fig.1.c. peak intensity change in the local region, and 0 otherwise. For each edge pixel, we extract its N × N local patch for processing. N should be a small number because the high 3.3. Component Enhancement frequency exist at a rather local region. In our implementaWhen the connected components are extracted, the next step tion N = (magnification factor + 1) ∗ 2 + 1. A cumulated is to estimate the discontinuity between neighboring compoedge pixel growth image is also computed where each pixel nents. For efficiency, we want to use spatial filtering, and is grown 4 times. The cumulated edge growth image will be hence we borrowed the idea from bilateral filtering [16] and used in subsection 3.3 as explained later. The next subsection unsharp masking (USM) [17] for the processing. detects the connected components in each patch. A typical bilateral filter consists of two basic filters, specifically a Gaussian filter and a range filter. The former speci3.2. Connected Component Analysis fies what kind of filtering to be applied, and the later specifies where the filtering to be applied. Hence a properly deTo separate a patch into several components, Dai [13] applied signed bilateral filter can achieve good filtering behavior and the alpha matting model which assumed that a patch should preserve crisp edges at the same time. In our problem, we consist of a foreground component and a background comporeplaced the range filter by using the CCA results to specify nent. Since such a decomposition problem is ill-posed, Dai where the filtering should take value from; We also applied used the connected component labeling result to regularize a spatial filter similar to the USM method to intensify the the solver [13]. In this paper we further assume that the locontract. The USM works by first blurring the original, then cal patch may consist any number of connected components, subtracting the blurred image from the original, and finally hence we instead applied the Connected Component Analysis 3. CONNECTED COMPONENT ENHANCEMENT
158
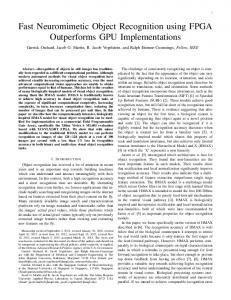
adding it to the original to get enhanced image. In our processing, we first computed the component mean image, and then obtained an adjustment to enhance the LR image. The detail of our strategy is explained as following: Let the local patch be denoted as P and each site denoted as p, the image intensity of P from the low resolution image can be expressed as Il = {Ipl |p ∈ P}. With the connected component information, we can compute an mean intensity image M = {Mp |p ∈ P} where each pixel intensity Mp takes the average intensity value of all the pixels from the same component (Cp ), � Mp = Ip∗ (1)
250
200
200
150
150 100 100 50
50 0 20
0 20 15
By carefully designing function f in Eq.(2), the constructed I can approach the ground-truth I. Several candidate unsharp masks f were evaluated. For trade-off between quality and computational efficiency, the following function is selected.
0
(b) mean intensity M
1.5
40
20
1 0
0.5 −20
0 20
−40 20
15
20
15
20
15
15
10
10
10
5
5 0
(3)
5 0
(a) LR patch Il
5 0
0
0
(d) adjustment (M − Il ) ∗ W
(c) weight W
Let the edge growth patch of P be denoted as E = {Ep |p ∈ P}, a weight patch W can be constructed by
Ih = {Iph = Ip + (Mp − Ip ) ∗ Wp |p ∈ P}
10
5
0
5
where f denotes the unsharp mask applied. Then we can enhance the LR image by giving an intensity adjustment value to each pixel in LR (Fig.2.d). And the enhanced patch Ih (Fig.2.e) can be denoted as
20 15
10
5 0
10
(2)
15
10
5
p∗ ∈Cp
W = {Wp = f (Ep )|p ∈ P}
20 15
10
250
250
200
200
150
150
100
100
50
50
0 20
0 20 15
20
15
20
15
10
5 0
0
(e) reconstructed patch Ih
10
5
5 0
15
10
10
5
0
(f) ground-truth
Fig. 2. Component Enhancement
h
f (Ep ) =
exp(−Ep2 )
(4)
3.4. Synthesis When all the patches are processed, they are pasted back to their original sites to generate the SR output. To handle pixels that are overlapped by several nearby patches, [6] and [7] applied certain smoothness constrain on the selection of processed patches for neighboring sites. However it resulted in loopy inference and hence increased the computational cost. In our method, patches are extracted along neighboring edge pixels, hence the nearby patches are highly correlated, and we simply use the average value for the overlapped pixels.
4.1. Single Image Super-Resolution As explained above, our method is capable for single image SR. Fig.3 shows some partial images of the processing results for face, sign, comic, scene image respectively. The required time to generate each result is also listed on the respective image. We also show the results by Dai’s [13] method for comparison. It can be seen that our approach is much faster. In addition, subjective user evaluation shows that, compare to Dai’s results, our method generate SR images with similar or even better quality because for some testing images, the proposed method produces slightly difference edge pixels, which makes our results more natural. 4.2. Real-time Video Super-Resolution
To evaluate the efficiency of proposed method under realtime video scenario, a DELL workstation with dual dual-core 2.8GHz CPU and 2G memory was used to perform on-line 4. EXPERIMENTAL RESULT SR. The input video is taken by a webcam with resolution Unlike those reconstruction-based or learning-based method 160 × 120. The selected output is three time of the input. which aims to reduce a certain objective cost, and hence their We can achieve about 2 5 fps which demonstrated that the results can be evaluated using objective measures such as PSNR, proposed method is computational efficient. In fact, the proRMS, our proposed method focus on improving the percepcessing time of our proposed method mainly depends on the tual quality of the processed image. Due to the lack of effeccomplexity of the input LR image and the size of the target tive Human Visual System based image quality measure, in SR image, regardless of the LR input size. Fig.4 shows a 3× the experiments we mainly focus on subjective user evaluavideo input/output screen capture. A patch of Fig.4 is also tion and the processing efficiency. shown to give more detail.
159
[2] Sung Cheol Park, et al,, “Super-resolution image reconstruction: a technical overview,” IEEE Signal Processing Magazine, pp. 21–36, 2003. [3] C. Jiji and C. Subhasis, “Single-frame image superresolution through contourlet learning,” EURASIP Journal on Applied Signal Processing, pp. 73767(11), 2006. [4] Z. Lin and H. Shum, “Fundamental limits of reconstruction-based super-resolution algorithms under local translation,” IEEE Trans. on PAMI, no. 1, pp. 83– 97, 2004. [5] M. Ben-Ezra, A. Zomet, and S.K. Nayar, “Jitter camera: High resolution video from a low resolution detector,” Proc. IEEE CVPR’04, pp. 135–142. [6] W. Freeman, E. Pasztor, and O. Carmichael., “Learning low-level vision,” IJCV, no. 1, pp. 25–47, 2000. [7] Q. Wang, X. Tang, and H. Shum, “Patch based blind image super resolution,” Proc. of ICCV’05, no. 1, pp. 709–716,. [8] X. Wang and X. Tang, “Hallucinating face by eigentransformation with distortion reduction,” Proc. of ICBA’04, pp. 88–94.
Fig. 3. Some 3X results from top to bottom: LR input; Bicubic method; Dai’s method [13]; Our method; Ground-truth
input
output
[9] C. Jiji and S. Chaudhuri, “Pca-based generalized interpolation for image super-resolution,” Proc. of Indian Conf. on Vision, Graphics & Image Processing’04, pp. 139–144. [10] C. Bishop, A. Blake, and B. Marthi, “Super-resolution enhancement of video,” Proc. Artificial Intelligence and Statistics, 2003.
example detail
Fig. 4. Video SR Screen Capture
[11] M. Unser, et al, “Enlargement or reduction of digital images with minimum loss of information,” IEEE Trans. on Image Process, no. 3, pp. 247–258, 1995.
5. CONCLUSION AND FUTURE WORK In this paper we introduced a SR method based on connected component enhancement. Compared to previous work [13] our approach is faster yet generate satisfactory result. The proposed method is capable for both single image SR and real-time video SR. The next stage of the research includes the following issues: 1) To conduct additional subjective and objective test and improve the robustness of proposed method; 2) To incorporate other SR method as pre/post-processing steps for our method to further improve the quality, such as the Back-Projection method [12]; And 3) To evaluate more filter kernels in Eq. (2) for different scenario and applications.
[12] M. Irani and S. Peleg, “Improving resolution by image registration,” CVGIP: Graphical Models and Image Processing, no. 3, pp. 231–239, 1991. [13] S. Dai, et al, “Soft edge smoothness prior for alpha channel super resolution,” Proc. of CVPR’07, pp. 1–8. [14] C. Tomasi and R. Manduchi, “Bilateral filtering for gray and color images,” Proc. of ICCV’98, pp. 836–846. [15] L. Levi, “Unsharp masking and related image enhancement techniques,” Comput. Graph. Image Process, pp. 163–177, 1974. [16] C. Tomasi and R. Manduchi, “Bilateral filtering for gray and color images,” Proc. of ICCV’98, pp. 836–846.
6. REFERENCES [1] R. Tsai and T. Huang, “Multiframe image restoration and registration,” Advances in Computer Vision and Image Processing , pp. 317–339, 1984.
160
[17] L. Levi, “Unsharp masking and related image enhancement techniques,” Comput. Graph. Image Process, pp. 163–177, 1974.