315
Faster Phong Shading via Angular Interpolation A.A.M. Kuijk and E.H. Blake* Abstract One of the most successful algorithms that brought realism to the world of 3D image generation is Phong shading. It is an algorithm for smooth shading meshes of planar polygons used to represent curved surfaces. The level of realism and depth perception that can be obtained by Phong shading is attractive for 3D CAD applications and related areas. However, per pixel computation costs which were too high and/or artifacts, introduced by some of the more efficient evaluation methods and apparent only when displaying moving objects, are major factors that blocked the common usage of Phong shading in highly interactive applications. In this paper we present angular interpolation for Phong shading planar polygons. Angular interpolation was a method especially designed to meet requirements as imposed by special purpose hardware we developed1, but turned out to be generally applicable. The angular interpolation method appears to be very efficient and reduces artifacts when displaying moving objects. Ideally a shading algorithm imposes no need for subdivision of patches as presented by the solid modelling system. Shading calculation via angular interpolation yields such an ideal algorithm. We will describe two alternative evaluation methods that trade off evaluation cost against level of accuracy. They both can handle light source and view point at arbitrary distances, but Mer in level of accuracy. As a consequence these alternative evaluation methods do impose restrictions on the topology of patches and light sources. However, generally, the limitations imposed by these alternative shading methods are much more liberal than the limitations on patch size imposed by the geometry. The most economic evaluation method we present can incrementally compute the colour intensity along a scanline by two additions per pixel. The methods presented are generally applicable and can easily be implemented in hardware. Key Words & Phrases: image synthesis, shading, angu-
*Centre for Mathematics and Computer Science (CWI) Department of Interactive Systems Kruislaan 413 1098 SJ Amsterdam The Netherlauds Email:
[email protected] [email protected]
North-Holland Computer Graphics Forum 8 (1989) 315-324
lar interpolation, spherical approximation, quaternions.
geometry,
quadratic
Introduction Phong shading is one of the most successful algorithms for obtaining a high degree of realism in computer generated images. This shading model is often used to shade planar polygonal approximated surfaces smoothly. It not only has ambient and Muse intensity components but incorporates a specular reflection component that produces a highlight as caused by reflection of shiny surfaces2,3. The surface reflectance dependent approximation of this specular component as proposed by Phong is based on empirical observation. The Phong shading model implies that at every pixel the diffuse component cos a and the reflection component has to be evaluated. In general both a and vary across the surface to be shaded.
Figure 1. The Phong shading model comprises a diffuse component and a specular component is the angle between the surface normal and the direction of the light source is the angle between the direction of reflection R and the direction of the viewpoint and n is a coefficient depending on the reflectivity of the surface. Phong shading would be very attractive for interactive 3D CAD applications. The level of realism that can be obtained with it will give a better depth perception and may give a better idea of the final result of the design during the design process. In spite of this, common introduction of Phong shading in highly interactive CAD applications for smooth shading of planar polygon meshes did not occur, mainly because of the computation intensiveness of the method. Another deficiency are artifacts, introduced by some of the more efficient evaluation methods4. These artifacts may be almost invisible for static images, but become disturbingly apparent when displaying moving objects.
316
A.A.M. Kuijk et al. / Faster Phong Shading
This may be reduced by reducing the polygon size, but this strategy would increase the computational demands and data transportation. As a result, the Phong shading model has so far been a widely accepted shading model for post design visualisation; the interactive design session -supported by a less demanding shading modelis followed by a request to show “what it really looks like”. In order to make Phong shading applicable for highly interactive applications, the basic problems that have to be solved are: “how do the angles and vary across the polygon?” and “given this variation how to evaluate the intensity components as economically as possible?” In this paper we will show an efficient and high quality method for Phong shading planar polygonal meshes. In the first section, we will focus on answering the question raised above: “how do the angles and vary across the polygon?” We will discuss equi-angular interpolation for which no normalisation per pixel is needed as opposed to the traditional vector interpolation. Two alternative interpolation methods will be presented, both capable of handling light source and/or viewpoint at finite or infinite distance. The result of these methods will be an expression relating the cosines of the Phong model to one or two (depending on the method) angles incremented linearly along a scanline. In the second section, the question: “how to evaluate the diffuse and specular components as economically as possible?” will be answered. 1. Interpolation Across Polygons For curve approximation by planar polygon meshes, information of the curvature the planar polygon has to a proximate is represented by a surface normal vector specified at each vertex of the polygon5, as shown in Figure 2. From this, the normal along the edges and at each point inside the polygon has to be interpolated. In general, not only the normal but also the direction of the light source the direction of the eye and the
Figure 2. Approximation of curved surfaces by planar polygon meshes. For the purpose of shading calculations, the surface normal is specified at each vertex.
direction of reflected light is dependent on the position. Since is obtained by interpolation, these vectors usually also are found by interpolation from the values calculated at each vertex, rather than by exact calculation at each pixel. 1.1. Vecctor Interpolation The traditional vector interpolation method is based on the assumption that along a path from A to B a vector at can be calculated by with and and being the normals at A and B respectively. This interpolation is performed along the edges first. Using the thus obtained and the normal along a scanline can be similarly interpolated, as shown in Figure 3.
Figure 3. Interpolation of a vector across the polygon in two steps: first the vector is interpolated along the edges AB and AC, next the interpolated vectors and thus obtained are used for interpolation along the scanline through PQ. To have an efficient method, it has to be possible to relate the increments directly to the evaluation of the intensity components and This is why vector interpolation became so widespread, the spatial increments dx, dy and dz of the vectors along the scanline are closely related to the vector coordinates needed for evaluation of the scalar product, which makes it possible to incrementally calculate the intensity components. Figure4 however, shows that the resulting interpolated vector has a varying length and varying angular increment. This is a result of making ual steps along a chord joining the two vectors and Due to the varying length, renormalisation of the interpolated vector has to be done. The varying angular increment and the vectors are normalised.
provided
A.A.M. Kuijk et al. / Faster Phong Shading
introduces an orientation dependency of the highlight. This results in a jitter of the highlight when rotating, for example, a cylindrical object around its main axes. It also causes Mach band effects because the intensity variation is not smooth. Generally these deficiencies are avoided by putting restrictions on the maximum angular variation of the vectors across the polygon; in other words by reducing the polygon size. It may be clear that this restriction is not without cost.
317
point of the method at 10 pixels was considered too high! 1.2. Angular Interpolation The basic idea of angular interpolation is that the angular rotation of a directional vector is linearly related with the position along a straight line across the polygon (see Figure 5). Vectors interpolated according to this assumption have a constant length and are all in one plane; the plane spanned by the start and end vector. An elegant way of calculating these angularly incremented vectors using quaternions is described elsewhere10,11. Analogous to the vector interpolation method, interpolation will be done in the two steps shown in Figure 3; first the vector is interpolated along the edges of the polygon, next the resulting vectors are used for interpolation along the scanline.
Figure 4. As a result of vector interpolation, successive vectors vary both in length and in angular increments. Renormalisation is needed when the interpolated vector is used in a scalar product. A common assumption of most of the more efficient approaches known so far is that either the light source or the viewpoint is taken to be at infinity (sometimes even both). This means that and/or is taken to be a constant. This may simplify the calculations involved, but reduces the realism of the picture (e.g. if light source and eye are at infinity, planar surfaces are shaded with a constant intensity). Bishop and Weimar6 published a method for Phong shading which requires a quadratic polynomial for calculating †, provided the curvature is less than 60 degrees. The is taken to be a constant, but is allowed to vary. Exponentiation of is done via table lookup. An approach which uses bicubic approximations for the scalar products was published by Shantz and Sheue-Ling Lien8. They assumed L fixed and used lookup tables for the exponentiation. A method also assuming fixed was published by Deering9. A highly pipelined architecture interpolates and normalises and lookup tables are used for square root and exponentiation functions. Of particular interest in this publication was that the approach Bishop proposed was rejected because the break-even † is the vector in the direction of the highlight, that is the vector halfway between and This vector is often introduced to replace by Note however, that the an e between and is about half the angle between and a difference discussed in Hall7 that can more or less be corrected by adjusting n.
Figure 5. Angular interpolation. Successive vectors are found by qui-angular rotation using quaternions. As a consequence their length remains constant. When observing the variation of one of the vector couples along a path across a polygon you can imagine a “dance” these two vectors perform. Since both vectors vary independently, the result is that they may circle around each other, get closer or move away. This “dance” along a straight path is completely determined by two linearly varying angles, one for each vector. We have to find a relation between these angles incremented along the scanline and the evaluation of the intensity component We will show how to find this relation based on the following example of interpolation across a triangle. The normal vector and the direction of the light source at the vertices of a triangle are shown in Figure 6. For each of the two vectors there is a mapping of the polygon on the unisphere indicating the range of that vector across the polygon. If for instance the light source is at infinity the spherical triangle is reduced to a point. ‡In the following we will discuss the vector couple and needed for the diffuse term, only; interpolation of the vector couple that produces the specular term, i.e. and is identical.
318
A.A.M. Kuijk et al. / Faster Phong Shading
Figure 6. The range of the directional vectors gles and on the unisphere.
and
across the triangle A B C is indicated by two spherical trian-
Figure 7. Interpolating and along a scanline is related to two paths along two great-circles. The intersection point S of these great-circles forms one point of a spherical triangle S N L. This triangle relates the two interpolated angles and I, with the intensity component cos a along the scanline.
Figure 8. Decomposition of the rotation of one of the two independent rotating vectors results in two perpendicular rotated vectors.
A.A.M. Kuijk et al. / Faster Phong Shading
A scanline across the triangle is mapped on two circular paths, indicating the variation of the vectors and L along this scanline (see Figure 7). These paths, from to and from to are each part of a great-circle. These two great-circles intersect at S. Let be the angle between the two great-circles, n be the angle between S and I be the angle between S and Then having t linearly varying along the scanline from t = 0 at startpoint 1 and t = 1 at endpoint 2, we define to be t*(the angle between and and to be t*(the angle between and and are the vectors and interpolated along the scanline. With this we have a spherical triangle dependent on t. For this triangle a standard formula, given by spherical trigonometry, leads us to the following relation between a, (i.e. the angle between and and the linearly incremented angles and :
319
axis to the rotation of around that axis. As a result, for only a rotation component perpendicular to the plane through and remains; and are both on the same great-circle throu that intersects the great-circle through and at S'. Let be the angle between S’ and the angle between and and let be the angle between and and finally the angle between S’ and Then for the right angled spherical triangle we can write the following equation:
The spherical triangle shown in Figure 9 will clarify the implicit assumption we made using this method. For this spherical triangle the following equations hold:
Note that n, l and are constant along the scanline. Here we have an expression that directly produces the diffuse intensity component. The specular component can be found similarly, but needs raising to the power of the specular exponent as well. This expression already can be calculated more efficiently than calculation of the intensity by vector interpolation, which inherently involves renormalisation. However, for our particular application it was still too complicated for efficient evaluation. We developed two alternative approximation methods for this which both result in a simpler expression, and produce good results under mild restrictions. In one method the rotation of one vector is decomposed in two perpendicular components. The other method combines the two varying vectors in one. Decomposition Method Expression (1) will reduce to a product of two cosines, when the two great-circles are perpendicular; in that case cosy is zero. The idea is to decompose the rotation of one vector into two rotation components, one parallel and one perpendicular to the rotation of the other vector. Let a be the angle between the two great-circles through and both perpendicular to the plane in which rotates as shown in Figure 8. Rotating as well as with angle a around the axis through (the pole of the plane through and will produce the two vectors and Interpolation of can now be done from to and interpolation of L from to as indicated in the figure. In doing so, we added the rotation component of around the
Figure 9. From this spherical triangle it can be seen that in general, linearly incrementing both a and is not equivalent to linearly incrementing It.
Using (3.a) and (3.b), we can prove that for t = 0 and t = 1, (2) will produce the same result as (1). Of more interest however, are the relations between a and and between and as given by (3.b) and (3.c). These relations show that in general linearly incrementing the angles (with a hidden in it) and is not equivalent with linearly incrementing and This however is an acceptable first order approximation. Only extreme situations such as an extremely nearby light source may affect the result. We could not produce a visible difference in a realistic situation up to now.
A.A.M. Kuijk et al. / Faster Phong Shading
320
Reducing to One Vector Instead of inte lating the two independently varying vectors and we would like to interpolate only one vector, without loosing. the generality of the method, that is, without assuming one of the vectors fixed. Realising that only the relative position of both vectors and L is of interest, not their absolute position, we define a vector at each vertex of the polygon that is found by rotating L around the same axis and with the same angle as needed to rotate to be aligned with a
fixed vector
Figure 11. A right angled spherical triangle S O V relates the linear1 incremented angle with the angle between and .
(e.g.
Figure 10. Interpolation of two independently varying vectors and L can be replaced by interpolation of one vector For each vertex, can be found by applying the same rotation on the vector L as needed to align the corresponding with the reference vector
Using this method, we have specified a vector which is the only vector that remains to be interpolated across the polygon and the quest for the angle between and can be replaced by the search for the angle between and We do this by constructing a right angled spherical triangle This spherical triangle (illustrated in Figure 11) has one vertex at and one vertex at The third vertex lies on the greatcircle through ? and ?, such that is perpendicular to SO †. defines two constant angles; s the angle between and and v, the angle between and . Let be the angle between and linearly incremented alon the scanline. Then, the angle between and can be expressed in terms of the angle v, with the formula: (4)
† We do not have to worry about the two degenerate situations; 1) on the great-circle through ?, and ?, and 2) perpendicular to the plane through the great-circle because these are covered by the resulting expression equally well.
With this expression we succeeded in relating the intensity component cos to one angle linearly v along a scanline. By introducing the vector we simplified the interpolation and at the same time eliminated the difference between directional and positional light sources5. How does this method relate to the previous one? In the previous method, only the parallel component of the rotation of one vector was added to the rotation of the other vector, whereas this method adds the full rotation of one vector to the rotation of the other. As a consequence this methods imposes more restrictions on the maximum acceptable variation of the vectors across the polygon. In practice however, these limitations are easily met, Differences between the methods became visible when vector rotations on the polygon were about 90°. This is much more than what is to be expected with curved surface approximation by planar polygon meshes. Since especially for highly reflective surfaces (i.e. a high reflectivity exponent for the specular term) the specular highlight will have a limited range, checking the range of with respect to can give at an early stage insight whether or not the specular term will contribute at all. This check can be performed at polygon level as well as at scanline level. 2. Evaluation of the Intensity Components In the previous sections we presented angular interpolation of vector couples which yielded the linear expressions (1), (2) and (4) for the cosine of the angle between them along a scanline. Choosing one of these expressions, we can evaluate the diffuse component. For the specular intensity component it takes raising to the power of the specular exponent as well. Evaluation of the cosine as well as exponentiation can be done using standard function libraries or lookup tables. The latter may be the fastest solution for software implemented evaluation, but neither of these are attractive for highly parallel VLSI implementation. Lookup tables in particular would require large on-chip storage (> 8K bytes for exponentiation6).
A.A.M. Kuijk et al. / Faster Phong Shading
321
We had to find a more acceptable approximation to evaluate the general term which is present in both (2) and (4). The approximation should meet the following criteria: - easy to evaluate incrementally by forward differencing - high quality that is: no discontinuity in magnitude or slope of intensity. An approximation by means of a second order Taylor series would be easy to evaluate. This may produce a quadratic function that correctly describes the behaviour near the centre, but the grave discontinuity in slope of the intensity where the quadratic function gets to zero will cause an unacceptable Mach band effect. Given this, we tried to find a better evaluation method.
As can be seen in Figure 12, -a and a are the points where the quadratic function changes its second derivative and -band b limit the region for which the function is nonzero. This latter quantity is very useful; it is nice to know the range where By least square fitting, for each n a pair (a, b) was found. Because there are only a limited number of pairs, these values can easily be put in a small lookup table. However, looking at the values of a and b as a function of n it was clear that their relation could be described functionally as well. We found the following relations:
Evaluation of by Quadratic Curve Approximation Due to hardware limitations imposed by the technology1, we could not allow for a higher than second order polynomial. With this in mind and looking at the shape of we found that a combination of three successive quadratic curves would closely fit that shape (see Figure 12). The condition that no discontinuity in magnitude or slope of intensity is allowed is met by the following function:
Note that the values a and b are dependent on n only, so they can be considered as an attribute of the polygon, replacing the specular exponent n. Results of this evaluation method for several values of n can be seen in Figure 13. Given the fact that the specular component as proposed by Phong is based on empirical observation, it is clear that we can be satisfied with the result. Even more so because evaluating the diffuse component with this method (n = 1) has the pleasant side effect that it removes Mach banding. This Mach banding is caused by the sharp discontinuity in slope when the cosine reaches zero. At that point the slope changes from its maximum to zero7. The method proposed here does not have such a discontinuity for n = 1, as can be seen in Figure 13. The smooth transition of this evaluation method agrees with reality where diffraction and a finite sized light source cause a smooth transition as well.
With the two parameters a and b, this function has sufficient freedom to produce a best fit for the function
Figure 12. Three successive quadratic curves fitted on
Figure 13. Results of the quadratic approximation of for several values of n. The solid lines represent whereas the boxes show the approximated values.
322
A.A.M. Kuijk et al. / Faster Phong Shading
Figure 16.
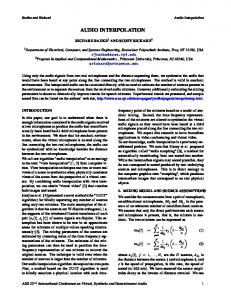
On the left a Gouraud shaded and on the right a Phong shaded image of a “sphere” approximated by 32 triangle patches. The light source is at a distance of four times the radius of the sphere. This and all following images have a parallel projection. Obvious differences between these two images is 1) the amount of Mach banding, due to which the triangle patches are clearly visible for the Gouraud shaded image. This is not the case in the Phong shaded image. 2) the specular highlight is absent in the Gouroud shaded image. These differences become less when the patch size is reduced, but at the cost of having more patches.
A.A.M. Kuijk et al. / Faster Phong Shading
323
Figure 16. Diffuse shaded images of the same teapot lit by two light sources. On top we see the result of calculation of the intensity by a cosine function. It shows Mach banding due to a sharp discontinuity in slope of intensity where the cosine reaches zero. For the bottom image the Muse term is evaluated using the quadratic approximation method presented in this paper, resulting in a smooth transition to zero. This agrees with reality where natural effects cause a smooth transition as well.