Fault Localization and Repair for Java Runtime Exceptions Saurabh Sinha
Hina Shah
Carsten Görg
IBM India Research Lab New Delhi, India
[email protected]
Georgia Tech Atlanta, Georgia, U.S.A.
[email protected]
Georgia Tech Atlanta, Georgia, U.S.A.
[email protected]
Shujuan Jiang
Mijung Kim
Mary Jean Harrold
CUMT Xuzhou, Jiangsu, China
[email protected]
Georgia Tech Atlanta, Georgia, U.S.A.
[email protected]
Georgia Tech Atlanta, Georgia, U.S.A.
[email protected]
ABSTRACT
1.
This paper presents a new approach for locating and repairing faults that cause runtime exceptions in Java programs. The approach handles runtime exceptions that involve a flow of an incorrect value that finally leads to the exception. This important class of exceptions includes exceptions related to dereferences of null pointers, arithmetic faults (e.g., ArithmeticException), and type faults (e.g., ArrayStoreException). Given a statement at which such an exception occurred, the technique combines dynamic analysis (using stack-trace information) with static backward data-flow analysis (beginning at the point where the runtime exception occurred) to identify the source statement at which an incorrect assignment was made; this information is required to locate the fault. The approach also identifies the source statements that may cause this same exception on other executions, along with the reference statements that may raise an exception in other executions because of this incorrect assignment; this information is required to repair the fault. The paper also presents an application of our technique to null pointer exceptions. Finally, the paper describes an implementation of the null-pointer-exception analysis and a set of studies that demonstrate the advantages of our approach for locating and repairing faults in the program.
Programming languages, such as Java, that are designed for robustness provide an exception-handling mechanism. Under this mechanism, when a semantic constraint of the programming language is violated, (e.g., trying to access an element outside the bounds of an array), an exception is raised to indicate the error, the regular flow of control is interrupted, and there is an attempt to transfer control to a designated part of the program that tries to recover from the error. If recovery is possible, the program continues within the regular flow of control. Exceptions in Java can be classified as: application exceptions that are explicitly thrown in response to exceptional conditions in an application, and runtime exceptions that are generated by the Java runtime environment. There has been considerable research on application exceptions that has resulted in techniques for analyzing them to provide useful information to developers (e.g., [5, 11, 14]). However, there has been little research that studies runtime exceptions, although they occur often in executing Java programs. Such exceptions represent programming errors, and include arithmetic exceptions, such as dividing by zero, and dereferences of null pointers. Because Java does not require that methods specify or catch such exceptions, when they occur during execution, there is typically no exception handler available to handle the condition, and the program terminates. To illustrate, consider the example program in Figure 1. Executing the program with input value x results in the following null pointer exception and stack trace:
Categories and Subject Descriptors D.2.5 [Software Engineering]: Testing and Debugging—Debugging aids; F.3.2 [Logics and Meanings of Programs]: Semantics of Programming Languages—Program analysis
INTRODUCTION
Exception in thread "main" java.lang.NullPointerException at RTEExample.method3(RTEExample.java:30) at RTEExample.method4(RTEExample.java:33) at RTEExample.main(RTEExample.java:5)
General Terms Algorithms, Experimentation, Measurement
Keywords
The stack trace shows that the null pointer exception was thrown in method3 at line 30 (i.e., the dereferenced field string1 was null). The stack trace also shows that method4 and main were still on the stack when the exception occurred, that main called method4 at line 5, and that method4 called method3 at line 33. When these runtime exceptions occur, the Java runtime environment stores information in the stack trace that can help the developer locate and fix the fault that causes the exception. The stack trace includes information about which line of code threw the exception and the method that contains that line of code. The stack trace also contains all methods currently on the runtime stack, along with the statements in those methods at which the method calls were made. Although the stack trace can be useful in locating the code or the conditions that cause the exception to be raised, the granularity of the information provided in the stack trace may be too coarse to
Fault localization, runtime exceptions, static analysis, null dereference
Permission to make digital or hard copies of all or part of this work for personal or classroom use is granted without fee provided that copies are not made or distributed for profit or commercial advantage and that copies bear this notice and the full citation on the first page. To copy otherwise, to republish, to post on servers or to redistribute to lists, requires prior specific permission and/or a fee. ISSTA’09, July 19–23, 2009, Chicago, Illinois, USA. Copyright 2009 ACM 978-1-60558-338-9/09/07 ...$5.00.
153
public class RTEExample { String string1,string2; int val; 1. public static void main( String args[] ) { 2. RTEExample rte = new RTEExample(args[0].length()); 3. if ( args.length == 1 ) { 4. rte.method2(); 5. rte.method4(); } else { 6. int num = Integer.parseInt( args[1] ); 7. rte.method1( num ); } 8. rte.method3(); 9. } 10. public RTEExample( int i ) { 11. val = i; 12. string1 = null; // NP assignment 13. string2 = null; // NP assignment 14. if ( val > 1 ) { 15. string2 = new String( "abc" ); } 16. }
17. 18. 19. 20.
public void method1( int j ) { if ( j == 0 ) { String tempStr = null; // NP assignment string1 = tempStr; } else { string1 = null; // NP assignment } string2.charAt(0); // NP dereference } public void method2() { string1 = string2; } public void method3() { if ( val > 1 ) { string2.charAt(0); } string1.charAt(0); // NP dereference } public void method4() { method3(); }
21. 22. 23. 24. 25. 26. 27. 28. 29. 30. 31. 32. 33. 34. }
Figure 1: Java program RTEExample that illustrates runtime exceptions and the interprocedural control-flow graph for the program. assist in locating the cause of the exception. The stack trace contains only the methods that are involved in the execution and the statement at which a method call was made, but does not contain information about the flow of control through the method. Thus, to locate the cause of the exception, the developer must inspect the execution manually, using the stack trace, and attempt to understand the flow of control through the calling methods. Furthermore, methods that have been called during the execution and have already returned will not appear in the stack trace. Thus, during the manual inspection of the methods to locate the cause of the exception, the developer may miss methods that were involved in the execution, or may not understand the complex flow of control in the program. Finally, after the location of the cause of the exception is found, the stack trace provides little information to assist the developer in repairing the fault. The developer must locate manually other statements in the program that may cause the exception to be raised in other executions and, therefore, must be considered to fix the fault that caused the exception in this execution. To illustrate, consider again the stack trace resulting from executing the program in Figure 1 with input value x. Further inspection
shows that none of the methods in the stack trace contains an assignment to string1, the field whose dereference in statement 30 resulted in the exception. Thus, the stack-trace information alone is insufficient for finding the cause of this exception. Figure 1 displays the interprocedural control flow graph1 for our example program. The execution path for input value x consists of: 1, 2a, 10, 11, 12, 13, 14, 16, 2b, 3, 4a, 24, 25, 26, 4b, 5a, 32, 33a, 27, 28, 30. A careful examination of this execution shows that the null assignment that caused the null pointer exception occurred at statement 13, where string2 was assigned a null value. This value was copied to string1 at statement 25, and then dereferenced at statement 30. Neither the constructor that contains statement 13 1
A control-flow graph (CFG) for a method contains nodes that represent statements and edges that represent the flow of control between statements. An interprocedural control-flow graph (ICFG) contains a CFG for each method in the program. A call site is represented using a call node and a return node. At each call site, a call edge connects the call node to the entry node of the called method; a return edge connects the exit node of the called method to the return node.
154
2.
nor the method that contains statement 25 is on the stack when this exception is thrown. Further examination of the rest of the program shows that the null values assigned at statements 19 and 21 could also reach the dereference at statement 30 in some other execution; such statements should be considered while repairing the fault. To address the limitations of existing techniques, we have developed, and present in this paper, a new approach that automatically identifies the cause of a runtime exception, and provides context information to assist the developer in repairing the fault. Our approach identifies the source statement(s) responsible for the exception in the failing execution; this information is required to locate the fault. Our approach also identifies (1) other source statements that may cause this same exception to be raised on other executions, and (2) other reference statements whose execution may result in exceptions in other executions because of the same source statement; this information is required to repair the fault. The approach combines dynamic analysis (using stack-trace information) with static backward data-flow analysis (starting at the point where the runtime exception occurred). The approach handles runtime exceptions that involve a flow of an incorrect value that finally leads to the exception. This important class of exceptions includes (1) exceptions caused by dereferences of null pointers, (2) exceptions related to arithmetic faults, such as ArithmeticException, and (3) exceptions related to type faults, such as ArrayStoreException. To illustrate our approach, we applied it to null pointer exceptions. Our technique extends an interprocedural path-sensitive and context-sensitive analysis that finds potential dereferences of null values [10]. The extensions include incorporating the use of the stack trace for a failing execution and finding context information required to repair the fault. In this paper, we also present the results of studies that we performed on a set of open-source programs. Our studies evaluate the effectiveness of our technique in finding the null pointer assignment(s) that cause a runtime exception in Java programs, and show that our technique is more effective than using a static-analysis approach or the stack-trace information alone. Our studies also show the additional information that our technique finds that can assist in repairing the fault. The main benefit of our approach is that it automates the search for the cause of runtime exceptions using readily available dynamic information about the execution in the form of the stack trace. Thus, it reduces the manual effort required to locate the fault, which reduces debugging time. Another benefit of our approach is that it automates the identification of code that is not responsible for the exception on this execution but that may cause the same exception on other executions. Thus, it provides the developer with the necessary context for fixing the fault, and ensuring that the exception does not occur on subsequent executions. A third benefit of our approach is that it applies to an important class of runtime exceptions that occur often in practice. Thus, it can be an important tool for use by developers that will reduce the time to find and fix faults caused by this class of runtime exceptions. The contributions of the paper include
OVERVIEW OF OUR APPROACH
In this section, we present a high-level overview of our approach for supporting fault localization and fault repair using a combination of static and dynamic analysis. As mentioned earlier, currently, our approach is limited to failures caused by the flow of an incorrect value from a source statement to the program point where the value causes a failure. Our approach consists of two phases. In the first phase, our technique assists in fault localization by providing the location of the source statement that is responsible for the runtime exception. In the second phase, our technique assists in fault repair by providing context information about other statements that are related to this exception, and may be involved in runtime exceptions in other executions. We present an overview of these phases in turn. In execution E in which an exception was raised at reference statement sr(E) , there is exactly one statement sa(E) at which the incorrect value that caused the exception is generated. The goal of Phase 1 of our technique is to locate this source statement. For example, for a NullPointerException at statement x.f, sa(E) is the statement that assigned a null value to x. For an ArithmeticException at statement z = (x-y), sa(E) is the statement at which the expression (x-y) became zero—this statement could be an assignment to either x or y. For an ArrayStoreException at statement a[i] = x, sa(E) is the statement that assigned an incorrect type to x that caused the exception. To locate sa(E) , our approach performs a backward interprocedural data-flow analysis of the program, starting at sr(E) . The analysis is guided by the available dynamic information about the failing execution E. In most cases of field failures, the only dynamic information available is the stack trace associated with E. Therefore, we illustrate the analysis using stack-trace information. However, when additional dynamic information, such as branch traces, are available, our approach can use such information.2 The result of this stack-trace-driven analysis lets us classify the source statements sa(E) into two categories: definite and possible. In some cases, the analysis computes a unique source statement at which the incorrect value that reaches sr(E) is generated. For this case, this statement definitely caused the exception in execution E. Thus, we classify sa(E) as a definite incorrect assignment, and we know that it is the cause of the exception. In other cases, the analysis computes more than one source statement at which the incorrect value that reaches sr(E) in E could have been generated. Because the stack trace provides no control-flow information within the methods, there may be multiple possible source statements that could have caused the exception at sr(E) in E. For example, if a method M that is executed in E has a conditional statement c where an incorrect value is generated along both branches of c, the analysis cannot determine which of the branches was executed in E. Although in such cases the analysis cannot determine which of a set of source statements assigned the incorrect value that caused the exception at sr(E) , it can determine that at least one of the set of statements did cause the exception. Thus, we classify statements sa(E) as possible incorrect assignments, and we know that at least one of them caused the exception on execution E. Figure 2 illustrates the information that our technique provides. In the figure, the shaded area represents the execution E on which the runtime exception was thrown at sr(E) . The figure shows the case in which the analysis was able to identify the exact statement
• A presentation of a novel approach for locating faults that cause runtime exceptions and for providing context information required for fixing the faults • A description of a technique that applies the approach to null pointer exceptions • The results of analytical and empirical evaluations that show that our technique is more effective than other techniques based on static analysis or stack-trace information alone
2 In some cases, the inputs that cause failures may be available. For example, some of the BUGZILLA reports for the Ant project that we examined contained the build files on which null pointer exceptions occurred. In such cases, more detailed dynamic information can be computed in-house by instrumenting the code and executing it on the failing test inputs.
155
Table 1: Failing executions, corresponding stack traces, and NPA and NPR classifications, for the example program. Execution Number 1
Input
Execution Path 1, 2a, 10, 11, 12, 13, 14, 16, 2b, 3, 4a, 24, 25, 26, 4b, 5a, 32, 33a, 27, 28, 30
2
3
4
1, 2a, 10, 11, 12, 13, 14, 15, 16, 2b, 3, 6, 7a, 17, 18, 19, 20, 22, 23, 7b, 8a, 27, 28, 29, 30 1, 2a, 10, 11, 12, 13, 14, 15, 16, 2b, 3, 6, 7a, 17, 18, 21, 22, 23, 7b, 8a, 27, 28, 29, 30 1, 2a, 10, 11, 12, 13, 14, 16, 2b, 3, 6, 7a, 17, 18, 21, 22
Definite NPA 13
Possible NPA –
Maybe NPA 19, 21
Maybe NPR 22
Definite/Possible NPAs in a Method in the Stack Trace –
–
19, 21
13
–
–
method3(RTEExample.java:30) main(RTEExample.java:8)
–
19, 21
13
–
–
method1(RTEExample.java:22) main(RTEExample.java:7)
13
–
–
30
–
Stack Trace method3(RTEExample.java:30) method4(RTEExample.java:33) main(RTEExample.java:5) method3(RTEExample.java:30) main(RTEExample.java:8)
3.1
Figure 2: Categories of assignments and references identified by our technique. sa(E) that caused the exception to be raised at sr(E) . Thus, in the figure, sa(E) is a definite incorrect assignment. After Phase 1 of our analysis, the developer can choose Phase 2 of the analysis, which provides context for fixing the fault. In particular, Phase 2 provides information about other statements that are related to both sa(E) and sr(E) and should be considered when fixing the fault. For sr(E) , our technique finds all statements sa that could assign incorrect values that could reach sr(E) and cause an exception on an execution other than E. For sa(E) , our technique locates all statements sr that the incorrect value at sa(E) could reach on an execution other than E and cause an exception to be raised. We classify statements, such as sa , as maybe assignments and statements, such as sr , as maybe references. To illustrate, consider again Figure 2. The figure shows that a set of statements, sa1 , . . . , sai , have been identified that could assign incorrect values that may flow to sr(E) , and cause an exception to be raised on executions other than E. The figure also shows that a set of statements, sr1 , . . . , srj , could reference the incorrect value assigned at sa(E) in other executions and cause a runtime exception to be raised. Both kinds of statements provide context for fixing the fault related to the exception that was raised at sr(E) .
3.
Null Assignments and Dereferences
In Java, a NullPointerException is thrown at a statement that dereferences a variable or a field that has a null value. A null pointer assignment (NPA) is a statement at which a null value originates; examples of null pointer assignments include statements “x = null,” “return null,” and “foo(null)” (a null value for an actual parameter at a method call). A null pointer dereference (NPR) is a dereference statement at which the dereferenced variable could potentially be null. In the example in Figure 1, statement 13 is a null pointer assignment, and statement 22—at which string2 can potentially be null—is a null pointer dereference. In keeping with the classification of source statements related to the runtime exception at sr(E) for execution E, we classify an NPA as definite, possible, or maybe: sa(E) is a definite NPA if the null value generated at sa(E) was the one dereferenced at sr(E) in E; sa(E) is a possible NPA if the null value generated at sa(E) could have been dereferenced at sr(E) in E; sa is a maybe NPA if the null value generated at sa was definitely not dereferenced at sr(E) in E, but could be dereferenced at sr(E) in other executions. There exists a unique definite NPA for each null pointer exception, and the goal of Phase 1 of our approach is to identify that NPA. Table 1 lists four failing executions that result in null pointer exceptions for RTEExample (Figure 1). For each execution, the table shows an execution number (column 1), the program input (column 2), the path traversed by the execution (column 3), the stack trace (column 4), the definite, possible, and maybe NPAs (columns 5–7) identified by our analysis (using the stack trace), and whether the definite or possible NPAs were contained in a method that is in the stack trace for that execution (column 9). (We discuss column 8 later.) In each execution path, the last statement is the NPR and the statement shown in boldface is the NPA at which the dereferenced null value originates. For example, in execution 1, the null assignment at statement 13 causes the null dereference at statement 30. For this execution, our analysis identifies statement 13 as the definite NPA, no statements as possible NPAs, and statements 19 and 21 as maybe NPAs. Note that, statically, the null values generated at each of statements 13, 19, and 21, reach statement 30. However, based on the stack configuration, the analysis determines that statement 13 is the NPA that caused the null pointer exception in execution 1 and, therefore, that statements 19 and 21 definitely did not cause the execution to fail. For execution 2, the analysis cannot identify the definite NPA. The stack trace contains insufficient information for the analysis to determine which branch from condition statement 18 was taken during the execution. Therefore, the analysis assumes that either branch could have been taken, and classifies statements 19 and 21 as possible NPAs. The analysis can, however, determine that statement 13 definitely could not have caused the null pointer exception in execution 2, and thus, classifies it as a maybe NPA.
APPLICATION OF OUR APPROACH TO NULL POINTER EXCEPTIONS
To demonstrate our approach that uses static analysis (in the form of backward data-flow analysis) guided by dynamic information (in the form of the stack trace) to assist in fault localization and fault repair, we applied it to null pointer exceptions. Our approach uses the null-dereference analysis implemented in a tool called XYLEM [10], which we refer to as XYLEM analysis. In this section, we first discuss null pointer assignments and dereferences. Then, we provide an overview of the XYLEM analysis (details can be found in Reference [10]) and discuss the modifications we made to it for use in our new algorithm. After that, we present the details of our two-phase algorithm.
156
algorithm ComputeNPA input sr Dereference of variable v for which to compute NPAs D Dispatcher that selects the predecessors of a node to traverse global N NPAs for sr CS call stack of methods σ(s, Γ) summary information at a call site s that maps an incoming state Γ to an outgoing state begin 1. Γ = {hv = nulli,hthis 6= nulli} 2. analyzeMethod(sr , Γ) 3. return N
To support the repair of null-dereference faults, in addition to the maybe NPAs, our approach computes maybe NPRs for a definite NPA. For a definite NPA sa(E) that caused a runtime exception in execution E, a maybe NPR is a statement that did not dereference the null value generated at sa(E) in E, but that could dereference the null value in a different execution. Column 8 of Table 1 lists the maybe NPRs for the four executions of RTEExample. For example, for definite NPA 13 in execution 1, statement 22 is a maybe NPR. Although statement 22 does not dereference the null value in execution 1, it can dereference that value in a different execution, as illustrated by execution 4.
3.2
procedure analyzeMethod (s: starting statement, Γ: state) 4. initialize worklist with (s, Γ) 5. while worklist 6= ∅ do 6. remove (s, Γ) from worklist 7. preds = get predecessors of s from D 8. foreach sp in preds do 9. if sp is not the entry and not a call then 10. compute Γ′ for the transformation induced by sp 11. if root-predicate(Γ′ ) = htruei, add sp to N // found NPA 12. add (sp , Γ′ ) to worklist if not visited 13. else if sp is a call that invokes M then 14. Γ′ = σ(sp , Γ) 15. if Γ′ = ∅ then // no summary exists 16. push M onto CS 17. Γ′ = map Γ to the exit of M 18. analyzeMethod(exit node of M , Γ′ ) 19. pop CS 20. Γ′ = map state at the entry of M to sp 21. add Γ′ to σ(sp , Γ) 22. add (sp , Γ′ ) to worklist if not visited 23. if CS = ∅ then // method not being analyzed in a specific context 24. cs = get call sites from D 25. foreach sc in cs do 26. Γ′ = map Γ to sc 27. analyzeMethod(sc , Γ′ ) end
Overview of the XYLEM Analysis
The XYLEM analysis is purely static and, for an NPR, it continues its analysis until one NPA is located. This NPA is one that can occur on some execution of the program [10]. For our approach, we modified the original XYLEM analysis in two ways: (1) instead of stopping when it finds one NPA, the analysis continues until it finds all NPAs on the paths that it considers; (2) the analysis is parameterized so that the method for finding which calling methods and which CFG predecessors to consider in the analysis is specified as a parameter to the analysis. Starting at a statement sr that dereferences variable v, XYLEM performs a backward, path-sensitive analysis to determine whether v could be null at sr . During the analysis, it propagates a set of abstract state predicates backward in the CFG. The analysis starts with a predicate asserting that v is null, and updates states during the path traversal. If the updated state becomes inconsistent, the path is infeasible and the analysis stops traversing the path. Figure 3 presents algorithm, ComputeNPA, for identifying NPAs. The algorithm takes as input the dereference statement sr of variable v from which to start the traversal, along with a dispatcher D that locates the methods into which the backward analysis continues when the entry of a method is reached and the CFG predecessors from which the analysis continues. The algorithm returns as output N , a set of NPAs. For each sa in N , the algorithm has found a path along which the null value assigned at sa may be dereferenced at sr . The algorithm initializes the state Γ with predicates hv = nulli (v is the variable dereferenced at sr ) and hthis 6= nulli (line 1), and then calls procedure analyzeMethod (line 2), which uses a standard worklist-based approach to compute a fix-point solution over the abstract state predicates (lines 4–22). To perform efficient analysis, XYLEM abstracts away arithmetic expressions; thus, the number of generated predicates is bounded and the analysis is guaranteed to terminate. The analysis traverses a loop until the state no longer changes from one iteration to the next. Because, integer arithmetic over the loop induction variable is abstracted away, the analysis of a loop is bounded. The analysis uses back substitutions to update state predicates. For example, at a statement x = y, each predicate on x in the incoming state is transformed to a corresponding predicate on y. We refer the reader to Reference [10] for details of the XYLEM analysis. The initial predicate hv = nulli is called the root predicate and the dereferenced variable v the root reference. The goal of procedure analyzeMethod is to identify null assignments to the root reference. At an assignment statement v = w, the root reference is updated to w and the root predicate becomes hw = nulli. analyzeMethod removes an element (s, Γ) from the worklist, and uses the dispatcher, passed in as a parameter, to select the predecessors of s (lines 6–7). In the original XYLEM analysis, the procedure selects all predecessors of s. If a predecessor is neither the entry node of the method nor a call node (line 9), the procedure com-
Figure 3: The XYLEM analysis extended to use stack traces to support our fault-localization approach. putes the state transformation induced by sp (line 10). When the procedure encounters a null assignment to the root reference, it has found an NPA—the root predicate becomes hnull = nulli, which is represented as htruei—and the algorithm adds sp to the set of NPAs (line 11). At a call site, the procedure uses summary information, which maps an incoming state Γ to an outgoing state Γ′ to which the called method transforms Γ. Using the summary information, the procedure avoids analyzing a method multiple times for the same state. On reaching a call site, the procedure first checks whether summary information exists for the current state (lines 13–15). If no summary exists, the algorithm descends into the called methods to analyze them (lines 16–20). It uses a call stack to ensure context-sensitive processing of called methods.3 After returning from the called method, the analysis saves the summary information for reuse in subsequent traversals (line 21). Consider the backward path (30, 28, 27, 33a, 32, 5a, 4b, 26, 25) traversed by the algorithm for the dereference of string1 at statement 30 in RTEExample (see Figure 1). Statement 25 transforms the root predicate hstring1 = nulli to hstring2 = nulli. Continuing backward from 25 along path (24, 4a, 3, 2b, 16, 14, 13), the algorithm reaches statement 13, which transforms predicate hstring2 = nulli to htruei; the algorithm, thus, identifies statement 13 as an NPA. 3 A context-sensitive analysis propagates states along interprocedural paths that consist of valid call–return sequences only—the path contains no pair of call and return that denotes control returning from a method to a call site other than the one that invoked it.
157
Figure 4: The two phases of the application of our approach to null pointer exceptions. algorithm FaultLoc input P program ST stack trace for execution E output Adefinite definite NPA for E Apossible possible NPAs for E Amaybe maybe NPAs for E Rmaybe maybe NPRs for E begin // Phase 1 analysis: Identify definite and possible NPAs 1. let sr(E) be the NPR for E 2. let Dcs be a dispatcher that selects the caller in ST for a method and all CFG predecessors of a node 3. Nd = computeNPA(sr(E) , Dcs ) 4. if |Nd | = 1 then Adefinite = Nd ; else Apossible = Nd
definite NPA, the possible NPAs, the maybe NPAs, and the maybe NPRs for E. This section discusses each of these phases in turn.
3.3.1
// Phase 2 analysis: Identify maybe NPAs and NPRs 5. let Da be a dispatcher that selects all callers of a method and all CFG predecessors of a node 6. Ns = computeNPA(sr(E) , Da ) 7. Amaybe = Ns − Nd 8. if |Adefinite | = 1 then 9. let sa be the NPA in Adefinite 10. perform a forward analysis from sa to identify reachable dereferences R; mark traversed nodes N 11. let Dt be a dispatcher that selects nodes in N 12. foreach sr in R do 13. N = computeNPA(sr , Dt ) 14. if N contains sa then 15. Rmaybe = Rmaybe ∪ sr end
Figure 5: Algorithm for performing Phase 1 and Phase 2 analyses of our approach. On reaching the entry to the method, the algorithm considers calling methods. The algorithm uses the dispatcher to determine which methods to consider (line 24). For the original XYLEM analysis, analyzeMethod is recursively called on each caller of the current method (lines 25–27).
3.3
Phase 1: Identifying definite and possible NPAs
To identify definite and possible NPAs for the exception raised at sr(E) for execution E, Phase 1 leverages the modified XYLEM analysis. We refer to the NPAs computed by the XYLEM analysis as static NPAs and the NPAs computed by the stack-trace-guided version of the analysis as dynamic NPAs. In Phase 1 (lines 1–4), the algorithm computes dynamic NPAs by invoking ComputeNPA with a dispatcher Dcs that guides the analysis along the call chain contained in the stack trace. Lines 23–27 of ComputeNPA (Figure 3) illustrate the stack-traceguided steps of the analysis. If the current method is not being analyzed in a specific context, the algorithm examines the stack trace and identifies the call site into which it ascends. For example, when the algorithm is invoked for execution 1 shown in Table 1, ComputeNPA starts traversal from statement 30. On reaching the entry of method3(), it ascends to call site 33a in method4() only—it does not ascend to call site 8a in main(). On reaching the entry of method4(), it ascends to call site 5a; finally, it identifies the null assignment at statement 13. For another example, when invoked with the stack trace for execution 2, the analysis ascends to call site 8a from the entry of method3(). At node 7b, it descends into method1() and identifies NPAs 19 and 21. At the end of Phase 1 of our algorithm, there is either one definite NPA or a set of possible NPAs identified (line 4 in Figure 5). Consider again Table 1. For execution 1, only one dynamic NPA (statement 13) is computed; therefore, that NPA is a definite NPA. For execution 2, two dynamic NPAs (statements 19 and 21) are computed; thus, those NPAs are possible NPAs. The type of dynamic information that is available about the failing execution affects the accuracy of our approach. With more detailed dynamic information, the approach will compute fewer possible NPAs. For example, for executions 2 and 3 in Table 1, the stack traces contain insufficient information for FaultLoc to determine which branch from condition statement 18 was taken. However, if branch traces were available for these executions, the algorithm would classify statement 19 as the definite NPA for execution 2 and statement 21 as the definite NPA for execution 3.
Our Two-phase Algorithm
Figure 4 presents an overview of the application of our approach to support fault localization and fault repair for Java null pointer exceptions. Phase 1 inputs a program and the stack trace from a failed execution, E, of that program in which a null pointer exception was raised. This phase performs a backward analysis, driven by the stack trace, to identify and output definite and possible NPAs. Phase 2 of the approach also inputs the program and stack trace for E, along with the NPAs identified in Phase 1. This phase performs two analyses: a backward analysis to identify and output maybe NPAs; and a combined forward and backward analysis to identify and output maybe NPRs. Both phases of the approach leverage the XYLEM analysis. Figure 5 presents the algorithm that performs the Phase 1 and Phase 2 analyses of our approach. Given a program P and the stack trace ST for execution E, the algorithm computes and returns the
3.3.2
Phase 2: Identifying maybe NPAs and NPRs
To identify maybe NPAs for the exception raised at sr(E) , and maybe NPRs for the definite NPA at sa(E) , Phase 2 of FaultLoc (lines 5–15) again leverages the XYLEM analysis. First, the algorithm uses the XYLEM analysis—passing in a dispatcher Da that returns all callers of a method and all CFG predecessors of a node—to identify static NPAs (lines 5–6). The algorithm computes the statements in the set difference between the static and dynamic NPA sets; these statements constitute the maybe
158
NPAs (line 7). For example, for execution 1 of RTEExample, the dynamic NPA set contains statement 13 only; the static NPA set of statement 30 includes statements 13, 19, and 21. The difference of the two sets (statements 19 and 21) forms the maybe NPAs for execution 1. Next, the algorithm identifies maybe NPRs (for a definite NPA sa ) in two steps. In the first step (line 10), the algorithm performs a forward analysis, starting at sa , to identify reachable dereferences of the null value generated at sa . The algorithm marks the nodes that are traversed during the analysis. For example, consider the definite NPA for execution 1 of RTEExample. Starting at statement 13, the algorithm walks forward in the ICFG1 to identify statements that may dereference string2, either directly or indirectly through transitive assignments and parameter passing. In this step, the algorithm identifies statements 22 and 29 as the reachable dereferences. In the second step (lines 12–15), for each NPR identified in the first step, the algorithm leverages the backward path-sensitive XYLEM analysis with the modification that it constrains the analysis (using dispatcher Dt ) to follow along only those paths that were traversed in step 1. If for an NPR sr , sa is identified as an NPA during the backward analysis, the algorithm adds sr to the set of maybe NPRs for E. Continuing with the example of execution 1, the algorithm invokes the XYLEM analysis once each for statements 22 and 29. When executed for statement 22, the analysis identifies statement 13 as an NPA. When executed for statement 29, the analysis—because it is path-sensitive—does not identify statement 13 as an NPA. On traversing edge (28, 29), the analysis collects the predicate hval > 1i. Eventually, the analysis reaches statement 16, which has two predecessors (statements 14 and 15). Following back along the in-edge from statement 15, the algorithm encounters the assignment of a new object to string2, which invalidates the root predicate hstring2 = nulli. Along edge (14, 16), the predicate hval ≤ 1i is generated, which also causes the state to become inconsistent. Therefore, the analysis traverses no further. The benefit of the two-step approach for computing maybe NPRs is that the second step, using the XYLEM analysis, can potentially filter out infeasible reachable dereferences that may be identified in the first step. Note that Phase 2 computes maybe NPRs for only the definite NPA (if any) that was identified in Phase 1. If Phase 1 computes possible NPAs, the developer would first want to identify which of those possible NPAs definitely caused the exception, and then compute the maybe NPRs for that NPA.
4.
combines the two approaches. In cases where different approaches computed the same information, we also considered the relative costs of computing the NPAs. Note that none of the existing techniques provide maybe NPR information. Thus, we did not compare our maybe-NPR analysis with others. We considered patterns based on four aspects of the NPAs. The first three are the types of NPAs (definite, possible, or maybe), where for each type, there can be no NPAs or some number of NPAs. The fourth is whether the NPA occurs in a method in the stack trace. With these four aspects of NPAs, there are 16 configurations. Eight of them cannot occur. The four that have a definite NPA and possible NPAs as part of the configuration cannot occur because, if a definite NPA is found, there can be no possible NPAs. The four that have no definite NPA and no possible NPAs as part of the configuration also cannot occur because, if a null pointer exception is raised, at least one of them is always identified by the analysis. The other eight configurations are shown in Table 2. In the table, the first column assigns a number to each pattern. The next three columns indicate whether NPAs of that type are identified by the analysis. The fifth column indicates whether the definite/possible NPAs occur in methods in the stack trace. The sixth column shows what would be found using the stack trace alone, the seventh column shows what would be found with the static analysis alone, and the last column shows what our technique would find. Consider Pattern 1 in which there is a definite NPA, no possible NPAs, no maybe NPAs, and no NPAs in any of the methods in the stack trace. Examining the stack trace alone does not directly reveal the NPA because the NPA does not occur in a method that is in the stack trace. Moreover, the stack trace provides no information about maybe NPAs. Static analysis alone can compute this NPA and, because it identifies only one NPA, it also knows that no maybe NPAs exist. If the definite NPA occurs in a stack method (Pattern 2), the stack trace can be used to identify it. However, finding the NPA by inspecting the stack trace can require significant manual effort and the stack trace provides no information about maybe NPAs. For Patterns 1 and 2, our stack-trace-guided technique provides the same information about NPAs that the staticanalysis approach provides. However, our technique can find this NPA more efficiently than the static analysis because it performs the analysis considering only the executed methods, whereas the static analysis must consider all calling methods, and thus, potentially traverses many more paths than our analysis. In Patterns 3 and 4, there are maybe NPAs along with a definite NPA. In such cases, although static analysis can identify all NPAs, it cannot distinguish the definite NPA from the maybe NPAs. Therefore, it cannot identify which of the NPAs definitely caused the null pointer exception to occur. Our technique can distinguish the two NPA types and, therefore, can help localize the fault and provide context information about related NPAs. In these patterns, the stack trace provides the same information as it does for Patterns 1 and 2. Thus, it may not be efficient for finding the definite NPA and it does not help in finding the maybe NPAs. In Patterns 5–8, there is no definite NPA. In such cases, static analysis cannot distinguish between possible and maybe NPAs. Consequently, it cannot guide developers by letting them focus on the NPAs that could potentially have caused the null pointer exception, while avoiding the NPAs that definitely could not have caused the exception. The stack trace provides similar information as it does for Patterns 1 and 2—it can help in directly finding the possible NPAs only if the NPAs occur in methods in the stack trace. Overall, the stack-trace approach is limited in that it cannot provide any information about the occurrences of maybe NPAs. Moreover, if the definite or possible NPAs do not occur in stack methods,
EVALUATION
To evaluate our approach, we performed both an analytical and an empirical study of it. This section first presents the analytical evaluation, then presents the empirical study, and finally, discusses the limitations and threats to the validity of the evaluation.
4.1
Analytical Study of Our Technique
The goal of this study is to compare our approach with other approaches that locate faults or provide context information for Java null pointer exceptions to determine (1) the differences in the NPA information that they compute and (2) the relative expense involved in computing these NPAs. To accomplish this goal, we considered the different patterns of occurrences of definite, possible, and maybe NPAs. For each pattern, we determined (1) which of the NPAs could be identified by a path-sensitive, context-sensitive static analysis [10] alone, (2) which of the NPAs could be identified using the stack trace alone, and (3) which of the NPAs could be identified by our technique that
159
Table 2: Patterns of occurrences of NPAs, and whether the different NPAs can be identified using (1) only the stack trace, (2) only the static analysis, and (3) our combined technique. Definite NPA
Possible NPA
Maybe NPA
Definite/Possible NPAs in a Method in the Stack Trace
1
Yes
No
No
No
2
Yes
No
No
Yes
Finds Definite
3
Yes
No
Yes
No
Does not find Definite directly,
4
Yes
No
Yes
Yes
Finds Definite
5
No
Yes
No
No
6
No
Yes
No
Yes
7
No
Yes
Yes
No
8
No
Yes
Yes
Yes
Using Only the Stack Trace Does not find Definite directly
Does not find Possible(s) directly May find Possible(s) directly Does not find Possible(s) directly May find Possible(s) directly
Finds the Definite, Finds that there are no Maybe(s)
Finds the Definite, Finds that there are no Maybe(s)
Finds but cannot distinguish the Definite and Maybe(s)
Finds the Definite and distinguishes Maybe(s)
Finds but cannot distinguish Possible(s) and Maybe(s)
Finds and distinguishes Possible(s) and Maybe(s)
The XYLEM tool uses the WALA analysis infrastructure6 to construct the call graph and the ICFG. XYLEM performs the analysis in two steps. In the first step, it performs points-to analysis, escape analysis, and control-dependence analysis. In the second step, it uses the results of the first step and performs null-dereference analysis. In this step, given a dereference from which to start the analysis, XYLEM performs the backward analysis to identify a path along which a null value can flow to the dereference. To implement the Phase 1 analysis, we extended the second step of the XYLEM tool to use stack-trace information while performing the program traversal. To implement the Phase 2 analysis, for the computation of maybe NPAs, we parameterized the analysis so that it does not return after identifying the first NPA, but performs a comprehensive traversal for a given NPR. The implementation of this phase currently computes all the maybe NPAs. We are implementing the component of Phase 2 that computes the maybe NPRs.
Empirical Study of Our Technique
To evaluate our technique empirically, we implemented it for null pointer exceptions using the XYLEM tool, and we conducted an empirical study using open-source projects and the BUGZILLA defect reports for those projects. This section first describes our experimental set up and then presents the results of the study.
4.2.1
Using Our Combined Technique
Finds nothing about Maybe(s)
the approach requires the data flow to be traced backward through called methods to find the NPAs, which may require significant manual effort. The static-analysis approach identifies all NPAs. However, if it computes more than one NPA, it cannot classify the NPA as definite, possible, or maybe. For example, if static analysis computes two NPAs, it cannot determine whether (1) both are possible NPAs or (2) one is a definite NPA and the other is a maybe NPA. In contrast to using these approaches alone, in most cases, our technique (which combines them), is more effective in locating the NPAs that could have caused the null pointer exception. Furthermore, our technique also provides context information in the form of NPAs that may cause the exception in other executions, and can be useful for repairing the fault.
4.2
Using Only the Static Analysis
4.2.2
Distribution of NPA types and patterns
The goal of this study is to determine the distribution of NPA types and patterns for program executions in which null pointer exceptions are thrown. To accomplish this goal, we analyzed each execution using the extended XYLEM tool and computed definite, possible, and maybe NPAs. We also identified the NPAs that occurred in methods in the stack traces. Table 3 presents the data that we collected. The table shows, for each subject, a subject number, the subject version and bug number (columns 1–2), and the number of definite, possible, and maybe NPAs (columns 3–5) that were computed. Column 6 lists the number of definite and possible NPAs that occurred in stack methods, and column 7 shows the pattern of occurrence of the NPAs (Table 2 lists the patterns). We highlight what the data indicate about the applicability of the three techniques for locating faults and context information: static analysis, stack trace, and our approach. For five of the 13 executions, for which static analysis computes more than one NPA, our approach provides the benefit of distinguishing definite/possible NPAs from maybe NPAs. For example, for execution 4, our approach classifies the three NPAs that static analysis computes as one definite and two maybes. Similarly, for execution 8, our approach classifies the two NPAs as one definite and one maybe. Static analysis cannot distinguish the NPAs that it computes. Thus, in such cases, using our approach, the developer would know which NPA definitely caused the exception and,
Experimental setup
Each subject for our experiment is a pair that consists of an application and a stack trace for a failing execution of the application. To gather subjects for our study, we used the following process. We browsed the BUGZILLA repository for defect reports that show occurrences of null pointer exceptions. Of these reports, we filtered out those that neither listed the stack trace nor listed the code version on which the failure was observed. For some of the reports, the listed code revisions were unavailable for download, or, if available, the source line numbers did not match the line numbers that appeared in the stack trace; we filtered out such reports as well. We also filtered out a report if the stack trace contained native methods or the JDK API methods.4 Table 3 lists the 13 executions—(project release, BUGZILLA ID) pairs—that we used for the study. The sizes of the applications in terms of the number of nodes in the ICFG1 vary from approximately 3,200 for NanoXML to over 185,000 for Ant-1.6.5.5 We implemented our approach using the XYLEM tool [10], which implements the null-dereference analysis described in Section 3.2. 4 Although we browsed the BUGZILLA repository extensively for several projects, we filtered out many of the bug reports for the reasons stated. 5 Most of the project distributions come with several jar files. We analyzed only a subset of those jar files based on the contents of the stack traces.
6
160
http://wala.sourceforge.net
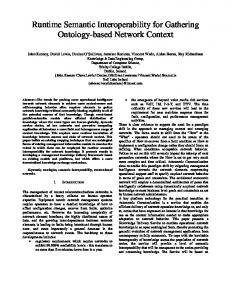
findFile() [1504] return findFile2(...); findFile2() [1522] if (!base.isDirectory()) { [1533] return null; ... [1541] return null;
Table 3: Distribution of NPA types for our subjects. Definite/ Possible NPAs in a Method Subject Definite Possible Maybe in the Pattern Project release Bug NPAs NPAs NPAs Stack Trace type 1 Ant 1.5 10360 1 0 0 0 1 2 Ant 1.5.1 15994 1 0 0 1 2 3 Ant 1.6.0 25826 1 0 0 1 2 4 Ant 1.6.2 31840 1 0 2 1 4 5 Ant 1.6.3 34878 0 2 0 0 5 6 Ant 1.6.5 38622 1 0 0 0 1 7 Fop 0.92beta 39553 1 0 0 1 2 8 NanoXML – 1 0 1 1 4 9 Tomcat 5.0.18 27077 1 0 0 1 2 10 Tomcat 5.0.25 29688 1 0 2 1 4 11 Tomcat 5.0.28 32130 1 0 0 1 2 12 Tomcat 5.5.12 37425 0 2 0 0 5 13 Xerces 1.3.0 2252 1 0 0 0 1
Next, consider execution 10 from Table 3 for which our approach computes a definite NPA (that is on the stack trace), and two maybe NPAs (Pattern 4). The partial stack trace for the execution, along with the source line containing the NPR, are shown below: ...catalina.startup.HostConfig.deployDescriptors 445 ...catalina.startup.HostConfig.deployApps 427 ...catalina.startup.HostConfig.check 1064 ...catalina.startup.HostConfig.lifecycleEvent 327 ...catalina.util.LifecycleSupport.fireLifecycleEvent 119 ...catalina.core.StandardHost.backgroundProcess 800 ... deployDescriptors(..., String[] files) [445] for ( int i=0; i