2012 31st International Symposium on Reliable Distributed Systems
Fault Localization in MANET-Hosted Service-Based Systems Petr Novotny and Alexander L. Wolf
Bong Jun Ko
Imperial College London London, United Kingdom {p.novotny09,a.wolf}@imperial.ac.uk
IBM T.J. Watson Research Center Hawthorne, New York, USA bongjun
[email protected]
tion (also called fault identification). This is a particularly challenging management task because the systems are subject to a wider variety and higher incidence of faults than those deployed in fixed networks, the resources available to track fault symptoms are severely limited, and many of the causes of failures in MANETs are by their nature transient (e.g., a mobile host that temporarily moves out of radio range). Further complicating the situation is that faults at the network level may not manifest themselves as failures at the service level, since service-based systems are designed to mask certain kinds of faults through mechanisms for dynamic service discovery and (re)binding. Therefore, a fault localization method suitable for MANET-hosted service-based systems must be adept at sifting through noisy data. In this paper we describe a method that makes use of two kinds of basic information: (1) a service dependence graph rooted at the client that initiated the conversation and reported the failure, and (2) various network- and service-level fault symptoms recorded in host-local logs. The dependence graph is discovered at run time by a decentralized monitoring system deployed in the network [7]. The monitoring system also collects the symptoms from the local logs. The graph and symptoms are used to carry out a centralized fault propagation analysis based on a fault propagation pattern, which indicates how faults can be propagated through the system from root causes to clients. The result of the analysis is a fault propagation model that relates possible root causes to the failure reported by the client. Finally, the faults are ranked for their likelihood of causing the failure. This paper makes the following specific contributions:
Abstract—Fault localization in general refers to a technique for identifying the likely root causes of failures observed in systems formed from components. Fault localization in systems deployed on mobile ad hoc networks (MANETs) is a particularly challenging task because those systems are subject to a wider variety and higher incidence of faults than those deployed in fixed networks, the resources available to track fault symptoms are severely limited, and many of the sources of faults in MANETs are by their nature transient. We present a method for localizing the faults occurring in service-based systems hosted on MANETs. The method is based on the use of dependence data that are discovered dynamically through decentralized observations of service interactions. We employ both Bayesian and timing-based reasoning techniques to analyze the data in the context of a specific fault propagation model, deriving a ranked list of candidate fault locations. We present the results of an extensive set of experiments exploring a wide range of operational conditions to evaluate the accuracy of our method.
I. I NTRODUCTION Mobile ad hoc networks (MANETs) are used in difficult or remote situations, such as emergency response or forestfire fighting, where a reliable, fixed-network communication infrastructure may be absent. However, the applications deployed upon MANETs are increasingly expected to exhibit sophisticated features, mimicking the availability of rich applications in “normal” network environments. It is no surprise, then, that MANETs are now hosting applications that are architected as flexible and dynamic collections of software services. In service-based systems, such as those based on the Service-Oriented Architecture (SOA) or Web Services frameworks, computations are structured as sets of services that respond to requests, where a request typically originates at a user-facing client. The computation required to fulfil each request results in a cascade of further requests across some subset of the services; services make requests on other services in order to fulfil the requests made upon them. The set of messages exchanged during the processing of a single client request is referred to as a conversation. We are concerned with a crucial operational aspect of service-based systems deployed on MANETs: fault localiza-
• • • •
Existing fault localization methods designed for the MANET environment [1], [2], [3], [4], [6] focus on network-level identification of individual faulty hosts and/or the links between them. Our method instead makes use of both service- and network-level information. This enables a decoding of the fault
This research was sponsored by the U.S. Army Research Laboratory and the U.K. Ministry of Defence and was accomplished under Agreement Number W911NF-06-3-0001. The views and conclusions contained in this document are those of the author(s).
1060-9857/12 $26.00 © 2012 IEEE DOI 10.1109/SRDS.2012.30
a method to synergistically analyze fault symptom data gathered at both the service and network levels; a fault propagation model based on propagation patterns devised specifically for the operational environment; timing-based and probabilistic root-cause ranking algorithms; and an extensive, simulation-based, experimental analysis.
243
propagation through the hosted services via the network. The client is therefore a good entry point for fault localization, tracing failures back to their sources using information that is unavailable from observations at the network level alone. Clearly, our method is subject to inaccuracies due to effects such as the delay between data collection and data analysis, and inaccuracies in the discovered dependencies representing the system structure. The essence of the present work is to understand how these and other factors impact the accuracy of our method, subject to various tuning and environmental parameters. We focus on the formulation of a basic method that assumes the complete availability of dependence and symptom information for all non-failing hosts in the network. However, in the longer term, but beyond the scope of this paper, we are also studying how incomplete dependence and symptom information can be accommodated in fault localization.
Fig. 2.
In earlier work [7], we developed a method to obtain probabilistically accurate DGs in a MANET-hosted, servicebased system. The method builds (i.e., “discovers”) the DG for a client on demand, which is an approach that is particularly well suited to fault localization because it allows us to obtain the DG for the client that has reported a failed conversation. Similar to symptoms, dependence information is gathered locally by distributed monitors deployed in service components that, in this case, observe the service-level message traffic (see Figure 1). The dependence information is provided— on demand, with respect to a particular client, and covering a specific time period—to a centralized dependence discovery element that then produces a corresponding DG. Of course, due to the difficult operational environment, the resulting DG can be expected to contain some false dependencies, as well as miss some true dependencies, although the discovery method is designed to minimize the occurrence of such inaccuracies. We must therefore take account of this in the design of the fault localization method. Besides the availability of dependence information, we make the following assumptions. First, each service records all failure symptoms in a local log, and the local monitor has access to the log. Second, log entries include information such as a time stamp, an identifier for the relevant host or service, and the type of symptom. Third, time stamps are globally consistent due to synchronized clocks. Clock synchronization in MANETs is a well-researched topic, with techniques available to achieve precision of tens or even single microseconds [10]. The smallest time period we use to distinguish time stamps is on the order of several milliseconds, well within this precision. Finally, there is a global timeout parameter shared by all clients and services. The timeout parameter defines the maximum waiting period for responses to requests. This is easily achieved in systems that use a common application platform, such as .NET or Java EE, which have a predefined default value. In systems that use a mix of platforms, explicit enforcement would be required.
II. S YSTEM A RCHITECTURE AND A SSUMPTIONS The goal of our fault localization method is to find the root cause of a failure in a conversation initiated by a client of a service-based system. The method uses a set of distributed monitors (Figure 1) that are deployed in service components (e.g., in a service container) and are responsible for extracting the symptoms of service failures from system logs. The monitors provide the symptoms, on demand, to a centralized fault localization element (positioned, for example, at an operator’s station) that runs the fault localization method.
Fig. 1.
Dependence graph rooted at a client.
Architecture of fault localization.
An essential input to our method is a dependence graph (DG) that captures the run-time dependencies among services. In service-based systems, a dependence is a relation between services defined by the message flow induced by a client request. (As an edge case, a dependence is also the relation between a client and a service. Without loss of generality, we mainly focus here on relations among services.) When a dependence relation exists between two services S1 and S2, one service is considered the source and the other the target. In general, sources issue requests (i.e., method calls) on targets, thus defining a directionality to the dependence. Targets are expected to provide replies (i.e., response messages) back to sources. A DG can be used to represent the full set of dependence relations in the system, or can be restricted a subset of those relations. Figure 2 shows a simple example of a DG rooted at a particular client.
III. FAULT L OCALIZATION At a high level, our fault localization method consists of three steps: (1) build a fault propagation model that represents how specific faults might propagate in the service systems, (2) form a set of plausible candidates for the root cause of failures by combining the fault propagation model with
244
observed symptoms, and (3) rank the candidates based on their likelihood of being the root cause of the failure. We consider here two specific kinds of symptoms: exceptions, which are explicit notifications of failures caused by a service or network fault, and timeouts, which are implicit notifications of failures caused when an expected response message has not arrived within a specified period of time. A. Fault propagation pattern (FPP) A fault propagation pattern (FPP) is a recursive description of how different kinds of failures can cause further failures, where the first failure in the propagation chain is the failure manifesting the root-cause fault. In service-based systems, the propagation flows upstream from target services back to source services in the service dependence structure. To enable a fine-grained analysis using propagation patterns, we classify the observable failure symptoms—exceptions and timeouts—into failure modes. A propagated exception (Figure 3a) can be generated as a result of one of the following modes: (1) a send failure (SENDF), which represents a service that is unable to send a message to another service due to a network-level fault; (2) a software failure (SF), which represents any internal software or data fault that throws an exception; and (3) an exception (EX), which is itself generated by a service in response to a failure in a downstream service. Notice that the first two are (manifestations of) actual root causes, while the third is the recursive behavior that leads to propagation.
(a)
(a)
(b) Fig. 4. Fault propagation model constructed from exception modes of Figure 3 mapped onto dependence graph of Figure 2. The full FPM (a) is reduced (b) by considering actual symptoms recorded in a given time window.
service dependence graph (DG) of a given client. An FPM contains a single node at its root to represent the failure mode witnessed by the client, and a set of nodes at its leaves to represent the failure modes of the candidate root causes. The internal nodes represent transitive failure modes. The edges signify possible failure propagation paths, which follow the reverse dependence edges in the DG. Figure 4a shows an example constructed by mapping the FPP of Figure 3 onto the DG of Figure 2. Since faults tend to be transient in MANETs and can affect the clients only for a limited period of time, an FPM maintains information concerning a specific time window, reflecting only the failure symptoms collected by monitors during that period. In principle, one needs to consider how long it would take all potential root-cause faults to propagate to a client. Ideally, the time period should be long enough to cover the longest such propagation, but no longer, so as not to include considerable noise in the data. Operationally, upon receiving a failure report from a client, the fault localization element builds the FPM with respect to the reported failure. To do so, the dependence discovery element is queried for the DG associated with the failed conversation. The DG is then combined with the FPP and transformed into an FPM for the specific kind of failure, according to the following steps:
(b)
Fig. 3. Fault propagation pattern refined into modes for exception failures (a) and timeout failures (b) in service-based systems. Faults propagate upstream from targets back to sources in the service dependence structure.
A propagated timeout can be caused only by some other timeout. This is because the timeout event is an implicit symptom of a fault whose real cause is not directly observable and, hence, not itself recordable as a symptom. Examples include a network host that moves out of communication range or the physical failure of a host. We identify two timeout modes (Figure 3b) that can cause further upstream timeout failures: (1) a root-cause timeout mode (RC TO), which results implicitly from a network-level fault, and (2) a transitive timeout mode (TO), which results from a timeout occurring in some downstream service. B. Fault propagation model (FPM)
1) Every leaf service of the DG is transformed into the rootcause failure modes of the FPP; every intermediate node of the DG is transformed into root-cause and transitive failure modes; and the client node is transformed into a single transitive mode representing the client failure.
Our technique makes use of a fault propagation model (FPM), a graph representing the causality relations between failure events in a system. An FPM is the result of mapping the fault propagation pattern (FPP) described above onto the
245
Bayesian-based ranking
2) The edges representing cause-and-effect relations between modes are assigned based on the dependencies in the DG such that every mode of a target service is connected to the respective mode of a source service. 3) The fault localization element contacts the monitors of the services included in the DG/FPM in order to harvest locally aggregated symptom data for the time window of interest, and assigns the symptoms to the relevant modes of the FPM.1 4) The FPM is reduced to a set of candidate root-cause failure modes based on the actual symptoms recorded within the given time window. It is further reduced to the set of candidate root-cause modes that are connected to the client failure mode either directly or by propagation paths through the remaining transitive modes. The resulting FPM contains the set of candidate root-cause failure modes that are reachable to the client directly or through transitive modes, and the set of transitive modes that are on propagation paths between at least one root-cause mode and the client. For example, the FPM of Figure 4a can be reduced to the FPM of Figure 4b if we assume the following symptoms are recorded in the given time window: services S6 and S7 experienced software failures (SF); services S2, S3, S7, and S8 experienced message send failures (SENDF); and services S1, S2, S3, and S4 received exception messages (EX).
Our second algorithm assigns the ranks to the candidates in the order of probability that the candidate is the root cause. The probabilities are inferred on the Bayesian network (BNet) constructed from the reduced FPM, with the direction of the BNet edges reversed from those in the FPM, thereby computing the probability of propagation in reverse order. For the failure propagation probabilities in the BNet, we use the noisy-OR gate distribution model of the conditional probability distribution (CPD), due to its computational and space efficiency [5]. We calculate the CPD of a node in the BNet such that the conditional probability of a parent node in the CPD, given the occurrence of the mode in a child node (i.e., the probability of propagation from parent to child node), is equal to the proportional fraction that the parent represents in the set of all parents of the particular child node in the FPM. Also, in order to reflect the decreasing effect of each transition on the probability of the mode to be the root cause, the conditional probability of each parent is multiplied by a constant smaller than (yet close to) one. (We use 0.99 in our experiments.) For the inference of the posterior probability of the root cause modes, we use the junction-tree algorithm [9], which is an exact inference algorithm suitable for small-to-medium sized, multi-level directed acyclic graph models such as those we expect in our analysis context.
C. Ranking candidate faults
IV. E VALUATION
Given an FPM that consists of possible root-cause failure modes, the next step is to rank the candidate root-cause faults in the order of their likelihood of being the actual root cause of the client failure. We consider two approaches to ranking the candidates: one based on occurrence time and the other based on Bayesian probabilities.
In this section we present experiments evaluating our fault localization method. The evaluation question of interest centers mainly on the accuracy of the resulting candidate set, specifically the ranking of root-cause candidates. A good result, of course, would be that our method consistently ranks the correct root-cause candidate at or near the top. In this paper we present results that compare the two ranking approaches and show the impact of service connectivity on accuracy. A more comprehensive set of evaluation results, reflecting other environmental factors and parameter choices, is available elsewhere [8].
Timing-based ranking The timing-based ranking approach follows from the observation that failures will propagate relatively quickly from root causes to clients even though conversations might last a long time. In particular, intermediate services typically generate exception responses immediately upon receiving an exception response from other services, while timeout events in the services involved in a conversation tend to occur within a relatively short period because services set their timeout timers when they send service requests. Based on this observation, our timing-based algorithm ranks the candidate root-cause failures appearing in the reduced FPM in increasing order (from shortest to longest) of the difference between the time stamp of the client failure symptom and the occurrence time of the candidate. Since the recorded symptoms are aggregated in our method, the occurrence time of a symptom itself is determined by the time stamp of the latest symptom of the failure in the case of an exception or the earliest symptom of the failure in the case of a timeout.
A. Methodology The evaluation is carried out on a simulation framework for service-based systems hosted on MANETs [7]. The framework consists of a simulation engine built on top of the discreteevent network simulator NS-3 extended with higher-level abstractions for simulating service entities and their interactions. The engine generates message and fault traces according to various simulation parameters and scenario configurations. These traces are stored in a database to hold the results of the simulation runs. Dependence discovery, the causality analysis that contributes to an FPM, and the timing-based ranking are prototyped as queries over this database. For the BNet ranking we use MATLAB with the Bayes Net Toolbox. The network-level behaviors in the simulation are based on the log distance model with path-loss exponent 3 for wireless signal propagation, a network of 50 mobile hosts in a 75x75
1 The aggregation applied depends on the kind of failure mode associated with the recorded symptom: For exceptions it is the latest in the time window, while for timeouts it is the earliest.
246
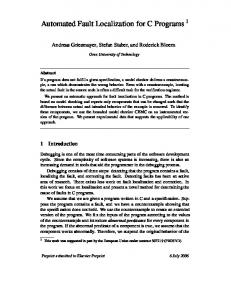
Accuracy is measured in terms of the ranking position of the correct root-cause fault for each failed conversation in the experiment. The results are given in Figure 5, which shows the cumulative distribution of those positions. For purposes of comparison, we include the results for the BNet algorithm under a 60-second time window. (We do not show the corresponding results for the timing-based algorithm, since they are virtually the same for both time window sizes.) Notice that the average sizes of the candidate sets under the 6-second time window is 1.5 for exceptions and 2.6 for timeouts, and 5 and 3.5 under the 60-second time window.
meter area, and the Optimized Link State Routing Protocol (OLSR) for routing. We simulate the random mobility of hosts moving at a speed of 10 m/s, which represents a fairly dynamic condition. The significance of such a high speed is that the hosts are frequently disconnected from each other, causing a high incidence of network-level faults (i.e., message send failures and timeout failures). The service-level parameters used in our simulations are derived from standard values found in SOA and Web Services implementations. We generate a system of 50 clients and 30 services, with the services arranged into five “front end” (client facing) and 25 “back end” services. We simulate two kinds of service-level faults: In the first kind, the service fails to generate proper responses to the service requests and instead generates exceptions, while in the second, the service itself fails and does not generate any response. All of our experiments use a service fault rate of 0.5%, which means 5 out of every 1000 service requests fail. We configure the simulations such that 90% constitute exception root-cause faults (SENDF or SF) and 10% timeout root-cause faults (RC TO). We use “Low” and “High” connectivity scenarios representing sparsely and densely connected service systems. The average number of services in the dependence graph is 2.03 in the low connectivity configuration and 7.9 in the high connectivity configuration, with a standard deviation of 1.2 and 3.63, respectively. The low connectivity configuration results in 8541 conversations, while the high connectivity configuration results in 6810 conversations. The time window size is an important tuning parameter for our method, as it affects which failure symptoms are included in the FPM. When selecting the size of the time window, one needs to consider how long it would take for root-cause faults to propagate to clients. A na¨ıve approach would be to set the value equal to the longest duration that a conversation can last. In practice, however, the failure propagation time can be much shorter than the duration of the entire conversation, and hence the time window size also needs to be selected accordingly. Based on our observation of the distribution of the propagation time for root-cause faults to reach clients in each of the two service connectivity scenarios, we use a 6second time window. Note, however, that this value is chosen based on empirical results, and hence should be considered as one that is close to an ideal. To reflect cases when such an empirical basis is not available, results under a 60-second time window are also shown. All reported numbers are averaged results for individual conversations collected from 30 minutes of simulated execution time after excluding an initial 30 second warm-up period.
(a)
(b) Fig. 5. Accuracy of ranking algorithms for exception (a) and timeout (b) faults in high connectivity scenario. The FPM is constructed from the groundtruth dependence graph.
We can see that the timing-based method is very effective for exception failures, resulting in more than 90% of correct root causes placed in the first position of the ranking, under both 6-second and 60-second time windows. Compare this with a random ordering, which would do so only for 66% and 20% under 6- and 60-second time windows, respectively. This good result is due to the fact that exception failures are propagated through a quick succession of explicit messages, which makes a ranking based on the time proximity particularly suitable for such failures. On the other hand, the BNet-based algorithm is more effective in ranking the root causes of timeout failures. Under a 6-second time window size, the BNet-based algorithm places the correct root causes in the first position for more than 95% of the failures, and for nearly 60% under 60-second time window. Compare this again with a random ordering, which would achieve the same only for 38% and 28% of the cases
B. Comparison of ranking algorithms We first compare the accuracy of the ranking algorithms. To isolate their effect from those of other parameters, we show the results for high service connectivity with 0.5% service fault rates, using 100% accurate dependence graphs, which contain exactly the services involved in each conversation.
247
speeds, and the impact of dependence graph accuracy [8]. These results further demonstrate the overall robustness of our method. An important consideration in the MANET environment is the requirement for data storage and transfer. Our method performs well in this regard. The method does not store any of its own data on hosts beyond dependence data, which can be made highly compact [7]. Instead, the method makes use of standard log information typically already stored at a host. Communication costs are minimized by collecting the necessary data on demand in aggregated form; we have calculated that on average less than 1KB of payload is required for a given client failure analysis.
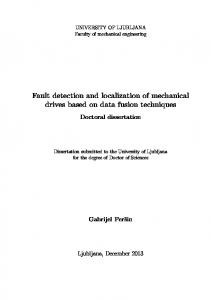
under the two time window sizes, respectively. The accuracy of the timing-based algorithm is not nearly so good for the timeout failures. C. Impact of service connectivity We now turn to the impact of service connectivity (i.e., system complexity) on the accuracy of our method. It is important to investigate this factor because it influences many other contributing factors, such as the size and false positive ratios of dependence graphs, the duration of conversations (and, consequently, the amount of overlap between separate conversations), and the overall failure rate exhibited by the system. We hypothesize that the accuracy of the fault localization method will suffer under highly connected services, since the combined effect of the increases in the above factors should have a negative impact on the ranking position. We present our results in Figure 6. These results confirm our hypothesis: In the low-connectivity scenario, our method achieves significantly better accuracy for both ranking algorithms than in the high-connectivity scenario. The better result for low connectivity is due to the relatively small number of services involved in each conversation (on average, 2.03 versus 7.9), the relatively low degree of overlap of conversations, the relatively low dependence graph false positive ratio (0.2% versus 3%) and a lower inherent failure rate (5.01% versus 20.88%). The reverse is true for the high-connectivity scenario.
V. C ONCLUSION We have presented a new fault localization method suitable for service-based systems hosted on mobile ad hoc networks. The method analyzes the failures experienced and reported by clients of the service-based system in order to locate the rootcause fault, making use of symptoms observed at both the service and network levels. To cope with the temporal aspects of the problem, the method uses multiple elements to filter out irrelevant symptoms. These include a dynamic dependence graph rooted at the client, a fault propagation model, and algorithms to rank candidate root causes. An extensive set of simulation-based experiments demonstrates that our method achieves fault localization results with high accuracy in a range of situations. It does so while incurring low data storage and transfer costs, making it ideally suited to the resourceconstrained MANET environment. R EFERENCES [1] A. Cavalcante and M. Grajzer. Fault propagation model for ad hoc networks. In Proceedings of the IEEE International Conference on Communications, pages 1–5, June 2011. [2] S. Chessa and P. Santi. Comparison-based system-level fault diagnosis in ad hoc networks. In Proceedings of the 20th IEEE Symposium on Reliable Distributed Systems, pages 257–266, 2001. [3] M. Elhadef, A. Boukerche, and H. Elkadiki. A distributed fault identification protocol for wireless and mobile ad hoc networks. Journal of Parallel and Distributed Computing, 68(3):321–335, Mar. 2008. [4] M. Fecko and M. Steinder. Combinatorial designs in multiple faults localization for battlefield networks. In Proceedings of the IEEE Military Communications Conference, volume 2, pages 938–942, 2001. [5] D. Heckerman. A tractable inference algorithm for diagnosing multiple diseases. In Proceedings of the Fifth Annual Conference on Uncertainty in Artificial Intelligence, pages 163–172, 1989. [6] M. Natu and A. S. Sethi. Using temporal correlation for fault localization in dynamically changing networks. International Journal of Network Management, 18(4):301–314, Aug. 2008. [7] P. Novotny, B. J. Ko, and A. L. Wolf. Discovering service dependencies in mobile ad hoc networks. Technical Report DTR-2012-2, Department of Computing, Imperial College London, Feb. 2012. [8] P. Novotny, B. J. Ko, and A. L. Wolf. Techniques for locating service faults in mobile ad hoc networks. Technical Report DTR-2012-3, Department of Computing, Imperial College London, Apr. 2012. [9] T. A. Stephenson. An introduction to Bayesian network theory and usage. Technical Report IDIAP-RR-03-2000, Dalle Molle Institute for Perceptual Artificial Intelligence, Martigny, Switzerland, Feb. 2000. [10] D. Zhou and T.-H. Lai. An accurate and scalable clock synchronization protocol for IEEE 802.11-based multihop ad hoc networks. IEEE Transactions on Parallel and Distributed Systems, 18(12):1797–1808, Dec. 2007.
Fig. 6. Impact of service connectivity on mean ranking position of correct root-cause fault.
Notice that in our other experiments we use the settings for a high service connectivity. This means that those results are based on a substantially more challenging scenario. D. Summary of results and discussion The experimental results above demonstrate the effectiveness of our fault localization method in ranking the correct root causes of failed service conversations. In particular, timingbased ranking is shown to be very effective in localizing the failures caused by service exceptions, while Bayesian-based ranking is more effective in the case of timeout failures. This suggests that these two approaches can be separately employed depending on the kind of failure reported by a client. Besides the results presented above, we have investigated several other variables, most importantly the accuracy of our method under a range of service fault rates and mobility
248