nanomaterials Article
Fe3+-Doped TiO2 Nanotube Arrays on Ti-Fe Alloys for Enhanced Photoelectrocatalytic Activity Jiangdong Yu, Zhi Wu, Cheng Gong, Wang Xiao, Lan Sun * and Changjian Lin State Key Laboratory of Physical Chemistry of Solid Surfaces, Department of Chemistry, College of Chemistry and Chemical Engineering, Xiamen University, Xiamen 361005, China;
[email protected] (J.Y.);
[email protected] (Z.W.);
[email protected] (C.G.);
[email protected] (W.X.);
[email protected] (C.L.) * Correspondence:
[email protected]; Tel.: +86-592-2184655 Academic Editor: Thomas Nann Received: 10 May 2016; Accepted: 1 June 2016; Published: 6 June 2016
Abstract: Highly ordered, vertically oriented Fe3+ -doped TiO2 nanotube arrays (Fe-TNTs) were prepared on Ti-Fe alloy substrates with different Fe contents by the electrochemical anodization method. The as-prepared Fe-TNTs were characterized by scanning electron microscope (SEM), transmission electron microscopy (TEM), X-ray diffraction (XRD), X-ray photoelectron spectroscopy (XPS) and related electrochemical techniques. XPS results demonstrated that Fe3+ ions were successfully doped into TiO2 nanotubes. The photoelectrochemical activity of Fe-TNTs was compared with that of pure TiO2 nanotube arrays (TNTs). The results showed that Fe-TNTs grown on low concentration (0.5 wt %–1 wt % Fe) Ti-Fe alloys possessed higher photocurrent density than TNTs. The Fe-TNTs grown on Ti-Fe alloy containing 0.8 wt % Fe exhibited the highest photoelectrochemical activity and the photoelectrocatalytic degradation rate of methylene blue (MB) aqueous solution was significantly higher than that of TNTs. Keywords: Fe3+ doping; TiO2 nanotube arrays; Ti-Fe alloy; anodization; photoelectrocatalytic activity
1. Introduction Since the discovery of photocatalytic water splitting on the TiO2 surface, TiO2 has been shown as an admirable photocatalyst to decompose organic contaminant, and it has attracted extensive interest. It is well known that the one-dimensional (1D) materials, including nanotubes, nanofibers, nanowires, and carbon nanotubes, have shown many desirable advantages in photoresponsive properties, and have been reported to improve charge transport in a number of ways [1–5]. Among them, the TiO2 nanotube arrays (TNTs), since they were first synthesized by Grimes et al. in 2001 [6], have drawn much attention due to their unique properties, such as a highly ordered array structure, a highly specific surface area, outstanding mechanical and chemical stability as well as good charge-transport properties [7]. However, TiO2 can only adsorb UV light due to its wide band gap of 3.2 eV (anatase), which limits its efficient use of solar energy since UV light accounts for less than 4% of the solar spectrum. Therefore, many efforts have been explored in order to narrow the band gap and align the band-edge positions, including metal ion doping [8,9], non-metal ion doping [10], noble metal deposition [7,11], semiconductor coupling [12,13], and dye sensitization [14]. Comparatively, doping TiO2 with transition metal ions can introduce mid-gap energy levels. Moreover, moderate doping can facilitate the separation of photogenerated electron-hole pairs [15], hence prolonging the lifetime of electron-hole pairs and enhancing the photocatalytic activity [16]. For metal ion doping, Fe3+ is considered a promising dopant of TiO2 in terms of its ion radius (0.64 Å) close to Ti4+ (0.68 Å), and it could replace Ti4+ in the lattice without significant alteration of the crystalline structure [17]. Furthermore, Fe3+ is relatively stable due to its 3d5 (semi-full Nanomaterials 2016, 6, 107; doi:10.3390/nano6060107
www.mdpi.com/journal/nanomaterials
Nanomaterials 2016, 6, 107
2 of 12
high spin) electronic configuration, and so the trapped charges can easily release to participate in photoelectrocatalytic reaction [18]. In recent years, it was found that highly ordered TNT layers grown on Ti substrate can be doped with Fe3+ using electrochemical anodic oxidation [19] and ultrasound-assisted impregnating-calcination [20], and the photocatalytic activity of TNTs can be Nanomaterials 2016, 6, 107 2 of 12 significantly enhanced after Fe doping. It is noteworthy that anodization of Ti alloy provides a direct way to incorporate metal ions the latticeFeof TiO Mor et to al. its fabricated self-aligned, 3+ is 2 [21–23]. crystalline structure [17].into Furthermore, relatively stable due 3d5 (semi-full high spin) vertically configuration, and by so anodic the trapped charges easily release participate different in oriented electronic Ti-Fe-O nanotube arrays oxidation of can Ti-Fe metal filmstocontaining Fe photoelectrocatalytic reaction [18]. In recent years, it was found that highly ordered TNT layers content co-sputtered on fluorine-doped tin oxide (FTO)-coated glass [15]. However, most of Fe elements grown on Ti substrate can be doped with Fe3+ using electrochemical anodic oxidation [19] and existed in the form of a-Fe2 O3 and only a small amount of Fe3+ was incorporated in the TiO2 lattice. ultrasound-assisted impregnating-calcination [20], and the photocatalytic activity of TNTs can be In recentsignificantly years, Fe-doped been fabricatedthat by anodization the electrochemical anodization enhancedTNTs after Fehave doping. It is noteworthy of Ti alloy provides a direct of Ti-Fe alloy in ethylene glycol solution 0.25ofwt NH4 F Mor and et10al.wt % H2 Oself-aligned, [24], but were not way to incorporate metal ionscontaining into the lattice TiO% 2 [21–23]. fabricated vertically oriented Ti-Fe-O nanotube arrays anodic oxidation Ti-Fe metal films containingactivity of characterized systematically. In particular, therebyare no reports onofthe photoelectrocatalytic Fe-dopeddifferent TNTs. Fe content co-sputtered on fluorine-doped tin oxide (FTO)-coated glass [15]. However, most of Fe elements existed in the form of a-Fe2O3 and only a small amount of Fe3+ was incorporated In this work, Fe3+ -doped TiO2 nanotube arrays (Fe-TNTs) with different Fe contents were in the TiO2 lattice. In recent years, Fe-doped TNTs have been fabricated by the electrochemical fabricated through electrochemical anodic oxidation using Ti-Fe the 10 substrate anodization of Ti-Fe alloy in ethylene glycol solution containing 0.25 wtalloy % NHas 4F and wt % H2Oin 0.5 wt [24], but were not systematically. In particular, The therephotoelectrocatalytic are no reports on theactivity of % HF aqueous solution andcharacterized were investigated comprehensively. photoelectrocatalytic Fe-doped TNTs. the samples was evaluatedactivity by theofphotoelectrocatalytic degradation of methylene blue (MB) aqueous In this work, Fe3+-doped TiO2 nanotube arrays (Fe-TNTs) with different Fe contents were solution under UV and visible light irradiation. Taking advantage of photocurrent and electrochemical fabricated through electrochemical anodic oxidation using Ti-Fe alloy as the substrate in 0.5 wt % HF impedance spectroscopy (EIS) techniques, transfer behavior of photogenerated charges of Fe-TNTs aqueous solution and were investigatedthe comprehensively. The photoelectrocatalytic activity of the was analyzed. samples was evaluated by the photoelectrocatalytic degradation of methylene blue (MB) aqueous solution under UV and visible light irradiation. Taking advantage of photocurrent and
2. Results and Discussion electrochemical impedance spectroscopy (EIS) techniques, the transfer behavior of photogenerated charges of Fe-TNTs was analyzed.
2.1. Morphological Characterization 2. Results and Discussion
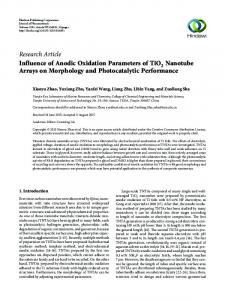
Figure 1a shows the top-view and cross-section-view scanning electron microscope (SEM) images 2.1.after Morphological Characterization of pure Ti anodization. Highly ordered and vertically oriented TiO2 nanotubes were formed Figure 1a shows the top-view and 60 cross-section-view microscope with an average tube diameter of around nm and a tubescanning lengthelectron of about 250 nm (SEM) (shown in the images of pure Ti after anodization. Highly ordered and vertically oriented TiO 2 nanotubes were inset of Figure 1). Figure 1b–e are the SEM images of Ti-Fe alloys with different Fe content after formed with an average tube diameter of around 60 nm and a tube length of about 250 nm (shown in anodization. It can be seen that the tube diameter and length of the nanotubes grown from Ti-Fe alloy the inset of Figure 1). Figure 1b–e are the SEM images of Ti-Fe alloys with different Fe content after were almost the same as those TNTs anddiameter were independent iron content. Nevertheless, the anodization. It can be seenof that the tube and length of of thethe nanotubes grown from Ti-Fe EDS spectrum of almost the Ti08Fe after anodization iswere shown in Figure 1f iron to identify the presence of Fe. alloy were the same as those of TNTs and independent of the content. Nevertheless, the percentage EDS spectrumof of each the Ti08Fe after anodization shown1.inThe Figure to identify presence Fe. The atomic element is listed inisTable C 1f element is the ascribed toofadventitious The atomic percentage of each element is listed in Table 1. The C element is ascribed to adventitious hydrocarbon from the instrument itself, while the F element results from the anodization electrolyte. hydrocarbon from the instrument itself, while the F element results from the anodization electrolyte. Notably, Notably, the change of Fe content in Fe-TNTs was consistent with that in Ti-Fe alloys. the change of Fe content in Fe-TNTs was consistent with that in Ti-Fe alloys.
Figure 1. Top-view scanning electron microscope (SEM) images of the nanotube arrays grown on (a) Ti; (b) Ti05Fe; (c) Ti08Fe; (d) Ti10Fe; (e) Ti50Fe and (f) energy dispersive spectrum (EDS) pattern of Ti08Fe. The insets were the corresponding cross-sectional images.
Figure 1. Top-view scanning electron microscope (SEM) images of the nanotube arrays grown on (a) Ti, (b) Ti05Fe, (c) Ti08Fe, (d) Ti10Fe, (e) Ti50Fe and (f) energy dispersive spectrum (EDS) pattern of Ti08Fe. The insets were the corresponding cross-sectional images. Table 1. Composition of the as-prepared Fe-TNTs (TiO2 nanotube arrays) based on different Fe-Ti alloys (atomic percentage according to energy dispersive spectrum (EDS)). Nanomaterials 2016, 6, 107
3 of 12
Samples C F Ti O Fe Ti05Fe 2.66 2.52 42.65 51.61 0.55 Table 1. Composition of the as-prepared Fe-TNTs arrays) based on different Fe-Ti 2 nanotube Ti08Fe 3.13 2.14 (TiO 42.19 51.67 0.87 alloys (atomic percentage according to energy dispersive spectrum (EDS)). Ti10Fe 3.20 2.60 41.66 51.43 1.11 Ti50Fe 3.04 0.81 38.61 52.70 4.83 Samples C F Ti O Fe 2.2. CrystallineTi05Fe Structure Characterization 2.66 2.52 42.65 51.61 0.55 Ti08Fe 3.13 2.14 42.19 51.67 0.87 prepared Taken as a representative of nanotube arrays, the crystalline structure of the Fe-TNTs Ti10Fe 3.20 2.60 41.66 51.43 by anodizing Ti08Fe alloy was characterized by transmission electron microscopy1.11 (TEM). Figure Ti50Fe 3.04 0.81 38.61 52.70 4.83 2a,b show the low-magnification top and cross-sectional images of Ti08Fe, respectively. The nanotubes have a diameter of ~60 nm and a length of ~250 nm, which is consistent with the observation in SEM. Characterization The high-magnification cross-sectional image of the sample is shown in Figure 2.2. Crystalline Structure 2c. Unlike those Fe-TNTs reported previously [25], the constituent of nanotube array film was Taken as a representative of nanotube arrays, crystalline of the thecorresponding Fe-TNTs prepared homogenous and no iron oxide nanoparticles couldthe be found. Figurestructure 2d displays by anodizing Ti08Fe TEM alloyimage. was characterized by transmission microscopy (TEM). Figure 2a,b high resolution The intact lattice fringe of 0.351 electron nm corresponded to the interplanar show the low-magnification and cross-sectional images of Ti08Fe, spacing of the (110) planetop of anatase TiO2, confirming that the Fe-TNTsrespectively. were anatase.The nanotubes have crystalline structure of samples by X-ray diffraction (XRD). Figure 3 The a diameterThe of ~60 nm and a length of ~250 was nm,further whichanalyzed is consistent with the observation in SEM. shows the XRD patterns for the anodized Ti-Fe alloys and pure Ti. The predominant peak at high-magnification cross-sectional image of the sample is shown in Figure 2c. Unlike those Fe-TNTs approximately 2q = 25.2° corresponds to the (101) face of anatase TiO2. It is evident that the anatase reported previously [25], the constituent of nanotube array film was homogenous and no iron oxide phase can be identified in all samples after annealing at 450 °C for 30 min. It is noteworthy that the nanoparticles could be found. Figure 2d displays the corresponding high resolution TEM image. The phases of iron oxide still cannot be found, even after the Fe content was further increased to 5.0 wt %. intact The lattice fringe 0.351 nm corresponded to Fe the interplanar ofand the substituted (110) planeTiof anatase 3+ diffused 4+ in absence of of iron oxide may be attributed to alongspacing the с-axis TiO2 , confirming that the Fe-TNTs were anatase. the TiO2 lattice [26].
Figure 2. Transmission electron microscopy (TEM) images of Fe-TNTs based on Ti08Fe: (a) low magnification of top-view image; (b) low magnification of cross-section-view image; (c) high magnification of cross-section-view image; and (d) HRTEM image. TNTs: TiO2 nanotube arrays (TNTs).
The crystalline structure of samples was further analyzed by X-ray diffraction (XRD). Figure 3 shows the XRD patterns for the anodized Ti-Fe alloys and pure Ti. The predominant peak at approximately 2q = 25.2˝ corresponds to the (101) face of anatase TiO2 . It is evident that the anatase phase can be identified in all samples after annealing at 450 ˝ C for 30 min. It is noteworthy that the phases of iron oxide still cannot be found, even after the Fe content was further increased to 5.0 wt %. The absence of iron oxide may be attributed to Fe3+ diffused along the c-axis and substituted Ti4+ in the TiO2 lattice [26].
Nanomaterials 2016, 6, 107 Nanomaterials 2016, 6, 107
4 of 12 4 of 12
Figure 2. Transmission electron microscopy (TEM) images of Fe-TNTs based on Ti08Fe: (a) low magnification of top-view image;microscopy (b) low magnification cross-section-view image;(a)(c)low high Figure 2. Transmission electron (TEM) images of of Fe-TNTs based on Ti08Fe: magnification of cross-section-view image; and (d) HRTEM image. TNTs: TiO 2 nanotube arrays magnification Nanomaterials 2016, 6, 107 of top-view image; (b) low magnification of cross-section-view image; (c) high 4 of 12 (TNTs). magnification of cross-section-view image; and (d) HRTEM image. TNTs: TiO2 nanotube arrays (TNTs).
Figure 3. 3. X-ray diffraction (XRD) patterns the nanotube arrays grown onTiand Tiand different Ti-Fe Figure 3. X-ray diffraction (XRD) patterns of theof arrays grown on on Tiand different Ti-Fe alloys. Figure X-ray diffraction (XRD) patterns ofnanotube the nanotube arrays grown different Ti-Fe alloys. alloys.
ToTo investigate the oxidation state of Fe in Fe-TNTs, the the Fe Fe 2p 2pcore corelevel levelwas wasmeasured measured by X-ray investigate X-ray To investigatethe theoxidation oxidationstate stateof of Fe Fe in in Fe-TNTs, Fe-TNTs, the Fe 2p core level was measured byby X-ray photoelectron spectroscopy (XPS) and shown inFigure Figure 4b. There were two peaks photoelectron spectroscopy (XPS) and the results are shown shownin in Figure 4b. There were two peaks photoelectron spectroscopy (XPS) andthe theresults results are are 4b. There were two peaks forforfor as-prepared Fe-TNTs in the high resolution spectrum of Fe 2p. The peaks located at 709.4 and 723.3 as-prepared Fe-TNTs of Fe Fe2p. 2p.The Thepeaks peakslocated located 709.4 and 723.3eV as-prepared Fe-TNTsininthe thehigh highresolution resolution spectrum spectrum of atat 709.4 and 723.3 caneV be assigned to thetoto Fe 2p and thethe FeFe 2p2p spectra [19], respectively, indicating can bebe assigned the Fe 2p 3/2 1/2photoemission photoemissionspectra spectra [19], respectively, indicating eV can assigned the Fe 2p 3/2and and the Fe photoemission [19], respectively, indicating 3/2 1/2 Fe element mainly exists the +3valence valence state. 4c,d show the XPS spectra of of of thethe Fethe element mainly exists ininin the +3 Meanwhile,Figure Figure 4c,d show the XPS spectra Fe element mainly exists the +3 valence state. Meanwhile, Meanwhile, Figure 4c,d show the XPS spectra elements nanotube arrays, respectively. The peak positions ofof both the 2p2p core level Ti Ti and OO elements ofofnanotube arrays, respectively. The peak positions both the core level Ti and Oand elements of nanotube arrays, respectively. The peak positions of both the Ti Ti 2p core level and and the O 1s core level of Fe-TNTs were shifted to a lower binding energy compared to TNTs. This and the O 1s core level of Fe-TNTs were shifted to a lower binding energy compared to TNTs. This the O 1s core level of Fe-TNTs were shifted to a lower binding energy compared to TNTs. This can be 3+ thesubstitution substitution ofby Ti4+4+ ions by ininthe of of Ti-O-Fe 3+ ions, 3+ ions, cancan bebe attributed totothe of Ti by Fe Fe ions,resulting resulting theformation formation Ti-O-Fe attributed toattributed the substitution of Ti4+ ions Feions resulting in the formation of Ti-O-Fe bonds [27]. 3+ ions were doped into the TiO2 lattice. bonds [27]. Accordingly, it is further demonstrated that Fe 3+ 3+ bonds [27].itAccordingly, it is further demonstrated that Fe doped ions were into the TiO 2 lattice. Accordingly, is further demonstrated that Fe ions were intodoped the TiO lattice. 2
Figure 4. X-ray photoelectron spectroscopy (XPS) survey spectrum of Fe-TNTs (a) and high resolution XPS spectra of Fe 2p (b); Ti 2p (c) and O 1s (d) of Fe-TNTs.
2.3. UV-Vis Diffuse Reflectance Spectra Figure 5 shows the UV-vis diffuse reflectance spectra (DRS) of TNTs and Fe-TNTs. All the samples have strong absorption within the ultraviolet light region, corresponding to the band gap
Nanomaterials 2016, 6, 107
5 of 12
Figure 4. X-ray photoelectron spectroscopy (XPS) survey spectrum of Fe-TNTs (a) and high resolution XPS spectra of Fe 2p (b); Ti 2p (c) and O 1s (d) of Fe-TNTs.
2.3. UV-Vis Diffuse Nanomaterials 2016, 6, 107 Reflectance Spectra
5 of 12
Figure 5 shows the UV-vis diffuse reflectance spectra (DRS) of TNTs and Fe-TNTs. All the samples have strong absorption within the ultraviolet light region, corresponding to the band gap of of anatase (3.2 eV). Meanwhile, the samples also exhibited several absorption peaks in the range of anatase (3.2 eV). Meanwhile, the samples also exhibited several absorption peaks in the range of 400 400 nm–800 nm, which is attributed to the sub-band-gap states of the TNTs [28]. Compared with the nm–800 nm, which is attributed to the sub-band-gap states of the TNTs [28]. Compared with the TNTs, the the absorption of Fe-TNTs in the light region was increasingly improved with the increase TNTs, absorption of Fe-TNTs invisible the visible light region was increasingly improved with the of iron content. Notably, the red-shift of the absorption band for Fe-TNTs with the increase of the Fe increase of iron content. Notably, the red-shift of the absorption band for Fe-TNTs with the increase content not obvious for Ti50Fe. visible light absorption be attributed to a of thewas Fe content was except not obvious exceptThe for enhanced Ti50Fe. The enhanced visible lightcan absorption can be 3+ sub-band-gap between the 3d between electron the of Fe and theofTiO as wellband as the 2 conduction attributed totransition a sub-band-gap transition 3d electron Fe3+ and the TiO2band conduction 3+ (2T Ñ 2A ,2T 3+ d-dastransition of Fe ) or the charge transfer transition between interacting iron 2g 1g 2g 2A2g,2T1g) or the charge transfer transition between well as the d-d transition of 2gFe (2T 3+ 3+ 2+ 4+ 3+ 3+ 2+ 4+ ions (Fe + FeironÑ Fe (Fe+ Fe interacting ions + Fe) [29–31]. Fe + Fe ) [29–31].
Figure 5. UV-vis diffuse reflectance spectra of TNTs and Fe-TNTs prepared by anodizing Ti-Fe alloys Figure 5. UV-vis diffuse reflectance spectra of TNTs and Fe-TNTs prepared by anodizing Ti-Fe alloys with different Fe content. with different Fe content.
2.4. Photoelectrochemical and Photoelectrocatalytic Activity 2.4. Photoelectrochemical and Photoelectrocatalytic Activity The performance of Fe-TNTs in photoelectrochemical activity was tested by measuring the The performance photoelectrochemical was tested with by measuring photocurrent. Figure of 6a Fe-TNTs shows theinphotocurrent spectra of activity TNTs and Fe-TNTs different Fethe photocurrent. Figure 6a shows the photocurrent TNTs and Fe-TNTs differentdensities Fe content content under Xe lamp irradiation (i.e., UV andspectra visible of light irradiation). The with photocurrent under lamp irradiation (i.e., UVincreased and visible irradiation). The photocurrent of all the of allXethe samples except Ti50Fe withlight the increase of applied potential (vs. densities SCE), indicating samples except Ti50Fe increased with the increase of applied potential (vs. SCE), indicating the typical the typical photoelectrochemical property of the n-type semiconductor. The photoelectrochemical properties were further examined byn-type transient photocurrent measurement. Figure 6b presents the photoelectrochemical property of the semiconductor. The photoelectrochemical properties photocurrent density-time characteristics of the TNTs and Fe-TNTs in 0.1 M Na2SOthe 4 atphotocurrent an applied were further examined by transient photocurrent measurement. Figure 6b presents bias of 0.6 characteristics V (vs. SCE) with pulse of 50 s under UVin and It can density-time ofathe TNTs and Fe-TNTs 0.1visible M Na2light SO4 irradiation. at an applied biasbeofseen 0.6 V clearly that the photocurrent density increased sharply when the light was switched on, andthat thenthe (vs. SCE) with a pulse of 50 s under UV and visible light irradiation. It can be seen clearly decreased to a steady state for each sample. Pure TNTs a photocurrent density of 131.5 photocurrent density increased sharply when the light washave switched on, and then decreased to a −2. With the increase of the Fe content, the photoresponse was firstly enhanced mA· cm but then ´ 2 steady state for each sample. Pure TNTs have a photocurrent density of 131.5 mA¨ cm . With the inhibited. TheFe Ti08Fe sample the highest density 179.3 mA·cm−2, The whileTi08Fe the increase of the content, the exhibited photoresponse was photocurrent firstly enhanced butofthen inhibited. Ti50Fe sample had the lowest photocurrent density of 39.8 mA·cm−2 . Higher photocurrent implies sample exhibited the highest photocurrent density of 179.3 mA¨ cm´2 , while the Ti50Fe sample had much more enhanced charge separation and a longer lifetime of the photogenerated electron-hole the lowest photocurrent density of 39.8 mA¨ cm´2 . Higher photocurrent implies much more enhanced pairs which is closely related to the photoelectrocatalytic activity. When TNTs are irradiated, charge separation and a longer lifetime of the photogenerated electron-hole pairs which is closely electrons are excited from the valance band to the conduction band, leaving holes in the valance related to the photoelectrocatalytic activity. When TNTs are irradiated, electrons are excited from the band. Fe3+ dopant with a proper concentration can act as trapping sites, facilitating the separation of valance band to the conduction band, leaving holes in the valance band. Fe3+ dopant with a proper electron-hole pairs. However, excessive Fe3+ may act as the recombination centers of the concentration can act as trapping sites,which facilitating of of electron-hole pairs. However, photogenerated electrons and holes, resultsthe in separation the decrease photocurrent density [32]. 3+ excessive Fe may act as the recombination centers of the photogenerated electrons and holes, which 3+ Therefore, the doping level of Fe plays an important role in the photoelectrochemical behavior of 3+ plays an results in the decrease of photocurrent density [32]. Therefore, the doping level of Fe Fe-TNTs and the optimal doping concentration of Fe is 0.8 wt %. important role in the photoelectrochemical behavior of Fe-TNTs and the optimal doping concentration of Fe is 0.8 wt %.
transport property of TNTs and Fe-TNTs electrodes was further analyzed by the Nyquist plots of the EIS spectra. As shown in Figure 7, the circular arc radius of Fe-TNTs prepared by anodizing the Ti08Fe alloy was much smaller than that of TNTs under UV and visible light irradiation, suggesting that the introduction of Fe3+ ions was beneficial to the separation of the photo-induced carries (e−-h+) and charge transfer Nanomaterials 2016, 6, 107 at the solid-liquid interface. Therefore, a higher photoelectrocatalytic rate would 6 of 12 be expected by incorporating Fe3+ in TNTs. Nanomaterials 2016, 6, 107
6 of 12
As a widely used electrochemical method, EIS is a powerful and informative tool to study the electron transport processes at the solid-liquid interfaces, and a smaller size of the arc radius on the EIS Nyquist plot means a more rapid rate of electrode reaction [33,34]. Accordingly, the electron transport property of TNTs and Fe-TNTs electrodes was further analyzed by the Nyquist plots of the EIS spectra. As shown in Figure 7, the circular arc radius of Fe-TNTs prepared by anodizing the Ti08Fe alloy was much smaller than that of TNTs under UV and visible light irradiation, suggesting that the introduction of Fe3+ ions was beneficial to the separation of the photo-induced carries (e−-h+) and charge transfer at the solid-liquid interface. Therefore, a higher photoelectrocatalytic rate would be expected by incorporating Fe3+ in TNTs.
Figure 6. (a) and (b)J-tJ-tcurves curveswith withaabias bias of of 0.6 0.6 V irradiation. Figure 6. (a) J-VJ-V and (b) V for for all allsamples samplesunder underXeXelamp lamp irradiation.
As a widely used electrochemical method, EIS is a powerful and informative tool to study the electron transport processes at the solid-liquid interfaces, and a smaller size of the arc radius on the EIS Nyquist plot means a more rapid rate of electrode reaction [33,34]. Accordingly, the electron transport property of TNTs and Fe-TNTs electrodes was further analyzed by the Nyquist plots of the EIS spectra. As shown in Figure 7, the circular arc radius of Fe-TNTs prepared by anodizing the Ti08Fe alloy was much smaller than that of TNTs under UV and visible light irradiation, suggesting that the introduction of Fe3+ ions was beneficial to the separation of the photo-induced carries (e´ -h+ ) and charge transfer at the solid-liquid interface. Therefore, a higher photoelectrocatalytic rate would be Figure 6. (a) J-V andFe (b)3+J-tincurves with a bias of 0.6 V for all samples under Xe lamp irradiation. expected by incorporating TNTs.
Figure 7. Electrochemical impedance spectroscopy (EIS) Nyquist plots for TNTs and Fe-TNTs prepared by anodizing Ti08Fe alloy under Xe lamp irradiation.
In order to demonstrate the photo-induced application of Fe-TNTs, their photoelectrocatalytic activity was evaluated by degrading MB under UV and visible light irradiation and the applied bias
Figure 7. Electrochemical impedance spectroscopy Nyquist for and TNTs and Fe-TNTs Figure 7. Electrochemical impedance spectroscopy (EIS)(EIS) Nyquist plots plots for TNTs Fe-TNTs prepared prepared by anodizing under Xe lamp irradiation. by anodizing Ti08Fe alloyTi08Fe underalloy Xe lamp irradiation.
In order to demonstrate the photo-induced application of Fe-TNTs, their photoelectrocatalytic In order to demonstrate the photo-induced application of Fe-TNTs, their photoelectrocatalytic activity was evaluated by degrading MB under UV and visible light irradiation and the applied bias
activity was evaluated by degrading MB under UV and visible light irradiation and the applied
Nanomaterials 2016, 6, 107
7 of 12
Nanomaterials 2016, 6, 107
7 of 12
bias potential was 0.6 V. Figure 8a shows a series of UV-vis absorption spectra of MB solution potential was 0.6 V. Figure 8a shows a series of UV-vis absorption spectra of MB solution degraded degraded by Fe-TNTs prepared by anodizing Ti08Fe alloy. It was reported that demethylation could by Fe-TNTs prepared by anodizing Ti08Fe alloy. It was reported that demethylation could also also occur during the process of MB photodegradation, which could be characterized by the blue occur during the process of MB photodegradation, which could be characterized by the blue shift of shift the absorption at 663 nm in theabsorption UV-vis absorption spectrum [35]. 8a, as the theofabsorption peak atpeak 663 nm in the UV-vis spectrum [35]. In Figure 8a,InasFigure the irradiation irradiation time increased, the absorption peak at 663 nm dropped vertically with no blue shift time increased, the absorption peak at 663 nm dropped vertically with no blue shift observed, observed, indicating the effectively MB was effectively photodegraded. Figurethe 8bphotodegradation shows the photodegradation indicating the MB was photodegraded. Figure 8b shows kinetics of kinetics of the MB dye over TNTs and Fe-TNTs with different Fe content. The photocatalytic reactions the MB dye over TNTs and Fe-TNTs with different Fe content. The photocatalytic reactions obeyed obeyed pseudo-first-order reaction kinetics, be expressed by ln(C/C = ´ktkwith pseudo-first-order reaction kinetics, whichwhich couldcould be expressed by ln(C/C 0) = −kt beingk being the 0 ) with theapparent apparentfirst-order first-order reaction constant, while C are initial reaction concentrations reaction constant, while C0 C and C are the the initial andand reaction concentrations of 0 and of the the MB MBdye, dye,respectively. respectively. reaction constant for TNTs and Ti08Fe was calculated to×be TheThe reaction constant k for kTNTs and Ti08Fe was calculated to be 4.73 1 and 3 min´1 , respectively. −3 min −3 min−1, ´ and´7.12 × 10 It means that the photoelectrocatalytic activity of Ti08Fe 4.7310ˆ 10´3−1 min 7.12 ˆ 10 respectively. It means that the photoelectrocatalytic activity 3+ ions in TNTs. increased 51% more than thatthan of TNTs due to doped Fedoped of Ti08Fe increased 51% more that of TNTs due to Fe3+ ions in TNTs.
Figure 8. 8. (a)(a) UV-vis absorption (MB) solution solutionphotoelectrodegraded photoelectrodegraded Figure UV-vis absorptionspectra spectraofofmethylene methylene blue (MB) byby Ti08Fe and (b) MB degradation kinetic curves of TNTs and Fe-TNTs. Ti08Fe and (b) MB degradation kinetic curves of TNTs and Fe-TNTs.
basis of laser flash photolysis measurements [36,37], the photoelectrocatalytic reaction OnOn thethe basis of laser flash photolysis measurements [36,37], the photoelectrocatalytic reaction can can be described as follows: be described as follows: − + hvb++ + hν (1)(1) TiO2TiO ` 2hν Ñ ecbe-cb` hvb hvb++ Ñ hν hν ecb -ecb `− +hvb
(2)(2)
+ vb + Red Red+ hvbh ` Red Ñ Red e cb− + Ox Ox− ecb - ` Ox Ñ Ox Ti4+ + ecb− Ti3+ Ti4+ ` ecb - Ñ Ti3+ OH− + hvb+ OH• OH- ` hvb + Ñ OH‚ +
+
(3)(3) (4) (4) (5) (5) (6) (6)
Nanomaterials 2016, 6, 107
8 of 12
Nanomaterials 2016, 6, 107
8 of 12
Ti3+ ` OH‚ Ñ Ti4+ ` OH(7) 3+ • 4+ − Ti ‚+ OH Ti + +OH (7) OH ` Red Ñ Red (8) OH• + Red Red+ (8) Ti3+ ` Ox Ñ Ox (9) Ti3+ + Ox Ox− (9) Upon UV and visible light irradiation, the TiO2 could be excited to generate electron-hole pairs Upon(1)), UV and visible light irradiation,electron-hole the TiO2 could be could excitedeasily to generate electron-hole (Equation while the photogenerated pairs recombine (Equationpairs (2)). (Equation (1)), holes whileand the electrons photogenerated could (3)) easily The separated inducedelectron-hole an oxidationpairs (Equation andrecombine reduction(Equation (Equation(2)). (4)) The separated holes and oxidation (Equation (3)) and (Equationalso (4)) reaction, respectively. Atelectrons the sameinduced time, aan series of thermal reactions andreduction catalytic reactions reaction, respectively. Atwhere the same time,electrons a series or ofholes thermal reactions also happened, such as those trapping could produceand Ti3+catalytic or other reactions active groups 3+ 3+ happened, such as those where trapping electrons holes could produce Ti would or other active (Equations (5) and (6)), respectively. Then the Ti orand other active groups take partgroups in the 3+ and other active groups would take part in the (Equations (5) andreactions (6)), respectively. Then the Ti subsequent redox (Equations (7)–(9)). Most of these electrons and holes recombine within subsequent reactions (Equations Most of theseevent electrons holes recombine within the first fewredox tens of picoseconds after (7)–(9)). the photoexcitation [36], and suggesting a low quantum the first few tensTiO of 2picoseconds after the eventbehavior [36], suggesting a low quantum efficiency in pure . Figure 9 illustrates thephotoexcitation main charge-transfer in Fe-TNTs. After doping efficiency in pure . Figure 9 photogenerated illustrates the main in energy Fe-TNTs. After the TNTs with Fe3+TiO , Fe23+ can trap holescharge-transfer (Equation (10))behavior due to the level for 3+ 3+ 4+ 3+ 4+ doping TNTsthe with Fe , band Fe can photogenerated holes (Equation (10)) due to the Fe /Fe theabove valence edgetrap of anatase TiO2 . The trapped photogenerated holes in Feenergy can 4+/Fe3+ above the valence band edge of anatase TiO2. The trapped photogenerated holes in level forto Fethe migrate surface and absorb hydroxyl ions to produce hydroxyl radicals. At the same time, Fe3+ 2+ below Fe4+ also can migrate to the surfaceelectrons and absorb hydroxyl ions to produce hydroxyl At the same can trap photogenerated (Equation (12)) due to the energy levelradicals. for Fe3+ /Fe 3+ 3+ 2+ 2+ time, Fe can also trap photogenerated electrons (Equation (12)) due the energy level for /Fe the conduction band edge of anatase TiO Subsequently, Fe tocould be oxidized toFe Fe3+ by 2 [38–41]. 2+ below the conduction band edge ofOanatase 2 [38–41]. Subsequently, Fe could be oxidized to Fe3+ transferring electrons to absorbed surface of TiO 2 on theTiO 2 (Equation (13)). by transferring electrons to absorbed O2 on the surface of TiO2 (Equation (13)). Fe3+ ` h ++Ñ Fe4+ (10) Fe3+ + vb hvb Fe4+ (10) - − 3+ 3+ Fe4+Fe`4+ OH Ñ FeFe `+OH OH•‚ + OHpadsq (ads)
(11)
3+ +eecb- −Ñ Fe3+ Fe` Fe2+2+ cb Fe
(12)
3+3+ Fe2+Fe`2+ O ÑFeFe `+ O22−+ 2Opadsq 2(ads)
(13)
3+ could depress the doping of of Fe Fe3+ Accordingly, the doping could recombination of electron-hole pairs and prolong the lifetime of the carriers, which is beneficial for improving the quantum efficiency of the potential was applied, the the photogenerated electrons that photoelectrocatalytic reaction. reaction.When Whena bias a bias potential was applied, photogenerated electrons collected at theatphotoanode couldcould be transferred to thetoPt sheet through the external circuit. The that collected the photoanode be transferred the Pt sheet through the external circuit. separation of the photogenerated electron-hole pairs was efficiently promoted and thus The separation of the photogenerated electron-hole pairs was efficiently promoted and thus the efficiency was was improved improved remarkably. remarkably. photocatalytic efficiency
9. Schematic Figure 9. Schematic illustrating illustrating the the separation separation and and transport transport of of charge carriers in the process of photoelectrocatalytic degradation degradation over over Fe-TNTs. Fe-TNTs. photoelectrocatalytic
3. Experimental Section 3.1. Preparation of Fe-TNTs
Nanomaterials 2016, 6, 107
9 of 12
3. Experimental Section 3.1. Preparation of Fe-TNTs Pure Ti and Ti-Fe alloys with different Fe content (containing 0.5 wt %, 0.8 wt %, 1.0 wt %, and 5.0 wt %, and namely Ti05Fe, Ti08Fe, Ti10Fe and Ti50Fe) were prepared by using an arc-melting apparatus. TNTs and Fe-TNTs were prepared by electrochemical anodization of Ti substrate and Ti-Fe substrates, respectively. Prior to the anodization, the samples were cut into pieces (10 mm 10 mm 2 mm) and polished to a mirror finish, sequentially followed by ultrasonically cleaned in acetone, alcohol, and distilled water. The anodization was performed in 0.5 wt % HF aqueous solution for 20 min at 15 V in a two-electrode cell with samples as the working electrode and platinum foil as the counter electrode at room temperature. After anodization, samples were immediately rinsed with deionized water and dried in air. In order to convert the amorphous phase to the crystalline form, samples were annealed at 450 ˝ C in air for 30 min with a heating rate of 5 ˝ C¨ min´1 and a cooling rate of 2 ˝ C¨ min´1 . 3.2. Characterization of Fe-TNTs The morphologies of TNTs and Fe-TNTs were studied by using a field-emission scanning electron microscope (FE-SEM, Hitachi S4800, Hitachi, Tokyo, Japan) and a transmission electron microscopy (TEM, JEM 2100, JEOL, Tokyo, Japan). Additionally, a selected area energy dispersive spectrum (EDS) was performed on the Hitachi-S4800 SEM. The structure characterization of all samples was conducted by X-ray diffraction (XRD, Philips, Amsterdam, The Netherlands, PanalyticalX’pert, Cu Karadiation (λ = 1.5417 Å)), operated at 40 kV and 30 mA. The composition of samples was analyzed by X-ray photoelectron spectroscopy (XPS, VG, Physical Electrons Quantum 2000 Scanning EscaMicroprob, Al Kα radiation, Physical Electronics, Inc., Chanhassen, MN, USA). The binding energies were normalized to the signal for adventitious carbon at 284.8 eV. UV-vis diffuse reflectance spectra (DRS) of the samples were carried out by a UV-vis-NIR spectrophotometer (Varian Cary 5000, Agilent, Santa Clara, CA, USA). 3.3. Photoelectrochemical and Electrochemical Measurement All the measurements were carried out in a standard three-electrode configuration with a supporting electrolyte of 0.1 M Na2 SO4 aqueous solution using the samples, Pt wire and a saturated calomel electrode (SCE) as the working electrode, counter electrode and reference electrode, respectively. Photocurrent was recorded using the Ivium EC portable analyzer (Ivium Technologies BV, Eindhoven, The Netherlands). Additionally, a 300 W Xe lamp was employed as the light source to keep an illumination intensity of 100 mW¨ cm´2 . The EIS spectra were measured by applying an AC voltage of 10 mV amplitude within the frequency range of 105 –10´2 Hz. 3.4. Photoelectrocatalytic Measurement The photoelectrocatalytic activity of the samples was investigated by the degradation of a MB aqueous solution with an initial concentration of 10 mg¨ L´1 as model pollutant and 0.1 M Na2 SO4 as supporting electrolyte in a self-building quartz glass reactor with a water jacket to control the reaction temperature, as shown in Figure 10. A 300 W Xe lamp was employed as the light source. Prior to the photoelectrocatalytic degradation, the samples were soaked in 10 mg¨ L´1 MB aqueous solution for 30 min while bubbling with air to reach adsorption equilibrium. After irradiation started, the solution periodically taken from the reactor was analyzed with a UV-vis spectrophotometer (Unico UV-2102 PC, Unico Instrument Co., Ltd., Shanghai, China).
Nanomaterials 2016, 6, 107 Nanomaterials 2016, 6, 107
10 of 12 10 of 12
Figure 10. 10. Schematic Schematic diagram diagram of of aa photoelectrochemical photoelectrochemical cell cell for for photoelectrocatalytic photoelectrocatalytic degradation degradation of of Figure organic pollutant by capitalizing on Fe-TNTs (or TNTs) TNTs) as as working electrode, Pt as counter electrode, organic and and saturated saturated calomel calomel electrode electrode (SCE) (SCE) as as the the reference referenceelectrode, electrode,respectively. respectively.
4. Conclusions 4. Conclusions Highly ordered ordered Fe-TNTs Fe-TNTs were were successfully successfully fabricated fabricated by by direct direct anodization anodization of of Ti-Fe Ti-Fe alloys alloys with with Highly different Fe Fecontents. contents.InInallallcases, cases, ordered nanotube array layers homogeneously and different ordered nanotube array layers homogeneously grewgrew on Tion andTiTi-Fe 3+ Ti-Fe alloys, and no appreciable structure and morphology difference could be observed. The Fe3+ alloys, and no appreciable structure and morphology difference could be observed. The Fe doping doping at a relatively weak can obviously the photoelectrochemical TNTs. at a relatively weak level canlevel obviously enhanceenhance the photoelectrochemical activity activity of TNTs.ofOn the 3+ doping amount exceeded a certain level, the photoelectrochemical 3+ On the contrary, when the Fe contrary, when the Fe doping amount exceeded a certain level, the photoelectrochemical activity of activity of TNTs remarkably decreased. The Fe-TNTs byTi08Fe anodizing alloy exhibited TNTs remarkably decreased. The Fe-TNTs prepared byprepared anodizing alloyTi08Fe exhibited the highest the highest photocurrent and photoelectrocatalytic rate Fe-TNTs of MB. The Fe-TNTs photocurrent density and density photoelectrocatalytic degradation degradation rate of MB. The prepared by prepared by anodizing the Ti-Fe alloys may be a promising material not only for organic pollutant anodizing the Ti-Fe alloys may be a promising material not only for organic pollutant degradation but degradation but also for the other photocatalytic to abundant Ti and Fe in the earth. also for the other photocatalytic applications due applications to abundant due Ti and Fe in the earth. Acknowledgments: This work was supported by the National Natural Science Foundation of China (21321062 Acknowledgments: This work was supported by the National Natural Science Foundation of China (21321062 and 51402249) 51402249) and and NFFTBS NFFTBS (J1310024). (J1310024). and Author Contributions: Contributions: The The experimental experimental design design was was planned planned by by Lan Lan Sun Sun and and Changjian Changjian Lin. Lin. The The experimental experimental Author word word and and data data analysis analysis were wereperformed performedby byJiangdong JiangdongYu, Yu,Zhi ZhiWu, Wu,Cheng ChengGong Gongand andWang WangXiao. Xiao. Conflicts Conflictsof ofInterest: Interest: The The authors authors declare declareno noconflict conflictof ofinterest. interest.
References References 1. 1.
2. 2. 3. 3. 4.
4. 5. 5.
6.
Macdonald, Macdonald, T.J.; T.J.; Tune, Tune, D.D.; D.D.; Dewi, Dewi, M.R.; M.R.; Gibson, Gibson, C.T.; C.T.; Shapter, Shapter, J.G.; J.G.; Nann, Nann, T. T. A ATiO TiO22 Nanofiber–Carbon Nanofiber–Carbon Nanotube–Composite Photoanode for Improved Efficiency in Dye–Sensitized Solar Cells. Nanotube–Composite Photoanode for Improved Efficiency in Dye–Sensitized Solar Cells. ChemSusChem ChemSusChem 2015, 2015, 8, 8, 3396–3400. 3396–3400. [CrossRef] [PubMed] Macdonald, Elmas, S.; Mange, Y.J.; Skinner, W.M.; W.M.; Xu, H.;Xu, Nann, NiO Nanofibers as a Candidate Macdonald,T.J.; T.J.;Xu, Xu,J.; J.; Elmas, S.; Mange, Y.J.; Skinner, H.;T.Nann, T. NiO Nanofibers as a for a Nanophotocathode. Nanomaterials 2014, 4, 256–266. [CrossRef] Candidate for a Nanophotocathode. Nanomaterials 2014, 4, 256–266. Tran, Stockmann, R.; R.; Nann, Nann, T.; T.; Offenhäusser, Offenhäusser, A.; A.; Thierry, Thierry, B. B. Tran, D.P.; D.P.; Macdonald, Macdonald, T.J.; T.J.; Wolfrum, Wolfrum, B.; B.; Stockmann, Photoresponsive properties of ultrathin silicon nanowires. Appl. Phys. Lett. 2014, 105. [CrossRef] Photoresponsive properties of ultrathin silicon nanowires. Appl. Phys. Lett. 2014, 105, Tune, D.D.; Flavel, B.S.; Krupke, R.; Shapter, J.G. Carbon Nanotube-Silicon Solar Cells. Adv. Energy Mater. doi:10.1063/1.4904089. 2012, 1043–1055. Tune,2,D.D.; Flavel, [CrossRef] B.S.; Krupke, R.; Shapter, J.G. Carbon Nanotube‐Silicon Solar Cells. Adv. Energy Mater. Macdonald, T.J.; Tune, 2012, 2, 1043–1055. D.D.; Dewi, M.R.; Bear, J.C.; McNaughter, P.D.; Mayes, A.G.; Skinner, W.M.; Parkin, I.P.; Shapter, J.G.; T.J.; Nann, T. SWCNT photocathodes sensitised with InP/ZnS core–shell Macdonald, Tune, D.D.; Dewi, M.R.; Bear, J.C.; McNaughter, P.D.; Mayes, nanocrystals. A.G.; Skinner,J. Mater. W.M.; Chem. C 2016, 4, 3379–3384. [CrossRef] Parkin, I.P.; Shapter, J.G.; Nann, T. SWCNT photocathodes sensitised with InP/ZnS core–shell
nanocrystals. J. Mater. Chem. C 2016, 4, 3379–3384. Gong, D.; Grimes, C.A.; Varghese, O.K.; Hu, W.; Singh, R.; Chen, Z.; Dickey, E.C. Titanium oxide
Nanomaterials 2016, 6, 107
6. 7.
8.
9. 10. 11.
12.
13.
14. 15.
16. 17.
18.
19.
20.
21.
22. 23.
24. 25.
11 of 12
Gong, D.; Grimes, C.A.; Varghese, O.K.; Hu, W.; Singh, R.; Chen, Z.; Dickey, E.C. Titanium oxide nanotube arrays prepared by anodic oxidation. J. Mater. Res. 2001, 16, 3331–3334. [CrossRef] Xie, K.; Sun, L.; Wang, C.; Lai, Y.; Wang, M.; Chen, H.; Lin, C. Photoelectrocatalytic properties of Ag nanoparticles loaded TiO2 nanotube arrays prepared by pulse current deposition. Electrochim. Acta 2010, 55, 7211–7218. [CrossRef] Jang, J.S.; Choi, S.H.; Kim, D.H.; Jang, J.W.; Lee, K.S.; Lee, J.S. Enhanced photocatalytic hydrogen production from water´methanol solution by nickel intercalated into titanate nanotube. J. Phys. Chem. C 2009, 113, 8990–8996. [CrossRef] Yang, Y.; Lee, K.; Kado, Y.; Schmuki, P. Nb-doping of TiO2 /SrTiO3 nanotubular heterostructures for enhanced photocatalytic water splitting. Electrochem. Commun. 2012, 17, 56–59. [CrossRef] Wu, H.; Zhang, Z. High photoelectrochemical water splitting performance on nitrogen doped double-wall TiO2 nanotube array electrodes. Int. J. Hydrogen Energy 2011, 36, 13481–13487. [CrossRef] Murdoch, M.; Waterhouse, G.; Nadeem, M.; Metson, J.; Keane, M.; Howe, R.; Llorca, J.; Idriss, H. The effect of gold loading and particle size on photocatalytic hydrogen production from ethanol over Au/TiO2 nanoparticles. Nat. Chem. 2011, 3, 489–492. [CrossRef] [PubMed] Wu, Z.; Su, Y.; Yu, J.; Xiao, W.; Sun, L.; Lin, C. Enhanced photoelectrocatalytic hydrogen production activity of SrTiO3 –TiO2 hetero-nanoparticle modified TiO2 nanotube arrays. Int. J. Hydrogen Energy 2015, 40, 9704–9712. [CrossRef] Yu, J.; Gong, C.; Wu, Z.; Wu, Y.; Xiao, W.; Su, Y.; Sun, L.; Lin, C. Efficient visible light-induced photoelectrocatalytic hydrogen production using CdS sensitized TiO2 nanorods on TiO2 nanotube arrays. J. Mater. Chem. A 2015, 3, 22218–22226. [CrossRef] Mor, G.K.; Shankar, K.; Paulose, M.; Varghese, O.K.; Grimes, C.A. Use of highly-ordered TiO2 nanotube arrays in dye-sensitized solar cells. Nano Lett. 2006, 6, 215–218. [CrossRef] [PubMed] Mor, G.K.; Prakasam, H.E.; Varghese, O.K.; Shankar, K.; Grimes, C.A. Vertically oriented Ti-Fe-O nanotube array films: Toward a useful material architecture for solar spectrum water photoelectrolysis. Nano Lett. 2007, 7, 2356–2364. [CrossRef] [PubMed] Su, Y.; Wu, Z.; Wu, Y.; Yu, J.; Sun, L.; Lin, C. Acid Orange II degradation through a heterogeneous Fenton-like reaction using Fe–TiO2 nanotube arrays as a photocatalyst. J. Mater. Chem. A 2015, 3, 8537–8544. [CrossRef] Wang, C.-Y.; Böttcher, C.; Bahnemann, D.W.; Dohrmann, J.K. A comparative study of nanometer sized Fe (III)-doped TiO2 photocatalysts: Synthesis, characterization and activity. J. Mater. Chem. 2003, 13, 2322–2329. [CrossRef] Nair, P.B.; Justinvictor, V.; Daniel, G.P.; Joy, K.; Ramakrishnan, V.; Kumar, D.D.; Thomas, P. Structural, optical, photoluminescence and photocatalytic investigations on Fe doped TiO2 thin films. Thin Solid Films 2014, 550, 121–127. [CrossRef] Sun, L.; Li, J.; Wang, C.; Li, S.; Chen, H.; Lin, C. An electrochemical strategy of doping Fe3+ into TiO2 nanotube array films for enhancement in photocatalytic activity. Sol. Energy Mater. Sol. Cells 2009, 93, 1875–1880. [CrossRef] Wu, Q.; Ouyang, J.; Xie, K.; Sun, L.; Wang, M.; Lin, C. Ultrasound-assisted synthesis and visible-light-driven photocatalytic activity of Fe-incorporated TiO2 nanotube array photocatalysts. J. Hazard. Mater. 2012, 199, 410–417. [CrossRef] [PubMed] Allam, N.K.; Alamgir, F.; El-Sayed, M.A. Enhanced photoassisted water electrolysis using vertically oriented anodically fabricated Ti–Nb–Zr–O mixed oxide nanotube arrays. ACS Nano 2010, 4, 5819–5826. [CrossRef] [PubMed] Ma, Q.; Liu, S.; Weng, L.; Liu, Y.; Liu, B. Growth, structure and photocatalytic properties of hierarchical Cu–Ti–O nanotube arrays by anodization. J. Alloys Compd. 2010, 501, 333–338. [CrossRef] Nah, Y.-C.; Ghicov, A.; Kim, D.; Berger, S.; Schmuki, P. TiO2 –WO3 composite nanotubes by alloy anodization: Growth and enhanced electrochromic properties. J. Am. Chem. Soc. 2008, 130, 16154–16155. [CrossRef] [PubMed] Wang, X.; Zhao, J.; Kang, Y.; Li, L.; Xu, X. Photoelectrochemical properties of Fe-doped TiO2 nanotube arrays fabricated by anodization. J. Appl. Electrochem. 2014, 44, 1–4. [CrossRef] Tu, Y.-F.; Huang, S.-Y.; Sang, J.-P.; Zou, X.-W. Preparation of Fe-doped TiO2 nanotube arrays and their photocatalytic activities under visible light. Mater. Res. Bull. 2010, 45, 224–229. [CrossRef]
Nanomaterials 2016, 6, 107
26.
27.
28. 29. 30.
31. 32. 33.
34.
35. 36. 37. 38. 39. 40.
41.
12 of 12
Zhu, J.; Chen, F.; Zhang, J.; Chen, H.; Anpo, M. Fe3+ -TiO2 photocatalysts prepared by combining sol–gel method with hydrothermal treatment and their characterization. J. Photochem. Photobiol. A 2006, 180, 196–204. [CrossRef] Tong, T.; Zhang, J.; Tian, B.; Chen, F.; He, D. Preparation of Fe3+ -doped TiO2 catalysts by controlled hydrolysis of titanium alkoxide and study on their photocatalytic activity for methyl orange degradation. J. Hazard. Mater. 2008, 155, 572–579. [CrossRef] [PubMed] Lai, Y.; Sun, L.; Chen, Y.; Zhuang, H.; Lin, C.; Chin, J.W. Effects of the structure of TiO2 nanotube array on Ti substrate on its photocatalytic activity. J. Electrochem. Soc. 2006, 153, D123–D127. [CrossRef] Xu, Z.; Yu, J. Visible-light-induced photoelectrochemical behaviors of Fe-modified TiO2 nanotube arrays. Nanoscale 2011, 3, 3138–3144. [CrossRef] [PubMed] Yu, J.; Xiang, Q.; Zhou, M. Preparation, characterization and visible-light-driven photocatalytic activity of Fe-doped titania nanorods and first-principles study for electronic structures. Appl. Catal. B 2009, 90, 595–602. [CrossRef] Yang, Y.; Tian, C. Effects of calcining temperature on photocatalytic activity of Fe-doped sulfated titania. Photochem. Photobiol. 2012, 88, 816–823. [CrossRef] [PubMed] Litter, M.; Navio, J.A. Photocatalytic properties of iron-doped titania semiconductors. J. Photochem Photobiol. A 1996, 98, 171–181. [CrossRef] Liu, H.; Cheng, S.; Wu, M.; Wu, H.; Zhang, J.; Li, W.; Cao, C. Photoelectrocatalytic degradation of sulfosalicylic acid and its electrochemical impedance spectroscopy investigation. J. Phys. Chem. A 2000, 104, 7016–7020. [CrossRef] Liu, H.; Li, X.; Leng, Y.; Li, W. An alternative approach to ascertain the rate-determining steps of TiO2 photoelectrocatalytic reaction by electrochemical impedance spectroscopy. J. Phys. Chem. B 2003, 107, 8988–8996. [CrossRef] Hoffmann, M.R.; Martin, S.T.; Choi, W.; Bahnemann, D.W. Environmental applications of semiconductor photocatalysis. Chem. Rev. 1995, 95, 69–96. [CrossRef] Tomkiewicz, M. Scaling properties in photocatalysis. Catal. Today 2000, 58, 115–123. [CrossRef] Harifi, T.; Montazer, M. Fe3+ : Ag/TiO2 nanocomposite: Synthesis, characterization and photocatalytic activity under UV and visible light irradiation. Appl. Catal. A 2014, 473, 104–115. [CrossRef] Mizushima, K.; Tanaka, M.; Asai, A.; Iida, S.; Goodenough, J.B. Impurity levels of iron-group ions in TiO2 (II). J. Phys. Chem. Solids 1979, 40, 1129–1140. [CrossRef] Mizushima, K.; Tanaka, M.; Iida, S. Energy levels of iron group impurities in TiO2 . J. Phys. Soc. Jap. 1972, 32, 1519–1524. [CrossRef] Yogi, C.; Kojima, K.; Wada, N.; Tokumoto, H.; Takai, T.; Mizoguchi, T.; Tamiaki, H. Photocatalytic degradation of methylene blue by TiO2 film and Au particles-TiO2 composite film. Thin Solid Films 2008, 516, 5881–5884. [CrossRef] Mo, S.-D.; Lin, L.; Lin, D. Electron states of iron group impurities in doped rutile (TiO2 ). J. Phys. Chem. Solids 1994, 55, 1309–1313. © 2016 by the authors; licensee MDPI, Basel, Switzerland. This article is an open access article distributed under the terms and conditions of the Creative Commons Attribution (CC-BY) license (http://creativecommons.org/licenses/by/4.0/).