AERA Fidelity Paper
April 3, 2005
Fidelity of Implementation in Three Sequential Curricular Units Nancy Butler Songer and Amelia Wenk Gotwals School of Education The University of Michigan
[email protected] Introduction: Recently many influential publications including National Science Education Standards (National Research Council, 1995) and Benchmarks for Science Literacy (American Association for the Advancement of Science, 1993) have strongly endorsed inquiry-based science teaching and learning. These publications have laid out guidelines to successfully implement the changes that they suggest will improve students’ understandings of science. In keeping with these suggestions, several research groups have created, piloted, and implemented curricular programs in schools in the hopes of increasing students’ science content understanding as well as their complex reasoning skills (e.g. BioKIDS: Kids Inquiry of Diverse Species and KGS: Kids as Global Scientists). However, even when these programs are adopted by schools systems the implementation of the curricula looks very different from classroom to classroom. Accounting for and measuring these differences is very important when examining student learning. In this paper, we will define how we measure the fidelity of implementation of our curricular units in Detroit Public Schools and how differences of fidelity to the curriculum influence student learning. Theoretical Framework: Importance of Inquiry Before examining fidelity to inquiry-based curricular programs, it is important understand the phenomenon of inquiry itself and why it is important in science education. Scientific inquiry refers to the diverse ways in which scientists study the natural world and propose explanations based on the evidence derived from their work. Inquiry also refers to the activities of students in which they develop knowledge and understanding of how scientists study the natural world. (National Research Council, 1995) The process of inquiry is modeled on the scientist's method of discovery. This view represents science as a constructed set of theories and ideas based on the physical world, rather than as a collection of irrefutable, disconnected facts. It focuses on asking questions, exploring these questions, considering alternative explanations, and weighing evidence. Part of why inquiry is important is because it can provide students with “real” science experiences, e.g. experiences with many important features of science as practiced by professional scientists (Brown, Collins, & Duguid, 1989). Inquiry learning often emphasizes experiences with fundamental scientific phenomena through direct experience with materials; by consulting books, resources, and experts; and debate among participants (National Research Council, 2000). Inquirybased learning goals emphasize high expectations including understanding beyond simple recall of information. Students are expected to reason with scientific knowledge through
1
AERA Fidelity Paper
April 3, 2005
activities such as formulating explanations, creating hypotheses, making predictions, and interpreting data. Various inquiry methods have been shown to encourage the inclusion of all students in science classrooms and to promote greater student achievement gains in both scientific content and inquiry knowledge (Krajcik et al., 1998; Mistler-Jackson & Songer, 2000; Songer, Lee, & McDonald, 2003; White & Frederiksen, 1998). In inquirybased science programs, students do not just memorize scientific facts; they are exposed to the whats, hows, and whys of science. For these reasons and others, the National Science Education Standards state that, “Inquiry into authentic questions generated from student experiences is the central strategy for teaching science.” (National Research Council, p. 31) Fidelity of Implementation All curricular units are created with theories of learning, teaching and assessing in mind, and our inquiry-based curricula are no exception. However, even when given the same exact curriculum, the way in which teachers enact the curriculum will be vastly different depending on many criteria including among others the resources they have and their personal teaching style. Examining the extent to which teachers enact the curriculum in line with how the curriculum was meant to be enacted is important for both program evaluation as well as evaluation of student learning. “Fidelity may be defined as the extent to which delivery of an intervention adheres to the protocol or program model originally developed” (Mowbray, Holter, Teague, & Bybee, 2003). In order to examine fidelity of implementation, there are three main categories to examine in discussing fidelity of implementation: structure (adherence to the unit, exposure, and program differentiation), process (quality of delivery), and self-perceived effects by participants (Lynch, 2005). Structure refers to the underlying theories used to create the unit. In order to measure structure we can examine three main criteria. First, we can examine a teacher’s adherence to the unit – whether the unit was delivered consistently with how it was designed or written. Secondly, we can examine exposure to the unit – the number of lessons implemented, the length of time given to each lesson, and types of skills emphasized in each lesson. Finally, in measuring structure, we can examine program differentiation – the extent to which the innovative program differs from the traditional or standard program (Lynch, 2005). For our curricula, we focus on the measurement of structure in our definition of fidelity. In particular, we document how many lessons and student worksheets associated with these lessons teachers enact in their classrooms. These lessons are inquiry-based, often involve the use of innovative technology, and have students working with data that they collect. These lessons are very different from the standard curriculum that other teachers in this district use, which tend to focus on reading the textbook and having students do worksheets that involve filling in the blanks and/or doing activities like crossword puzzles or word searches. While we do not directly measure teachers’ adherence to the unit, the structure of the lessons and associated worksheets lends themselves to a certain type of learning that is very different from the traditional curriculum and thus we believe that we can use worksheet implementation as a good measure of fidelity to the curriculum. Process refers to the quality of delivery of the program, compared with the intended delivery. In order to measure process, the method in which the teacher
2
AERA Fidelity Paper
April 3, 2005
implements the unit must be observed and studied. For our curricular units, graduate students visit classrooms on a weekly basis and work with teachers in implementing the curricula in the way in which they were intended. Again, we do not have a direct measure of “process;” however, we believe that the weekly classroom support that the teachers get along with the regular professional development associated with the programs leads the teachers to implementing the curriculum in a relatively faithful way. Finally, fidelity can be measured by examining the self-perceived effects by the participants/students. This shows the extent to which students are given a sense of agency in their own learning and the extent to which the teacher does or does not assume a transmission model of teaching (Lynch, 2005). This can be measured though looking at the extent of student engagement. The way in which our worksheets and lessons are structured leads students to take a large part in their own learning. In the biodiversity curriculum, students are responsible for gathering data about a specific part of their schoolyard. If they do not do a good job in collecting their data, then the whole class will have a hard time answering one of the driving questions, “What area of my schoolyard has the most biodiversity?” If teachers are implementing the lessons using the associated worksheets, then students will be given the opportunity to collect data, use data as evidence in creating explanations of phenomena, and discussing and sharing these explanations with their teacher and peers. Thus, we believe that worksheet implementation is a good measure of fidelity to the curricular units that we are working with. While our measure of fidelity does not directly measure all three characteristics specified, it does give us a good working definition with which to examine our data and look at how fidelity of implementation influences student learning. “The appropriate use of fidelity criteria can assist program evaluation designs, with or without RCTs (Randomized Clinical Trials), to contribute to establishing the evidence-base for any program” (Mowbray et al., 2003). Study Design: The Three Curricular Programs BioKIDS: Kids’ Inquiry of Diverse Species (Songer, 2000) is an IERI-funded project whose goals include the study of the longitudinal development of students’ content and inquiry knowledge acquisition as they participate in several inquiry-based curricular units. In particular, we have developed a series of three sixth grade inquirybased science curricular units. Each of the curricular units is designed to be eight weeks long and comes with a teacher guide, student worksheets, and classroom support throughout the year. In addition to classroom support, teachers are given the opportunity to attend a weeklong summer workshop as well as monthly professional development training sessions. The initial eight-week curriculum focuses on biodiversity content, the second unit focuses on weather content and the third focuses on simple machines. In each of these curricula, particular inquiry thinking skills are fostered through carefully scaffolded activity sequences (Huber, Songer, & Lee, 2003). In particular, the curricula focus on scaffolding students’ development of scientific explanations using evidence. Lee (2002) found that although scaffolds are meant to fade, fifth grade students who had constant scaffolding of explanation building performed better than their peers who had
3
AERA Fidelity Paper
April 3, 2005
fading scaffolds – suggesting that at this age, inquiry skills are still difficult enough that students need to have support in this aspect of inquiry. For many students, the biodiversity curriculum will be their first foray into inquiry-based science learning. Therefore, we maintained constant scaffolds throughout the year. In addition, as we expect that the development of complex reasoning takes time, we worked with assessment specialists on the PADI (Principled Assessment Designs for Inquiry) team to create an assessment system that could assess beginning, intermediate, and complex levels of reasoning tasks (Songer & Wenk, 2003). We wanted to be able to see students’ progression through both a single curricular unit as well as across curricular units and determine their level of reasoning ability at each stage. The specifics of this system are summarized below and discussed at length in our other papers (i.e. Gotwals & Songer, 2004; Songer & Wenk, 2003). Content-Inquiry Matrix As inquiry in the classroom can take various forms and can occur at many different levels (Songer et al., 2003), it is important to develop tasks specifically oriented to different levels of complexity to accurately evaluate students’ developing abilities over time. In our project, we conceptualize the difficulty of science inquiry assessment tasks as having two dimensions: the difficulty of the science content and the difficulty of the science inquiry. To address both of these aspects of task difficulty, we created a matrix that lays out three possible levels for each dimension (see table 1). First we classified science content knowledge into: simple – meaning that most content is provided by the task; moderate – meaning that students need a solid understanding of the underlying scientific concepts; and complex – meaning that students need not only an understanding of concepts, but also be able to link different concepts together. Secondly, we focused on three separate inquiry skills that are fostered in all three curricular units: formulating scientific explanations, interpreting data, and making hypotheses and predictions. Once we examined these inquiry skills, we separated inquiry into three levels: step1, step 2, and step 3. While the content aspect of the matrix can remain the same or very similar for all aspects of inquiry, the levels of inquiry will vary due to the inherently different nature of the three aspects of inquiry being targeted. For the skill of formulating scientific explanations, we borrowed from our curricular units and created degrees of inquiry tasks based on the amount of support or scaffolding the task provides for explanation formation. Step 1 tasks provide evidence and a claim, and students simply need to match the appropriate evidence to the claim (or vise versa). While this only measures a low level of inquiry, specifically the ability to match relevant evidence to a claim (or a claim to given evidence), this is still an important step in students’ development process. A step 2 task involves a scaffold that provides students with a choice of claims, and then prompts them to provide evidence to back up their choice. This involves more inquiry ability than the step 1 task of matching, but there is still support for students guiding them in the important aspects of a scientific explanation. Finally, a step 3 task is the most challenging in that it does not provide support in either the creation of a claim or in use of evidence. Students able to do step 3 tasks demonstrate the knowledge of what is involved in a scientific explanation as well as the ability and skill to construct such an explanation. We have also created similar matrices for two other inquiry skills: interpreting data and making hypotheses and predictions.
4
AERA Fidelity Paper
April 3, 2005
Table 1 - Content-Inquiry Matrix for “Formulating Scientific Explanations Using Evidence”
Degree of Unsupported Complex Reasoning
Amount of Content Required for Task
Step 1- Students match relevant evidence to a given claim
Step 2- Students choose a relevant claim and construct a simple explanation based on given evidence (construction is scaffolded) Step 3-Students construct a claim and explanation that justifies claim using relevant evidence (unscaffolded)
Simple – minimal or no extra content knowledge is required and evidence does not require interpretation Students are given all of the evidence and the claim. Minimal or no extra content knowledge is required
Students are given evidence, to choose the claim and construct the explanation, minimal or no additional knowledge or interpretation of evidence is required Students must construct a claim and explanation however, they need to bring minimal or no additional content knowledge to the task
Moderate - students must either interpret evidence or apply additional (not given) content knowledge
Complex – students must apply extra content knowledge and interpret evidence
Students are given all of the evidence and the claim. However, to choose the match the evidence to the claim, they must either interpret the evidence or apply extra content knowledge Students are given evidence, but to choose a claim and construct the explanation, they must interpret the evidence and/or apply additional content knowledge
Students are given evidence and a claim, however, in order to match the evidence to the claim, they must interpret the data to apply additional content knowledge Students are given evidence, but to choose a claim and construct the explanation, they must interpret the evidence and apply additional content knowledge.
Students must construct a claim and explanation that requires either interpretation or content knowledge
Students must construct a claim and explanation that requires the students to interpret evidence and apply additional content knowledge.
Examples of step 1 simple, step 2 moderate, and step 3 complex tasks are shown below in table 2. The tasks follow a clear progression of scaffolding of the inquiry skill of formulating scientific explanations using evidence. The step 1 simple task simply requires students to match the given evidence to a claim statement in addition, students are not required to bring any content knowledge to the question, all of this information is provided. The step 2 moderate task guides students in choosing a claim and then prompts them to provide evidence to back up their claim. Table 2: BioKIDS Questions Mapped to the Level of the “Formulating Scientific Explanations Using Evidence” Design Pattern Question A biologist studying birds made the following observations about the birds. She concluded the birds would not compete for food. Bird
Food
Feeding
Step and Complexity Level Step 1, Simple
Where they feed
5
AERA Fidelity Paper
Bird 1 Bird 2 Bird 3
berries berries berries
April 3, 2005
dawn/dusk dawn/dusk dawn/dusk
trees, middle trees, lower trees, upper
What evidence supports her conclusion? a. Insects are plentiful b. They feed at different times c. They feed in different parts of the trees d. They lay eggs at different times Shan and Niki collected four animals from their schoolyard. They divided the animals into Group A and Group B based on their appearance as shown below: Group A: Group B:
They want to place this fly Where should this fly be placed?
Step 2, Moderate
in either Group A or Group B.
A fly should be in Group A /Group B Circle one Name two physical characteristics that you used when you decided to place the fly in this group: (a) (b) Step 3, Complex
10. …If all of the small fish in the pond system died one year from a disease that killed only the small fish, what would happen to the algae in the pond? Explain why you think so. 11. What would happen to the large fish? Explain why you think so. (From NAEP assessment)
6
AERA Fidelity Paper
April 3, 2005
Population As a part of the LeTUS group (Learning Technologies in Urban Schools), we work closely with the Detroit Public School system in helping to implement reform-based science curricula in the middle schools. Detroit Public Schools is a large district with a high percentage of ethnic minorities (~98%) and a high percentage of students from lowincome households (over 70% of district students qualify for free or reduced lunch). As a large urban district, Detroit contains a range of school culture and populations that represent various challenges to curricular reform (Songer, Lee, & Kam, 2002). In Fall 2003, about 2,000 sixth grade students from sixteen Detroit public schools participated in the BioKIDS curricula. Twenty-three teachers with a range of experience and expertise taught the students. Students took both a pre and posttest for each curricula made up of questions ranging in complexity of content as well as inquiry. In addition, graduate student researchers kept track of how much of the curriculum teachers completed. Methods: In each curricular unit, there was a range in the amount of student worksheets teachers implemented. There were a number of teachers in each curricular unit who implemented almost the entire curriculum, a few who implemented about half of the of the given curriculum and other teachers who implemented a smaller portion of the different curricula. In order to see the influence of amount of curricular implementation on student learning, we first examined the distribution of teachers along this measure of fidelity of implementation. Not surprisingly, the distribution was highly negatively skewed in each of the curricula, with most teachers implementing a large number of worksheets. We attempted to transform the variable, however, no transformations yielded a normal distribution. Therefore we could not use percent implementation as a continuous variable in any analysis, so we created two groups of teachers for each curricular unit – a high fidelity group (high amount of implementation of student worksheets) and a low fidelity group (low amount of implementation of student worksheets). Then we examined the differences in the percent of implementation of curricular worksheets to ensure that there were significant differences between the two groups in both percent implementation as well as in posttest scores. Table 3, below, shows the demographics of each group of students. It is clear to see that the two populations in each of the three curricula are very similar, with the greatest discrepancies being that the high fidelity group tends to have more students who speak a language other than English at home. Table 3: Descriptive Characteristics of Students in High and Low Fidelity of Implementation Groups
Biodiversity high Fidelity
Female
Minority
52%
94%
Language other than English spoken at home 21%
7
AERA Fidelity Paper
Biodiversity low fidelity Weather high fidelity Weather low fidelity Simple Machines high fidelity Simple Machines low fidelity
April 3, 2005
50%
94%
17%
50%
94%
42%
51%
94%
17%
46%
96%
25%
52%
94%
19%
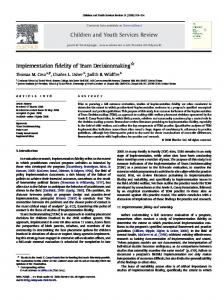
Then, to examine the effects of implementation on student learning, we conducted several multiple regressions. Multiple regression analysis is a method for studying the relation between a dependent variable (in our case posttest scores) and two or more independent variables (Shavelson, 1996). Multiple regression allows us to predict the dependent variable from a set of predictor variables or show how certain criteria influence the dependent variable. In our case, we are interested in seeing whether fidelity of implementation influences students’ scores on the posttest, holding the pretest as constant (covariate). We conducted four series of regressions. Each series contained three regressions, using the three different curricular unit posttest measures as dependent variables and pretest scores and fidelity (high or low) as predictors. In the first series, we used the whole posttest score (standardized) as the dependent measure and the whole pretest score (standardized) as one of the predictors. In the following three series, we split the test items up by their complexity levels (step 1, step 2, and step 3), and ran regressions using the complexity posttest measure (standardized) as the dependent variable and used the complexity level pretest measure (standardized) as one of the predictors. In all regressions we also used the dummy fidelity variables as predictors. Results: There were large differences in the averages of fidelity of implementation between our high and low fidelity groups in all curricula. Figure 1 shows the percentages of implementation for each group. It is clear that there is a large difference in the amount of the curriculum that was implemented in the different classrooms.
8
AERA Fidelity Paper
April 3, 2005
Figure 1: Fidelity by Curricular Unit 100 90 80
% Implementation
70 60 High Fidelity Low Fidelity
50 40 30 20 10 0 BioKIDS
KGS
Big Things
Figure 2 illustrates that high and low fidelity students started out at the same level, however, the high fidelity students scored higher on the posttest. In addition, it is clear that while both groups make significant gains, the high fidelity group makes higher gains. Figure 2: Comparison of High and Low Fidelity Students on Biodiversity pre/posttest 60
Number Correct
50 40 High Fidelity Low Fidelity
30 20 10 0 Pretest
Posttest
Figure 3 separates out how students did by complexity levels. Again, all students make significant gains from pre to posttest, but that students in high fidelity classrooms make
9
AERA Fidelity Paper
April 3, 2005
the highest gains. In addition, these gains are more pronounced at the step 3 level where unscaffolded complex reasoning is involved. Figure 3: Comparison of High and Low Fidelity Students by Complexity Level 90 80
% Correct
70 60 50
High Fidelity
40
Low Fidelity
30 20 10 0 Step 1 Simple (pretest)
Step 1 Simple (posttest)
Step 2 Moderate (pretest)
Step 2 moderate (posttest)
Step 3 Complex (pretest)
Step 3 Complex (posttest)
Regression Analyses: Table 4 shows the first series of regressions using each curricular full test as the dependent variable. Regression 1 in this series examines the effect of implementation on learning in the biodiversity curriculum. Not surprisingly, the pretest is the greatest predictor of posttest score (p