In today's global and competitive market, different companies (e.g. suppliers, .... If a state of a dynamic system only depends on its previous state, its state sequence is called to ... filters) to update beliefs about unknown quantities as data becomes ..... In addition, each facility's shop floor is comprised of five production cells.
Proceedings of the 2009 Winter Simulation Conference M. D. Rossetti, R. R. Hill, B. Johansson, A. Dunkin and R. G. Ingalls, eds.
SEQUENTIAL MONTE CARLO-BASED FIDELITY SELECTION IN DYNAMIC-DATA-DRIVEN ADAPTIVE MULTI-SCALE SIMULATIONS (DDDAMS) Nurcin Celik Young-Jun Son Systems and Industrial Engineering The University of Arizona Tucson, AZ, 85719, USA ABSTRACT In DDDAMS paradigm, the fidelity of a complex simulation model adapts to available computational resources by incorporating dynamic data into the executing model, which then steers the measurement process for selective data update. Real-time inferencing for a large-scale system may involve hundreds of sensors for various quantity of interests, which makes it a challenging task considering limited resources. In this work, a Sequential Monte Carlo method (sequential Bayesian inference technique) is proposed and embedded into the simulation to enable its ideal fidelity selection given massive datasets. As dynamic information becomes available, the proposed method makes efficient inferences to determine the sources of abnormality in the system. A parallelization frame is also discussed to further reduce the number of data accesses while maintaining the accuracy of parameter estimates. A prototype DDDAMS involving the proposed algorithm has been successfully implemented for preventive maintenance and part routing scheduling in a semiconductor supply chain. 1
INTRODUCTION
In today’s global and competitive market, different companies (e.g. suppliers, manufacturers, retailers, distributors, and transporters) form a supply chain to transform raw materials into finished goods and distribute the finished goods to the customers in a collaborative manner. For success in a supply chain, coherent planning and control across as well as within each of strategic, tactical, and operational issues are of critical importance (Beamon 1999, Son et al. 2002 and Samaddar et al. 2006). In the decision making process of coherent planning and control, the latest information reflecting immediate supply chain status is to be used to make planning and control orders in the best possible harmony with current systems capabilities. However, the large-scale, dynamic and complex nature of supply chains makes coherent planning and control very challenging. While it is true for the strategic and tactical levels, it becomes even more so at the operational level as the number of parameters as well as the frequency of update for each parameter grow significantly. In order to enable timely planning, monitoring, and control of these supply chains at the operational level in an economical and effective way, we have earlier proposed dynamic-data-driven adaptive multi-scale simulation (DDDAMS) architecture (Celik et al. 2007). This research is believed as the first efforts available in the literature to 1) handle the dynamicity issue of the system by selectively incorporating up-to-date information into the simulation-based real-time controller, and 2) introduce adaptive simulations that are capable of adjusting their level of detail according to the altering conditions of a supply chain in the most economic way. The components of DDDAMS architecture include 1) a real-time DDDAM-Simulation, 2) grid computing modules, 3) a web service communication server, 4) a database (online and archival), 5) various sensors, and 6) a real system. In addition, major functions enabling DDDAMS capabilities such as abnormality detection, fidelity selection, fidelity assignment, and prediction and task generation are performed by the algorithms embedded in the real-time DDDAM-Simulation. Among the above mentioned algorithms (functions), the fidelity selection algorithm, whose goal is to determine a proper fidelity level of a simulation model, plays a crucial role for several reasons. First, it enables the simulation to adapt to changing system conditions (available computational resources). Second, it determines how much information is necessary to fully monitor and control the system while the conditions evolve over time. Depending on a specified fidelity, the simulation retrieves corresponding data from various types of sensors placed throughout the shop floor and its partners at the corresponding frequencies. Third, as it is a main decision-making module together with prediction and task generation algorithm in DDDAMS architecture, its accuracy affects performance of the overall system (governed by the DDDAMS-based planning and control structure) most significantly. Fourth, a successive and rigorous computation of such intelligent monitoring algorithms which are developed for large-scale, dynamic and complex systems, consumes considerable amount of computational
978-1-4244-5771-7/09/$26.00 ©2009 IEEE
2281
Celik and Son resources, where its efficiency and parallelization become of primary importance for realization of the proposed architecture in a real-world distributed computing setting. In our earlier work (Celik et al. 2007), we have proposed a skeleton of the above mentioned fidelity selection algorithm using Bayesian Belief Network (Jensen 2001, Pourret, Naim, and Marcos 2008) as it is a virtuous technique to embody cause and effect interactions in a system via a directed acyclic graph. Also, via a BBN, possible parental causes for an observed event (result) can be traced and analyzed (inductive reasoning) even when some information is uncertain or unavailable. However, all the nodes considered in that research are limited to discrete variables, and conditional distributions between nodes and their parents are modeled via empirical distributions only. Although using empirical distribution might be advantageous as it is calculated directly from the actual data, it involves some critical issues that need to be addressed. First, the data used may not represent the entire spectrum of the system behaviors. Second, capturing rare but important events becomes problematic. Third, using every single data point leads to massive datasets whose processing become computationally insupportable in short amount of time for large-scale systems. In this study, to address the above-mentioned issues on the empirical distributions and to employ both discrete as well as continuous variables to formulate the dynamic systems under uncertainties, we propose a generic, modified Sequential Monte Carlo algorithm adopting Bayesian inference. It is a continuous-discrete (hybrid) filtering method (continuous parameters measured at discrete instances of time) that performs fidelity selection in a rigorous but efficient manner. The specific goal of this study is three-fold: 1) to extend the structure of DDDAM-Simulations in such a way to involve numerous fidelities (as opposed to a fixed number in the current work (Celik et al. 2007)), 2) to be able to predict the system status accurately using selective, massive sensor data coming from a large-scale, dynamic manufacturing environment and hence, to trace back the possible parental causes for an observed event in the most effective way, and 3) to perform a parallel Bayesian computation for different portions of the network in order to monitor specific parts of the manufacturing system in detail while monitoring the rest in an aggregated manner. In this study, the proposed algorithm, which is embedded into the DDDAMS architecture, is applied to help optimize preventive maintenance scheduling and part routing in a semiconductor supply chain in a distributed computing environment. The rest of the paper is organized as follows. Section 2 provides a background and literature survey of Bayesian inference and modeling of Sequential Monte Carlo algorithms. Section 3 then describes the Sequential Monte Carlo-based fidelity selection algorithm proposed in this paper. Section 4 describes the designed experiments and results obtained to demonstrate the accuracy and efficacy of the proposed approach and Section 5 summarizes the conclusions derived from this study. 2 2.1
BACKGROUND AND LITERATURE SURVEY Dynamic Systems
Dynamic system is a part of the real world whose behavior changes over time due to its inherent dynamicity, randomness and complexity (e.g. economics, weather, a moving object, signal processing). A state of a dynamic system can be represented using state variables, rate variables, and parameters. Dynamic system considered in this study is a large-scale and complex supply chain where we are interested in analyzing its evolving behavior for us to be able to make critical decisions when necessary. If a state of a dynamic system only depends on its previous state, its state sequence is called to follow a first order Markov random process, and can be represented by state space models using state and observation equations. Here, the general state (motion) and measurement (observation) equations are given in Eq. (1) and Eq. (2), respectively, where xk is state vector at time instant k, fx is state transition function, uk is process noise with a known distribution, zk is observations at time instant k, fz is observation function, and vk is observation noise with a known distribution. xk = fx(xk-1,uk) , zk = fz(xk ,vk)
(1)
The state equation based on fx(·) and density uk characterizes state transition probabilities p(xk|xk-1) for every k-1 given p(x0), whereas measurement equation based on fz(·) and density vk describes measurement probabilities p(zk|xk) (i.e., Hidden Markov Model). The state space approach is convenient for handling multivariate data and nonlinear/non-Gaussian processes, and it provides a significant advantage over traditional time-series techniques (West and Harrison 1997). As opposed to classical time series approach, it usually results in a much better fit to the data. Also, they explicitly take the time dependencies between the observations of a time series data into account. This results in residuals that are much closer to independent random values than in classical models (Commandeur and Jan Koopman 2007).
2282
Celik and Son 2.2
Recursive Bayesian Filters
A Bayesian approach generates enhanced analyses as it takes into account what is actually known and what is not regarding the system to be simulated during its execution. It incorporates prior information into the analysis in a precise and rational manner. When gaining detailed simulation data is costly due to need for large numbers of data points for numerous parameters, Bayesian technique allows for a desired level of precision in knowledge with the minimal amount of data. In the Bayesian framework, prior distributions (i.e., p(x0)) are defined to specify initial uncertainty about unknown parameters; likelihood models (p(zk|xk)) to relate unknown parameters to observable data, and numerical tools (i.e., algorithms, filters) to update beliefs about unknown quantities as data becomes available using Bayes’ rule . The posterior probability p(xk|z1:k) of xk, based on all available measurements up to time k (abbreviated as z1:k), summarizes uncertainty about xk via the likelihood model and prior distribution and performs probabilistic state estimation for a dynamic system (Chick 2006). In this study, we are interested in estimating the posterior distribution of the dynamic supply chain system, which will then help us compute all kinds of estimates for the current state or for future observations (e.g., expected value). In order to estimate the state of a dynamic model, which evolves over time, the Bayesian filtering should be applied in a recursive manner. Recursive Bayesian filters enable sequential update of previous estimates as new data becomes available. Therefore, they allow for batch processing of data by which not only the state of a dynamic system is derived faster, but also rapid adaptation to changing signal characteristics are enabled through on-line processing of data. Recursive Bayesian filters essentially consist of a prediction step, where the next state is predicted using probability density function (p(xk|z1:k-1) = ∫ p(x k|xk-1) p(xk1|z1:k-1)dxk-1) and an update step where the likelihood of current measurement is combined with the predicted state to build the posterior (see Eq. 2). posterior =
p(z k | x k )p(x k | z 1:k -1 ) likelihood • prior => p(x k | z 1:k ) = evidence p(z k | z 1:k -1 )
where p(zk| z1:k-1) = ∫ p(zk| xk) p(xk| z1:k-1)dxk
(2)
2.2.1 Kalman Filters Bayesian analysis, in principle, can be applied in a wide variety of situations, in particular for cases where simple closedform (i.e., natural conjugates) results are available. In a linear state space model, when the posterior distribution of an unknown at time k-1, p(xk-1|zk-1) and the measurement noise are both Gaussian, then new posterior p(xk|zk) also becomes Gaussian and can be computed optimally in a linear state space using Kalman filter. In the present literature, Kalman Filters have proven useful by being applied to a variety of research areas including economy, radar, computer vision, navigating and tracking a target, robot localization, audio and video localizations. While Kalman Filter presents an exact optimal solution for the posterior distribution, assumptions that need to be hold for its implementation are highly restrictive and not realistic for many real world systems. When the process to be estimated or the measurement relationship to the process is non-linear, Extended Kalman filter (EKF) can be used to approximate the optimal solution. The EKF, basically, linearizes the non-linear process model about the current first two moments of the state (i.e., mean and covariance). Unfortunately, the linear approximators to the nonlinear functions (i.e., derivation of the Jacobian matrices) can be complex causing implementation difficulties and these linearizations can lead to filter instability if time step intervals are not sufficiently small (Julier, Jeffery, and Hugh 1995). 2.2.2 Sequential Monte Carlo Methods (Particle Filters) Particle filters are defined as sequential Monte Carlo methods based on point mass (or “particle”) representations of probability densities, which can be applied to any state-space model and which generalize the traditional Kalman filtering methods (Arulampalam et al. 2002). If a natural conjugate prior either does not exist, or is not a suitable way of representing the available prior knowledge in a particular case, then the Bayesian analysis can be carried out by numerical integration, which is computationally harder. In such cases, Particle filters represent the posterior probabilities by a set of randomly chosen weighted samples, where random selection of samples is enabled by Monte Carlo simulations (to approximate integrals). The approximation depends on the ability to sample from the original distribution depicting the system behavior. Almost sure convergence to a true probability density function is assessed as the number of samples increases. Sequential Monte Carlo methods update the estimates of posterior distributions as new data arrives. Particle filtering is the often used term to describe methods that use importance sampling (sequential) to filter out those “particles” that have the least posterior mass after incorporating the additional data. Importance sampling is a general Monte Carlo method for computing integrals. When a sampling mechanism is not readily available for the “target density”, but one is available for another “sampling density”, we can use importance sampling where the relevant distribution is contained in the pairs of samples and
2283
Celik and Son weights, known as particles. It has been demonstrated in the literature (e.g., Liu 1996, Arulampalam et al. 2002, Doucet, Godsill, and Andrieu 2005, Wan and van der Merwe 2001) that the particle filter approach greatly reduces the number of data accesses while maintaining accurate parameter estimates. Several of these studies are compared in Table 1. Other applications include target tracking (Gordon, Harrison, and Smith 1993), enhancement of speech and audio signals in digital environment (Godsill and Rayner 1998) and establishment of a relationship between finite set statistics and conventional probability (Vo, Singh, and Harrison 2005). Table 1: Selected works on Bayesian filters Authors Andradottir and Bier (2000) Ridgeway and Madigan (2002)
Doucet, Godsill and Andrieu (2005)
Linsker (2008)
Problem Assessed Application of Bayesian ideas to simulation Bayesian analysis of massive datasets via modeling of web traffic and robotics Multi-sensor Multi- target Filtering: Establishing the relationship between finite set statistics and conventional probability leading to multitarget filter Learning via Kalman prediction or control in recurrent Neural Network algorithm
Benefits Bayesian ideas used in verification and validation of simulation models (output analysis) and input analysis Allows to stop when parameter uncertainty drops below a tolerance limit Parallelization is possible with ease Convergence of MCMC sampler
Limitations/Areas of Improvement Results are checked by their conformance to prior expectations/ distributions, hence approach is inapplicable to cases when they are not known Empirical work needs to undergo to test its limitations and this approach might not be applicable to high dimensional applications where throwing data away might be costly
Demanding task of computing probability densities of random finite sets is achieved via finite set statistics A principled and computationally tractable SMC implementation of the Bayes multitarget filter is developed
Viability of the proposed approach needs to be tested in real applications Importance distributions should be chosen so as to minimize the (conditional) variance of the weights
Circuit is built to enable comparison with aspects of biological neural networks, particularly in cerebral cortex (CC) Design enables analyzing the restrictive effect of computational tasks on the resulting NN architecture, circuitry and signal flows
Association between certain types of computational tasks and specific architectural features in NN’s can be studied in broader context CC signal flows and their sequencing used in the study as well as CC connectivity are incomplete
As mentioned earlier, in this study, we are interested in preventive maintenance and part routing scheduling problems in supply chain systems. Effective online scheduling mechanism based on DDDAM-simulations requires estimation of the state of a system that changes over time using a sequence of noisy measurements made on the system. In this paper, we will concentrate on the state-space approach to modeling dynamic systems (i.e., supply chains) and enable near optimal fidelity selection in DDDAM-simulations via Sequential Monte Carlo methods. 3 3.1
SEQUENTIAL MONTE CARLO-BASED FIDELITY SELECTION ALGORITHM Overview of DDDAMS
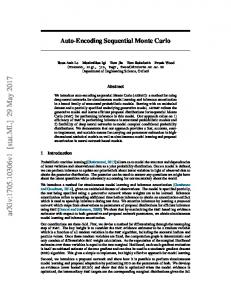
The goal of the DDDAM-Simulation is to achieve the effective synchronization of time and information between the simulation and real-system. This synchronization will then let the simulation run with the most up-to-date data (see Figure 1). In this study, in order to enable effective time synchronization, DDDAM-Simulations are implemented via real-time simulations. A considerable amount of computational resource is consumed by simulation due to its execution as well as sensor data update to reach such an accurately synchronized system. Therefore, DDDAM-Simulations should dynamically adjust their levels of fidelity still assuring information synchronization (without missing ant significant measurement). It is noted that a level of fidelity affects both the simulation execution time as well as the time taken to collect required sensory updates. In our earlier work in DDDAMS (Celik et al. 2007), we have developed four algorithms, which are embedded into the simulation to enable the DDDAMS capability (see Figure 1). The purpose of Algorithm 1 is to filter noise and detect an abnormal status of the system based on the measurement of the current sensory data (such as temperature and pressure). The purpose of Algorithm 2 is to select the proper fidelity level of each component in the system via Bayesian Belief Network (BBN). The purpose of Algorithm 3 is to opt for the available fidelity level of each component by taking the system level computational resource constraint into account. This algorithm obtains a matrix which encapsulates the proper (desirable) fidelity level of each component discussed in Algorithm 2 as an input as well as the available computational resource capacity from the grid computing service, and returns a new matrix which holds the assigned fidelity level for each component in the system that was evaluated at the current time point as an output. The purpose of Algorithm 4 is to obtain optimal control tasks based on
2284
Celik and Son prediction of future system performance. For the considered preventive maintenance scheduling, Algorithm 4 provides recommendations on when the next maintenance operation should take place. For the operations scheduling, it generates control tasks based on the optimal sequence of operations. Available computational resource
Data flow Control flow
Sensory data
Algorithm 1
Filtered data/ Detected abnormality
Data filtering algorithm
Predetermined fidelity level
Algorithm 2 Fidelity selection algorithm
Fidelity assigning algorithm
Assigned fidelity level
Algorithm 4
Information update
Task generation algorithm
Task generation
DDDAMS
Assigned fidelity level
Algorithm 3
Information request
Real System
Machine 1
Machine 2
Machine 3
. . .
Machine n
Figure 1: Embedded Algorithms in DDDAM-Simulation In the proposed work, via advances made in Algorithm 2 (the particle filtering method keeps track of the system status in time), there is no need for Algorithm 1 to detect abnormality. Algorithm 1 still can be used to filter the measurement data from noise, however computation-wise it would be another burden to the system. Therefore, it is disabled in the revised DDDAMS system. On the other hand, Algorithm 2 can handle noisy data via its Bayesian filtering capability. In addition, although Algorithm 2 is built to enable highest computational efficiency, it still assumes that resources are always available for data retrieval and process whenever there is a need to obtain more measurement in higher frequencies. Hence, Algorithm 3 is still required under the revised DDDAMS umbrella. Algorithm 4 is unchanged and used to generate necessary control tasks for the real system based on the real-time sensing capability (Algorithms 2 and 3) of DDDAMS. 3.2
Definition of Fidelities and States
In this study, a fidelity is defined as a measure of accuracy of a model (i.e., simulation) when compared to the real world system. As the fidelity increases, the similarity, both physical and functional, between the simulation and the real system increases. This is enabled via the usage of a greater amount of data which is more frequently updated. However, as the requested amount of data increases, its measurement and processing costs increase as well resulting in a higher computational resource usage and response (processing) time. Particularly, when the simulation is aimed to be used as part of a real-time controller for large-scale, dynamic systems (e.g., supply chains), timely (online) collection of data becomes critical, but harder due to the spread sensors and slower processing of massive information loads. For such cases, selection of optimal or near optimal fidelities for each set/subset of the entire system becomes crucial for the simulation efficacy. In this study, our goal is to help DDDAM-Simulation determine the near optimal fidelities for each and every cell in the shop by effectively using the measurement data. The measurement data used in this study can be of two types: sensory data or performance metric data. Figure 2(b) depicts various sensor types as well as performance metrics used in this study, together with their numbers, measurement units and range of possible values (performance metric data is shown in the last three rows of Figure 2(b) in a separated box). The sensory data shows the instantaneous system change whereas the performance metric data shows the cumulative effect of the successive changes in system state or sensory data. That is why the performance metric data are obtained from machines regardless of the model fidelity whereas the sensory data is used when we go in detail with the system behavior. For instance, if the model fidelity for cell 4 is 2.X, then although we are not in machine level in terms of the decision hierarchy (see Figure 1), we still collect CT (mean cycle time) data from machines in cell 4 in a random manner and average them. The difference is, we basically do not know from which machine this data is coming
2285
Celik and Son from. In contrast, the sensory data can only come from single machines depending on the model fidelity (only in Fidelities 3.X).
Machine
States p(x2|x1)
p(x3|x2)
1
Description
Range
Temp
Temperature
[ 60-85]
Press
Pressure
[980010100]
Snd
Sound
[0-140]
AirQuality
Air quality
[0-500]
Hmd
Humidity
[0-30]
Vib
Vibration
[0-10]
Desibel
dB
PR
Production rate
[0-1]
-
-
RawMatSt
Raw material status
[0-100 ]
Unit
-
CT
Mean cycle time
[ 130150]
Minute
min
p(x5|x4)
p(x4|x3)
3
2 p(x1|x2)
Sensor Type/ Performance Metric
4
5
p(x3|x4)
p(x2|x3)
p(x1|x5) 1: Machine got [0~19] % degraded (BrandNew) 4: Machine got [60~79] % degraded (Abnormal) 2: Machine got [20~39] % degraded (Good) 5: Machine got [80~100] % degraded (Failed) 3: Machine got [40~59] % degraded (Normal)
1: Machine got [0~19] % degraded (Brand New) 2: Machine got [20~39] % degraded (Good) 3: Machine got [40~59] % degraded (Normal) 4: Machine got [60~79] % degraded (Abnormal) 5: Machine got [80~100] % degraded (Failed) Cell/Shop p(x2|x1)
1
p(x3|x2)
3
2 p(x1|x2)
p(x2|x3)
1: Cell/shop is operating under normal conditions 2: Cell/shop is operating under abnormal conditions 3: Cell/shop is operating under serious conditions
Unit
Fahrenheit Pressure per square Desibel Air quality index Gram per cubic meter
Abbreviation for Unit o
F
psi dB AQI g/m 3
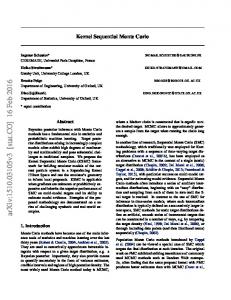
Figure 2(a) Markov chain property defined in terms of aggregated states for each machine, cell and shop (b): Details of sensor types/performance metrics used in this study Most of the sensor types used in the considered system in this research and their measurement units are commonly known, whereas AirQuality and Snd might be exceptions. The measurement unit used to scale the data obtained from the Air Quality sensors is called Air Quality Index (AQI), which is a standardized indicator of the air quality in a given location. It measures mainly ozone and particulates, but may also include sulfur dioxide, and nitrogen dioxide. Various agencies around the world measure such indices, though definitions may change between places. AQI structure used by the United States Environmental Protection Agency (EPA) recognizes the ranges [0-50], [51-100], [101-150], [151-200], [201-300] and [301500] as ‘Good’, ‘Moderate’, ‘Healthy’, ‘Unhealthy’, ‘Very unhealthy’ and ‘Hazardous’ respectively. Snd sensors are also known as acoustic sensors. Although there are other measurement units such as Hz (1/frequency) and dB, the most widely used unit to quantify sound levels is by measuring it relative to 0 dB reference. In this work, the fidelity of a DDDAM-simulation is defined by two numbers separated by a dot (e.g., 2.3) (see Figure 3). The first number indicates the level of decision hierarchy where the decisions are made on which type of measurements should be collected from which portion of the facility (i.e., shops, cells or machines). For example, “1” denotes the shop level, meaning data coming from each performance metric is collected randomly from machines located throughout the entire shop. While the data still have a tag regarding which machine it is associated with, simulation is not necessarily interested in this information as at this level all the machines in the shop are assumed to operate under similar conditions (i.e., same room temperature). If it is “2” for a cell in the manufacturing shop, the selected fidelity of the simulation is in the cell level for this specific cell, but aggregated for the rest (still in Fidelity 1). For a cell with simulation fidelity “2”, data coming from each performance metric is collected randomly from machines located only in this cell. Similarly, if it is “3” for a cell in the shop, the selected fidelity of the simulation is in machine level for this specific cell, but can be different for different portions of the shop (either Fidelity 1, 2 or 3). For a cell with simulation fidelity “3”, data coming from each sensor type as well as performance metric is separately collected for each machine located in this cell. Once these levels of decision hierarchies are determined, levels of data retrieval frequency are determined by the second number. Although levels for the first selection are predetermined, levels for the second selection can change from “1” to infinite, meaning one single data or infinite amount of data can be collected at simulation time from each machine (see Figure 3).
2286
Celik and Son Once near optimal fidelities are chosen for each and every cell in the shop, measurements are collected accordingly. These measurements are then used to determine the very next fidelities and hence very next measurements. This process repeats during the simulation run. Given new measurements, simulation uses them to derive new Bayesian inferences through the particle filter algorithm developed in this study. Bayesian inferences are derived to reflect the system status in terms of machine status, cell conditions and/or shop statuses based on the sensory data. The five states for each machine and the three states for each cell and shop as well as transitions between them are shown in Figure 2(a). In the considered system, each machine can be only at one of these five states and similarly, each cell/shop can be only at one of these three states. Once the system status is determined as such at the end of each processing of Algorithm 2, Algorithm 4 is invoked in order to reschedule (change a current schedule) preventive maintenance and send operational tasks.
Figure 3: Definition of simulation fidelity with levels of decision hierarchy and data retrieval frequency 3.3
Considered Supply Chain System
In this work, a manufacturing supply chain is used as a case study. The considered supply chain is comprised of three echelons including wafer manufacturing, semiconductor die manufacturing, and assembly/packaging facilities. In the wafer fab, the raw silicon wafers are formed. The wafers are then sent to the semiconductor die fabs, where multiple layers of circuits are developed on the silicon wafers, and they are cut into individual chips called dies. The dies are transferred to an assembly and packaging fab to be packaged into integrated circuits. In this considered supply chain, we aim to find best possible preventive maintenance scheduling and part routing. In addition, each facility’s shop floor is comprised of five production cells. There are total of 10 operational machines located in each of these facilities where each machine utilizes 9 sensors of various types. Each cell area is responsible for avoiding possible accumulations or rapid increases in its own work-in-process (WIP). Reducing overall WIP in the facility reinforces importance of the communication within the maintenance team in order to prevent avoidable delays due to machine breakdowns through preventive maintenance (PM).
2287
Celik and Son 3.4
Adaptive Backward Sequential Fidelity Selection Algorithm
k=0 Initialization Historical data
δt*Ns
k k+1
δt
Importance Sampling
~ ( x i )} {x0i :k , w k 0:k
ΔT
δt
Measurement Zk
3
Zk
. δt
Estimate
2 .
Diffusion (Resampling)
{xˆ0:k }
1
ΔT=Sampling Frequency
. Ns
δt*Ns
Figure 5: Acquiring measurement data at time k
Figure 4: Operations of particle filter
The adaptive backward sequential fidelity selection algorithm developed in this work is explained in this section (see Figure 4 for an overview of the algorithm). At the beginning, the historical data is used to obtain enough number of samples to at least generate the prior distribution of the interested variable. Later, the algorithm is tuned in a sequential manner as more sensory data arrives. Aggregated state definitions for machine level, cell level and shop level particle filters are shown in Figure 4. In this work, each machine, cell and shop has their dedicated particle filters. The switch between these filters is dependent on how much accuracy is needed in what frequency during the abnormality detection process. There are no jumps allowed between hierarchical levels of fidelities (i.e., model has to go from fidelity 1.X to 2.X and then 3.X, immediate jumps from 1.X to 3.X is not allowed). The posterior distribution sought here is the p(x|z), where x stands for the state variable reflecting the machine’s status in terms of how close it is to a failure, cell’s status in terms of normality/abnormality and shop’s status in terms of the same. In addition, z reflects the measurement data involving both sensory data (i.e., temperature, sound, vibration, air quality, humidity, pressure) and performance metric data (i.e., production rate, raw material status and cycle time) for machine level fidelities (i.e., fidelity 3.X’s) and only performance metric data for cell level and shop level fidelities (i.e., fidelities 2.X’s and 1.X’s). The sample size of particle set, Ns and time for retrieving single measurement update, δt are determined by the previous level of data retrieval frequency. As the level of data retrieval frequency increases, Ns increases whereas δt decreases in order to have more accurate results in terms of current system status. Here, regardless of the computation time of the algorithm, measurement takes ‘δt.Ns’ time units to complete (see Figure 5). Computational resources are used in three separate places. First, they are used to retrieve the measurement data from the real time machinery to the fidelity selection algorithm (hence the real time simulation). Second, they are used for the prediction step of the particle filtering algorithm in order to derive the estimated states of the machines. Lastly, they are used for the update step of the algorithm where the current model is restored with the usage of new data in order to have better predictions in the future. Therefore, although increased Ns helps us better estimate the posterior, it is costly in terms of both time and computational resource usage. As a result, Ns, should be kept as minimum as possible while obtaining desired accuracy in estimating posterior. The time to re-iterate the algorithm from iteration k-to-k+1 (sampling frequency ΔT) is determined by the previous level of decision hierarchy. The specifications of the fidelity levels included in our DDDAMS work are summarized in Table 2 and details of the algorithm are as follows. Table 2: Specifications of various fidelities included in DDDAMS Fidelity 1.X Fidelity 2.X Fidelity 3.X
Ns
Sampling Horizon (T)
Ts=300 time steps
Tc=200 time steps
Tm=100 time steps
--
Sampling Frequency (ΔT)
ΔTs=30 time steps
ΔTc=20 time steps
ΔTm=10 time steps
--
Time for retrieving single measurement update (δt) Data type collected
3 < δt < 6 time steps
2 < δt < 4 time steps
1 < δt < 2 time steps
--
Performance metric
Performance metric
Sensory
--
when RMSE < 0.1
1.1
2.1
3.1
50
2288
Celik and Son when 0.1≤ RMSE < 0.2
1.2
2.2
3.2
60
when 0.2≤ RMSE < 0.3
1.3
2.3
3.3
70
when 0.3≤ RMSE < 0.4
1.4
2.4
3.4
80
when 0.4≤ RMSE < 0.5
1.5
2.5
3.5
90
when 0.5 ≤ RMSE
1.6
2.6
3.6
100
RMSE: Root Mean Square Error of State Estimation The selection of proposal (importance) density is crucial in realizing any particle filter algorithm as a carefully selected proposal density enables benefits in both the number of particles generated and the computational expense that is necessary for each of these particles. Proposal distribution used in importance sampling is preferred to be a heavy-tailed density. From Bayesian perspective, we know that the proposal distribution q(x|z) is assumed to approximate the posterior p(x|z) and q(x|z) ∝ p(z|x) p(x). Although it does not take measurements into account, for its ease of implementation, we accept the prior distribution as the proposal density in this study (i.e., q(·)= p(xk|xk−1)). Step 1: Initialization Initialization step is held assuming that there are adequate historical measurements obtained for each of the sensor types as well as performance measures in order to generate the prior distribution. • k =0, where k stands for the iteration number. Since initialization happens only once while setting the fidelity selection algorithm, k becomes equal to zero. • For i=1,…, Ns sample x0i ~ p( x0 ) where Ns denotes the sample size and x 0i denotes each individual sample drawn at •
iteration 0. Set k=1
Step 2: Importance Sampling • For i=1,…, Ns sample ~ x0i:k = ( x0i :k −1 , xki ) x ki ~ q ( x k x ki −1 , z k ) where q ( xk xki −1 , z k ) is the proposal density and set ~
p( z k x ki ) p( x ki x ki −1 )
•
For i=1,…, Ns evaluate the importance weights w i = w i k k −1
•
~ i = wi / Normalize the importance weights w ∑ wkj where k k
Ns
q( x ki x0i :k −1 , z1:k )
z1:k are the measurements from time 1 to time k
j =1
Step 3: Diffusion (Resampling) This step is to avoid potential degeneracy problem, where only one particle has a normalized weight of “1” whereas all the rest has almost zero weight. In this step, the particles with low weights are eliminated whereas more particles in more probable regions are selected. Rule 1: Stratified sampling proposed by Kitagawa (1996) which is optimal in terms of variance.
~ If the effective number of particles is less than a given threshold N eff =
1
Ns
∑( ) i =1
~i w k
2
< N threshold , then perform resampling.
~ i exceeds given threRule 2: Resampling proposed by Liu (1996). If the variance of the the normalized importance weights, w k shold •
2 2 σ wk _ sample < σ threshold , then perform resampling.
Resample Ns particles randomly with replacement ( x0i :k ; i = 1, , Ns ) from the current particle set ( ~ x0i:k ; i = 1, , Ns )
~i with probabilities proportional to their normalized importance weights, w k •
For each particle ( x0i :k ; i = 1, , Ns ) set
•
Loss of diversity might become a problem during the resampling process.
~i = 1 w k Ns
2289
Celik and Son Step 4: Set kk+1 Proceed to the Step 2, as the next measurement arrives. Step 5: Estimate posterior Ns
Discrete weighted approximation to the true posterior is computed as p( x k z1:k ) ≈ ∑ w ikδ ( x 0:k − x i0:k ) where δ are the Dirac peaks. i =1
In this work, the above-mentioned algorithm has been implemented in MATLAB 7.6.0 (R2008a) using Object Oriented Programming and data structure featuring of MATLAB where particle filters are embodied in objects. There are three separated particle filters built for each level of decision hierarchy (i.e., Fidelity 1.X, 2.X and Fidelity 3.X). The developed particle filter for Fidelity 1.X, 2.X and 3.X determines the optimal fidelity level at the shop level, cell level and machine level respectively. When a particle filter object is called from the main simulation, it runs until it reaches a decision. In order to reach a decision, the algorithm filter part has to determine the optimum level of data retrieval frequency first which is based on the desired accuracy level. It should be noted here that the sampling horizons and sampling frequencies are different for each particle filter developed as the used sensory data as well as how fast they are needed are different. The particle filter for Fidelity 1.X samples data from the past 300 time steps where each sampling is 30 time steps apart and time for retrieving single measurement update (δt) changes from 6 time steps to as low as 3 time steps. In addition, the data is only sampled from the specified performance data. However, the particle filter for Fidelity 3.X samples data from the past 100 time steps where each sampling is 10 time steps apart and time for retrieving single measurement update (δt) changes from 2 time steps to as low as 1 time steps. Besides, the data is only sampled from the specified sensory data. 3.5
Parallelization of Fidelity Selection Algorithm
As mentioned above, for the current experimentation three separate particle filters are built for three different fidelities (Fidelities 1.X, 2.X and 3.X). Although in the main model, these three objects can be called from each other, they are all located at one central computer. When the fidelity selection algorithm is embodied in a DDDAM-simulation for a real distributed large scale system, this fidelity selection algorithm can be further split in order to allow process parallelization using distributed computing resources. This parallelization schema can be implemented in two ways. First, a separate particle filter can be built for each level of data retrieval frequency instead of level of decision hierarchy. Then these filters can be called from the main model when the situation shows that it is necessary. Since each filter has different sampling frequency and sample size, the necessary ones can be selected based on the need and distributed resource availabilities. However, in this case, some of the sampling regions (shop, a specific cell or a specific machine) for sensor data can overlap. For instance, particle filter for Fidelity 2.4 and 2.5 can try to access the same data of the same cell or machine leading to either over-emphasizing some specific signals or repetitive consideration of the same information. The second and more concise way of parallelization requires keeping the particle filters as they are for each level of decision hierarchy whereas splitting the data regions among each fidelity of data retrieval frequency. For instance, Fidelity 2.4 samples data from the machines 1, 2, 3 whereas Fidelity 2.5 samples data from machines 4, 5, 6 all of which are located in the same cell, say cell 3. This way, no overlap occurs in terms of the sensory data used. In addition, some of the computational resources such as the ones closely located to specific machines can be dedicated to them. Therefore, no additional control system for resource allocation would be needed. While this work focuses on the realization of the actual sequential Monte Carlo-based fidelity selection algorithm (particle filter for each fidelity), the future work will concentrate on the parallelization of the same algorithm. 4
EXPERIMENTS AND RESULTS
In this section, the preliminary results obtained from the proposed and developed fidelity selection algorithm are presented to demonstrate its effectiveness in reflecting the status of system under consideration. An exhaustive experimentation using the proposed fidelity selection algorithm in the integrated DDDAMS system is left as future research. As shown in section 3, three separate fidelity selection algorithms were developed for each level of hierarchy. Since the real data for actual semiconductor supply chain is not available at this phase of the research, the functions shown in Eq. 3, 4, 5 are used for particle filters for Fidelity 1.X, 2.X and 3.X, respectively for testing performance of developed particle filters. 1
1
1
1
1
1
x k = fx( x k −1 , u k ) = 1 + sin (C1 .x k-1 .u k ) + 2 x k-1
2290
(3)
Celik and Son 2
2
2
x k = fx( x k −1 , u k ) = 3
3
3
x k = fx( x k −1 , u k ) =
where the process noises
uk , uk , 1
ty of the vectors x1k , x 2k , and tions,
3
xk
and
3
uk
2
1 + (x k −1 )
2
2
2
2
+ 2 sin (C 2 .x k −1 .u k ) + 4 x k-1
3
x k −1
3
3
(4)
3
(5) + sin (C 3 .x k −1 .u k ) + 6 x k −1 3 2 1 + (x k −1) are generated from Gaussian function. Here it should be noted that the dimensionali-
are not necessarily the same. In fact, although they are all generated from multivariate func-
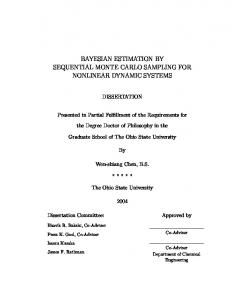
capture three performance parameters and one overall system status parameter whereas x 3k captures five sensory parameters in addition to one overall system status parameter. The representative results obtained from the original function, as well as their estimates generated from the particle filter for Fidelity 3.X in this study are shown in Figures 6(a). During our experimentation, Kitagawa (1996) resampling rule which is explained in detail in Section 3.4 is adapted arbitrarily. Here, we have set the resampling threshold value to 0.6 * Ns (number of particles). The results are coalesced from two sets of experiments. In the first set, each run is composed of five independent replications lasting 900 time steps. During the first set of experimentation, the maximum root mean square error of state estimation (RMSE) is found to be 0.3148 and grand mean RMSE is found to be 0.2096 for particle filter for Fidelity 2.X. Similarly, maximum RMSE and grand mean RMSE are found as 0.3678 and 0.2817, respectively for particle filter for Fidelity 3.X. Lastly, the maximum RMSE of state estimation and grand mean RMSE are found to be 0.4012 and 0.3562, respectively for particle filter for Fidelity 1.X. Figure 6(a) depicts an output snapshot of results obtained from particle filter for Fidelity 3.X. In the second and more exhaustive experiment, each run is composed of 10 independent replications lasting 1000 time steps. Results for this experiment is shown in Figure 6(b), where the maximum RMSE of state estimation is found to be around 0.35 for particle filter for Fidelity 1.X and around 0.45 for particle filters for Fidelity 2.X and 3.X. As can be concluded from these promising results, sequential Monte Carlo-based fidelity selection would lead to highly accurate results while saving computational resources and time. 1 xk
and
2
2
3x k −1
2 xk
Figure 6(a) Output snapshot of results obtained from particle filter for Fidelity 3.X (b) Results from Sequential Monte Carlobased fidelity selection algorithm for all fidelities
2291
Celik and Son 5
CONCLUSION AND FUTURE WORK
In this work, a Sequential Monte Carlo method (sequential Bayesian inference technique) has been proposed and embedded into the DDDAM-Simulation to enable its ideal fidelity selection given large datasets. The proposed method has been built in such a way to reveal cost-efficient inferences for determining the sources of abnormality in the system while saving from computational burden of the overall simulation system. Preliminary results have been obtained from a prototype DDDAMS involving the proposed algorithm for preventive maintenance and part routing scheduling problems in a semiconductor supply chain. The developed Sequential Monte Carlo-based fidelity selection algorithm was able to catch the real system status quite closely where the maximum root mean square error recorded was only 0.45. A parallelization frame has also been discussed on how further reductions and distribution of the computational burden of the algorithm can be enabled while maintaining the accuracy of parameter estimates. Future work of this research primarily concerns itself with the efficient realization of the Sequential Monte Carlo-based fidelity selection algorithm in a parallel computing setting. The synchronization issues regarding both the distributed DDDAS system and distributed computational resources are among the challenges to face. ACKNOWLEDGMENTS This work was supported by the National Science of Foundation under NSF #0540212. REFERENCES Arulampalam, S., S. Maskell, N. Gordon, and T. Clapp. 2002. A tutorial on particle filters for online nonlinear/non-gaussian bayesian tracking. IEEE Transactions on Signal Processing, 50 (2), 174-188. Beamon, B.M. 1999. Measuring supply chain performance. International Journal of Operations and Production Management, 19(3/4), 275–292. Celik, N., S. Lee, K.K. Vasudevan, and Y. Son. 2007. DDDAS-based multi-fidelity simulation framework for supply chain cystems, submitted to IIE Transactions. Chick, S.E. 2006. Bayesian ideas and discrete event simulation: Why, what and how? In Proceedings of the 2006 Winter Simulation Conference, 96-106. Monterey, California. Commandeur J. J. F. and S. Jan Koopman. 2007. An introduction to state space time series analysis. Oxford University Press. Doucet, A., S. Godsill, and C. Andrieu, C. 2000. On sequential Monte Carlo sampling methods for Bayesian filtering. Statistics and Computing, 10, 197-208. Gordon, N.J., D.J. Harrison, and A.F.M. Smith. 1993. Novel-approach to nonlinear non-gaussian Bayesian state estimation. IEE Proceedings of Radar and Signal Processing, 140(2), 107-113. Jensen, V. F. 2001. Bayesian networks and decision graphs. Springer. Julier, S., K. Jeffery and F. Hugh. 1995. A new approach for filtering nonlinear systems. In Proceedings of the 1995 American Control Conference, 1628-1632. Liu, J.S. 1996. Metropolized independent sampling with comparison to rejection sampling and importance sampling. Statistics and Computing, 6, 113-119. Linsker, R. 2008. Neural network learning of optimal Kalman prediction and control. Neural Networks, 21(9), 1328-1343. Ozbek L. and U. Ozlale. 2005. Employing the extended Kalman filter in measuring the output gap. Journal of Economic Dynamics and Control. 29 (9), 1611-1622. Pourret, O., P. Naim, and B. Marcot, 2008, Bayesian networks: A practical guide to applications, UK: Wiley. Ridgeway, G. and D. Madigan. 2003. A sequential Monte Carlo method for Bayesian analysis of massive datasets. Journal of Knowledge Discovery and Data Mining, 7(3), 301-319. Samaddar, S., S.A. Nargundkar, and M. Daleya. 2006. Inter-organizational information sharing: The role of supply network configuration and partner goal congruence. European Journal of Operations Research, 174(2), 744-76.5. Son, Y.J., S.B. Joshi, R.A. Wysk, and J.S. Smith. 2002. Simulation-based shop floor control. Journal of Manufacturing Systems, 21(5), 380-394. Vo, B.N., S. Singh, and A. Doucet. 2005. Sequential Monte Carlo methods for multi-target filtering with random finite sets. IEEE Transactions on Aerospace and Electronic Systems, 41(4), 1224-1245. Wan, E., and R. van der Merwe. 2001. Kalman filtering and neural networks, chap. Chapter 7 : The unscented Kalman filter, ed. S. Haykin, Wiley Publishing. West, M., and J. Harrison. 1997. Bayesian forecasting and dynamic models. 2nd ed. New York: Springer-Verlag.
2292
Celik and Son AUTHOR BIOGRAPHIES NURCIN CELIK is a Ph.D. Candidate in the Department of Systems and Industrial Engineering at The University of Arizona (UofA). She received her B.Sc. in Industrial Engineering from Bogazici University, Turkey, in 2006 and M.Sc. in Systems and Industrial Engineering at UofA in 2008. Her research focuses on architectural design and application of dynamic datadriven adaptive simulations for distributed enterprises. She has received several awards such as UofA Outstanding Research Assistant (2009) Award and the IIE Outstanding Graduate Research Award (2009). She is the treasurer of INFORMS Student Chapter at UofA and a student member of IIE, INFORMS and SME. She can be reached at . YOUNG-JUN SON is an Associate Professor of Systems and Industrial Engineering at The University of Arizona. He is an associate editor of the International Journal of Modeling and Simulation and the International Journal of Simulation and Process Modeling. He has received several awards such as the IIE 2005 Outstanding Young Industrial Engineer, the IERC Best Paper (2005 in modeling and simulation; 2008 in homeland security), and the Best Paper of the Year Awards in 2007 from Int. J. of Industrial Engineering. He has authored or co-authored over 80 publications in refereed journals and conferences, primarily on Distributed Federation of Multi-paradigm Simulations. He can be reached at .
2293