Feb 27, 2000 - George A. Allen, Joy Lawrence, and Petros Koutrakis. Harvard ... Allen, Lawrence, and Koutrakis ..... carbonaceous aerosols, Appel et al.
Field validation of a semi-continuous method for aerosol black carbon (Aethalometer) and temporal patterns of summertime hourly black carbon measurements in southwestern PA.
George A. Allen, Joy Lawrence, and Petros Koutrakis Harvard School of Public Health Department of Environmental Health 665 Huntington Avenue Boston, MA 02115
Atmospheric Environment, 33: (5) 817-823 (Feb 1999) Corrections added February 27, 2000 (COH and O.D.)
Abstract Two methods for measuring aerosol elemental carbon (EC) are compared. Three-hour integrated carbon samples were collected on quartz filters during the summer of 1990 in Uniontown, PA, primarily during episodes of elevated particulate pollution levels. These samples were analyzed for EC and organic carbon (OC) using a Thermo/Optical Reflectance (TOR) method. Aerosol black carbon (BC) was measured using an Aethalometer, a semicontinuous optical absorption method. The optical attenuation factor for ambient BC was supplied by the instrument manufacturer. Three-hour average concentrations were calculated from the semi-continuous BC measurements to temporally match the EC/OC integrated quartz filter samples. BC and EC concentrations are highly correlated over the study period (R2= 0.925). The regression equation is BC (µg m-3)= 0.95 (±0.04) EC - 0.2 (±0.4). The means of three-hour average measurements for EC and BC are 2.3 and 2.0 µg m-3 respectively; average concentrations of EC and BC ranged from 0.6-9.4 and 0.5-9.0 µg m-3 respectively. TOR OC and EC concentrations were not highly correlated (R2= 0.22). The mean OC/EC ratio was 1.85. The 10-week Aethalometer hourly dataset was analyzed for daily and weekly temporal patterns. A strong diurnal BC pattern was observed, with peaks occurring between 7 am and 9 am local time. This is consistent with the increase in emissions from ground level combustion sources in the morning, coupled with poor dispersion before daytime vertical mixing is established. There was also some indication of a day-of-week effect on BC concentrations, attributed to activity of local ground level anthropogenic sources. Comparison of BC concentrations with co-located measurements of Coefficient of Haze in a separate field study in Philadelphia, PA, during the summer of 1992 showed good correlation between the two measurements (R2= 0.82).
Allen, Lawrence, and Koutrakis
Field Validation...
Atmos. Env. 33:5 (Feb 1999)
Page i
Introduction Carbon is one of the most abundant constituents of ambient particulate matter. Carbon can be present as organic carbon (OC), which is volatile, and as elemental carbon (EC), which is non-volatile. Ambient particulate material appears black when collected on a filter due to the presence of elemental carbon. Particulate EC is ubiquitous in the atmosphere, present at levels ranging between 0.05 and 300 ng m-3 in remote areas (Hansen et al., 1988; Andreae et al., 1984; Hansen and Rosen, 1984; Rosen et al., 1984; Rosen and Novakov, 1983; Wolff, 1981) and at higher concentrations, ranging up to 13.3 µg m-3, in urban areas (Wolff, 1981). EC is emitted by virtually every combustion process involving carbonaceous material; it is produced only by combustion processes and not generated by any known atmospheric reactions (Hansen et al., 1988; Hansen et al., 1984; Andreae et al., 1984). EC is not degraded under atmospheric conditions and wet and dry deposition are the only important sinks for EC (Hansen et al., 1988; Ogren et al., 1984; Wolff, 1981). Since EC is predominantly present in submicron particles (Cadle and Mulawa, 1990; McMurry and Zhang, 1989; Hansen et al., 1988; Gray et al., 1984; Wolff, 1981), often with a mass median aerodynamic diameter in the accumulation mode, dry removal rates can be small (Ogren et al., 1984; Wolff, 1981). Lifetime of EC in the atmosphere is on the order of several days to several weeks, depending on meteorology (Wolff, 1981). Ambient data indicates that long range transport becomes important with such long lifetimes (Hansen et al., 1988; Andreae et al., 1984; Rosen and Novakov, 1983; Wolff, 1981). Although EC can be regional in nature (especially in remote areas) local sources are usually dominant (Hansen et al., 1988; Wolff, 1981). Particulate EC has been the subject of interest in recent years for a variety of reasons. It is known that EC plays an important role in atmospheric chemistry because of its catalytic properties (Cadle and Mulawa, 1990; Hansen et al., 1988; Goldberg, 1985; Wolff, 1981) and also affects visibility by light-extinction (Cadle and Mulawa. 1990; Hansen and Rosen, 1990; Gundel et al., 1984; Wolff et al., 1981). Because EC also absorbs light, it may be potentially climate-altering (Cadle and Mulawa, 1990; Gundel et al., 1984; Wolff, 1981). OC contributes to visibility reduction and may contain compounds which are detrimental to human health (Cadle and Mulawa, 1990). An intensive air pollution health effects study was conducted in Uniontown, PA during the summer of 1990. As part of this investigation, measurements of integrated particulate elemental and organic carbon (EC and OC), semi-continuous black carbon (a surrogate for elemental carbon), and light scattering were made to develop models to estimate the contribution of elemental carbon to the extinction budget and evaluate the semi-continuous method for aerosol black carbon (BC). This paper describes and compares the methods for EC and BC, summarizes data from the 11 weeks of BC measurements in southwestern PA, and investigates the relationship between co-located BC and Coefficient of Haze (COH) measurements from a separate field study in Philadelphia, PA, during the summer of 1992. �
�
Experimental Measurement site description The field study was conducted in Uniontown, PA (population 14,000), which is located in Fayette County, 60 km south-southeast of Pittsburgh, PA, and 90 km east of the Ohio River. Allen, Lawrence, and Koutrakis
Field Validation...
Atmos. Env. 33:5 (Feb 1999)
Page 1
This semi-urban and suburban area includes the City of Uniontown and several surrounding townships. There are no major industrial air pollution sources within Fayette County, but there are large regional sources in the area that can impact this site, including Pittsburgh, industries in the Ohio river valley, and the heavily industrialized Monongahela river (17-25 km to the west and northwest). One of the major air pollution sources in the Monongahela river valley is the Hatsfield electric generating station in Masontown, PA, which is 19 km to the west-southwest of Uniontown. The dominant local sources of BC during the summer are expected to be vehicular emissions and open burning of residential and commercial trash (which is allowed and common in the city and surrounding townships). Measurements were taken at a school 2 km north of the center of Uniontown in a residential area, near the top of a hill (elevation 340 m). Since school was not in session during the study period, traffic in the immediate vicinity was minimal. Samples were collected 4.5 m above the ground, 1.5 m above the roof of a small trailer. Methods Integrated Elemental and Organic Carbon Sampling Three hour integrated samples of EC/OC were collected using a parallel plate denuder/filter pack system developed by the Electric Power Research Institute (EPRI, Palo Alto, CA) and AeroVironment, Inc. (Monrovia, CA). The EC/OC carbon sampler consists of a cyclonic separator to remove particles larger than 2.5 µm from the sample stream, strips of quartz filter paper in a denuder to remove vapor phase organic carbon, and 2 back-to-back (primary and secondary) pre-fired quartz fiber filters to collect particulate EC/OC. The purpose of the secondary filter is to capture particulate phase organic carbon volatilized from the primary filter during sampling. The nominal sampler flow rate is 85 lpm (Fitz, 1990). Samples were maintained at temperatures less than 0 C during pre- and post-exposure storage and shipping. The difficulty of sampling particulate OC without positive or negative interference from adsorption and volatilization of vapor phase and semi-volatile particulate organics is well known. The OC/EC sampler used in this study has several advantages: using a denuder to remove the vapor phase organic compounds reduces positive interference on determination of particulate OC; the secondary filter allows some degree of correction for the negative interference due to loss of semi-volatile particulate OC during sampling. The effectiveness of the secondary filter to retain semi-volatile organics during sampling has not been fully evaluated (Fitz, 1990), but the sampler has been shown to be highly effective for EC, with 100% of EC retained on the primary filter. Samples were collected primarily during periods of elevated levels of pollutants. A limited number of three hour samples were collected at relatively low concentrations to provide a larger range of ambient data for the collocation comparison. Laboratory and field blanks were collected at a rate of 10% to determine the limit of detection (LOD); collocated samples were collected at a rate of 10% to determine precision; replicate analysis was performed on 10% of the samples to determine analytical precision. A total of 172 (86 primary and 86 secondary) filters were analyzed by the Desert Research Institute (DRI), Reno, Nevada, using the Thermo/Optical Reflectance (TOR) method (Chow et al., 1993). Semi-continuous Black Carbon (Aethalometer) A model AE-9 Aethalometer (Magee Scientific Inc., Berkeley CA) was used to measure �
Allen, Lawrence, and Koutrakis
Field Validation...
Atmos. Env. 33:5 (Feb 1999)
Page 2
aerosol black carbon (BC) in real time. The method is based on the optical attenuation of light by particles collected on a pre-fired 47mm quartz fiber filter. Using the manufacturer’s conversion factor of 5.3 µg/cm2 optical density, BC data from this instrument has agreed well with EC in previous comparisons (Hansen and McMurry, 1990). This method is similar in principle to the Coefficient of Haze monitors developed over 40 years ago (Hemeon et al., 1953), but is more sensitive and stable. Optical attenuation from BC is calculated using the decrease in light transmission through the filter and the sample volume. The Aethalometer is not designed to measure either aerosol organic carbon or atmospheric light extinction from particles. The principle of the method is described in detail elsewhere (Hansen, 1984). The Aethalometer sample flow rate was 4 min-1. No inlet size fractionation was used. The filter was changed manually every 12 to 48 hours to keep the BC loading within the limits specified by the manufacturer (current versions of this instrument have an automatic filter tape change mechanism). The sample flow rate was a compromise between useful filter lifetime (the time between manual filter changes) for the expected high BC concentrations and the expected LOD for the system. A measurement cycle of 10 minutes was used. Flow, leak, and dynamic zero checks were performed on the Aethalometer once per week. No field BC calibration method was provided or suggested by the manufacturer. All data are reported at standard temperature and pressure. �
�
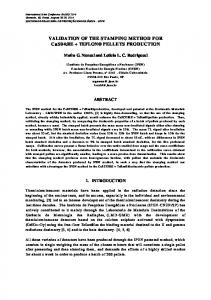
Results and Discussion Semi-continuous Black Carbon (Aethalometer) Hourly Average Black Carbon The AE-9 Aethalometer’s 1-hour limit of detection (LOD) was 100 ng m-3 BC; the LOD of the longer (three hour) Aethalometer BC dataset used in the EC/OC comparison was 30 ng m-3. The 1-hour average concentrations ranged from not detected (ND) at an LOD of 100 to 12,600 ng m-3. Of the 1954 possible hourly averages, 1704 (87%) are valid. The mean concentration of the valid hourly averages is 1233 ng m-3, and the median is 978 ng m-3. The 25th and 75th percentiles were 607 and 1493 ng m-3, and the 5th and 95th percentiles were 259 and 3033 ng m-3 respectively. BC concentrations were high enough to be measured with reasonable precision in greater than 95% of the valid hourly averages. Temporal Patterns of BC Concentrations In the Uniontown area, open burning of trash was allowed. Some townships had regulations restricting burning to Saturdays and/or Wednesdays. The effect of local open burning sources can be observed in the data in Table I. The data are suggestive but not definitive due to the small sample size (11 weeks). Sunday had the lowest average BC concentration (647 ng m-3), Thursday had the highest (1612 ng m-3), and Wednesday the 2nd highest (1490 ng m-3) BC concentration. The highest single day 24-hour average for the study was on a Saturday (3062 ng m-3). Of the 82 possible 24-hour averages, 71 (87%) were valid ( 18 hours midnight to midnight). The diurnal variation of BC is shown in Figure 1. The pronounced morning peak (7 to 9 AM local time) may be due to local sources (burning and vehicles) combined with poor dispersion conditions at that time of day. There is no significant evening rush hour peak, but a broad peak occurs from 8 to 11 PM local time. This could be due to either transport from distant �
�
�
�
�
�
�
�
�
�
�
�
Allen, Lawrence, and Koutrakis
Field Validation...
Atmos. Env. 33:5 (Feb 1999)
Page 3
urban centers or to local burning after dark under stable atmospheric conditions. Figure 2 shows the temporal variation in the 1 h average BC concentrations over one week, Sunday August 12 to Saturday August 18, 1990. The BC concentrations are low from Sunday to Tuesday, and higher during the rest of the week. The typical diurnal pattern with the large morning peak is more evident Wednesday through Saturday, suggesting that local morning trash burning has some influence on the day-of-week concentration pattern. Integrated Three Hour EC/OC Samples Three hour fine mass EC/OC samples were collected primarily during periods of elevated aerosol pollution levels; 72 sampling periods were analyzed. Note that these EC/OC data are not representative of average concentrations due to episode-oriented sampling. Nine co-located samples and twelve field blanks were also analyzed. Figure 3 shows the EC and OC concentrations measured over the study period. OC concentrations are higher than EC (mean OC / mean EC = 1.85), and EC does not co-vary linearly with OC (R2=0.33). This mean OC/EC ratio is slightly higher than mean OC/EC ratios reported for fine particulate mass but within the range of ratios for PM10 and TSP reported in the literature for urban areas. These other studies employed a variety of sampling and analytical techniques which may contribute positive and negative artifacts to OC measurement and partitioning of OC and EC during analysis. Using an OC/EC analysis technique similar to the one used in this study, Gray et al. (1984) found OC/EC ratios ranging from 0.8 to 2.7, averaging 1.6, in fine particulate matter in urban Los Angeles ambient air. Cadle and Mulawa (1990) report OC/EC ratios of 2.26 and 2.78 in PM10 in Glendora, CA, for Hi-Vol and Dichotomous samplers, respectively, when analyzed using a combustion-pyrolysis process. The OC/EC ratio for TSP in the same study was higher for open-faced filters (from 3.6 to 3.8). In samples taken of the Denver Brown Cloud, Wolff et al. (1981) report OC/EC ratios of 1.41 and 1.58 for PM2.5 and TSP, respectively, when analyzed using a pyrolysis-combustion technique. In an early study of carbonaceous aerosols, Appel et al. (1976) suggested that higher OC/EC ratios may be due in part to the photochemical formation of secondary particulate organic matter. The higher fine particulate OC/EC ratios observed in this field study may be attributable in part to the sampling schedule, which specified that samples be collected primarily during episodes of elevated pollutant levels. The impact of local trash burning or the use of a secondary filter to allow (at least partial) correction of OC for loss of semi-volatile material during sampling may also contribute to the higher OC/EC ratios in this study. Concentrations for the 9 co-located samples ranged from 0.36 to 3.53 µg m-3 (EC) and 0.78 to 8.43 µg m-3 (OC). There was very little overall bias between the two samplers; the mean of the differences between the two samplers for the nine samples was -0.06 (EC) and -0.01 µg m3 (OC). Collocated samples were collected to assess the LOD and ambient precision of the OC and EC measurements. Both the LOD and precision can be determined in terms of the rootmean-square error (RMSE), an expression of the overall variability of collocated samples. The RMSE for the collocated EC and OC measurements were 0.22 and 0.58 µg m-3, respectively. The LOD for EC and OC, two times the RMSE, were 0.45 and 1.16 µg m-3, respectively. The estimated relative precision of the EC and OC measurements, a ratio of the RMSE to the average concentration, were 9.4% and 13.5%, respectively. Another estimate of the LOD for OC and EC is based on the standard deviation of the �
�
�
�
�
Allen, Lawrence, and Koutrakis
Field Validation...
Atmos. Env. 33:5 (Feb 1999)
Page 4
blanks; using this approach, the LOD for EC and OC were 0.58 and 1.40 µg m-3, respectively. These values compare very well with the RMSE-based LOD. �
Methods Comparison: Elemental Carbon and Black Carbon Comparison between the Aethalometer BC data and the EC component of the EC/OC sampler data should show good agreement, since EC is expected to be the principal (visible) light absorbing component in ambient air (Hansen and Rosen, 1990; Gundel et al., 1984; Hansen et al., 1984; Wolff, 1981). Ten minute Aethalometer BC data were averaged into three hour values temporally matching the 63 EC/OC samples. The relationship between BC and EC is shown in Figure 4. Linear regression analysis identified one outlier pair, which was removed. The two methods were found to be highly correlated (R2=0.925). The regression equation is: Black carbon (µg m-3) = EC • 0.95 (±0.04) - 0.2 (±0.4). With the outlier pair included in the analysis, R2 decreased to 0.872; removing both the outlier pair and the extreme value gives an R2 of 0.874. Note that this method comparison is between samplers with a 2.5µm size-selective inlet (EC) and total particulate (BC); although most carbon mass is sub-micron, there is a possibility that the correlation reported here is lower than what would have been observed if both samplers had similar inlet size characteristics. The means of 62 three-hour average concentrations are 2.3 (EC) and 2.0 µg m-3 (BC), and the range is 0.6 to 9.4 (EC) and 0.5 to 9.0 (BC). These data show good agreement between BC and EC. In addition, the data suggest that the Aethalometer does not have a substantial response to OC (as operationally defined by the DRI TOR method) at this location and time of year; the much lower EC to OC correlation along with the observed OC to EC ratios would tend to degrade the BC to EC correlation if a strong OC response was present in the BC method. �
�
Methods Comparison: Black Carbon and Coefficient of Haze Coefficient of Haze (COH) is a unit that was developed by Hemeon et al. (1953) to describe the particulate burden of the atmosphere. In principle, measurement of COH is very similar to the measurement of BC by Aethalometer. Measured volumes of ambient air are drawn through a filter; as particulate matter is deposited on the filter, the filter surface is darkened. The extent of optical density of the filter surface is evaluated by measurement of light transmittance through the filter. The attenuation of light transmitted through a filter is a function of the size, density, and color of the particles collected on the filter. A COH unit is defined as the amount of collected material required to produce an optical density of 0.01 at 400nm. The COH unit was used to express smoke concentrations in terms of COHs per 1000 linear feet of air drawn through the filter. Because of the similarity in measurement principle between BC and COH, there should be a strong correlation between collocated measurements of BC and COH. There were no COH data available for Uniontown, PA during the summer of 1990, but collocated Aethalometer BC and COH (RAC 5000) data were collected during a similar field study conducted in Philadelphia, PA, during the summer of 1992. BC was measured at the North Philadelphia Airport by the authors, and COH data from that site were provided by the City of Philadelphia Air Management Services laboratory. Figure 5 shows the relationship between mean particulate black carbon (± standard error) and the coefficient of haze. Although there is not much resolution in the archived COH data, Allen, Lawrence, and Koutrakis
Field Validation...
Atmos. Env. 33:5 (Feb 1999)
Page 5
there is a linear relationship between the two measurements (R=0.994 with a p-value