Final Project Summary Report: Quad Bike Performance Project Test Results, Conclusions and Recommendations
THE QUAD BIKE PERFORMANCE PROJECT
Transport and Road Safety (TARS) Research
FINAL PROJECT SUMMARY REPORT: QUAD BIKE PERFORMANCE PROJECT TEST RESULTS, CONCLUSIONS, AND RECOMMENDATIONS REPORT 4 by
Professor Raphael Grzebieta, Adjunct Associate Professor George Rechnitzer, Mr. Keith Simmons & Dr. Andrew McIntosh TRANSPORT AND ROAD SAFETY (TARS) University of New South Wales Sydney, Australia for
THE WORKCOVER AUTHORITY OF NEW SOUTH WALES 92-100 Donnison Street, Gosford, New South Wales 2250, Australia. January 2015
1
Final Project Summary Report: Quad Bike Performance Project Test Results, Conclusions and Recommendations
Contents Acknowledgements: .................................................................................................................. 4 Disclaimer................................................................................................................................... 6 Further Information ................................................................................................................... 6 1. Executive Summary ............................................................................................................... 7 2. THE QUAD BIKE PERFORMANCE PROJECT .......................................................................... 17 2.1 Background ................................................................................................................ 17 2.2 Project Structure and Methods ................................................................................. 21 2.3 The Project Reports ................................................................................................... 23 3. FATALITY AND INJURY DATA ............................................................................................... 26 3.1 Fatality Data ............................................................................................................... 26 3.2 Injury Data ................................................................................................................. 27 4. THE TEST QUAD BIKES AND SIDE BY SIDE VEHICLES ........................................................... 30 4.1 The Test Vehicles ....................................................................................................... 30 4.2 Operator Protection Devices (OPDs) ......................................................................... 32 5. STATIC STABILITY TESTS AND RESULTS ............................................................................... 34 5.1 Background and Method ........................................................................................... 34 5.2 TTR Results for the Static Stability Tests ................................................................... 36 5.3 Performance of the prototype Quad bike ................................................................. 38 6. DYNAMIC HANDLING TESTS AND RESULTS ......................................................................... 39 6.1 Background and Method ........................................................................................... 39 6.2 Test Results - Steady-State Circular Driving Behaviour: Limit of Lateral Acceleration: .............................................................................................................. 43 6.3 Test Results - Steady-State Circular Driving Behaviour: Understeer/ Oversteer Characteristics .......................................................................................... 44 6.4 Test Results - Lateral Transient Response Time ........................................................ 45 6.5 Test Results - Bump Obstacle Test ............................................................................ 45 7. CRASHWORTHINESS TESTS AND RESULTS .......................................................................... 47 7.1 Background and Method ........................................................................................... 47 7.2 Rollover Crashworthiness of Quad Bikes ................................................................... 48 7.3 Rollover Crashworthiness of SSVs ............................................................................. 49 7.4 Effectiveness of Operator Protective Devices (OPDs) ............................................... 50
2
Final Project Summary Report: Quad Bike Performance Project Test Results, Conclusions and Recommendations
7.5 The Rollover Crashworthiness Ratings ...................................................................... 51 8. ATVAP: THE AUSTRALIAN TERRAIN VEHICLE ASSESSMENT PROGRAM AND STAR RATINGS ............................................................................................................. 54 8.1 Static Stability Overall Rating Index for the 17 Test Vehicles .................................... 54 8.1.1 Basis of the Static Stability Overall Rating Index ................................................ 54 8.1.2 The Static Stability Overall Rating Index for each vehicle .................................. 57 8.1.3 Observations from the two Static Stability Overall Rating Index systems ......... 57 8.2 Dynamic Handling Overall Rating Index for the 16 Test Vehicles ............................. 60 8.2.1 Points Ratings ..................................................................................................... 60 8.2.2 The Dynamic Handling Overall Rating Index ...................................................... 60 8.2.3 Observations from the Dynamic Handling Overall Rating Index ........................ 63 8.3 Rollover Crashworthiness Overall Rating Index for the 16 Test Vehicles ................. 63 8.3.1 Points Ratings ..................................................................................................... 63 8.3.2 The Rollover Crashworthiness Overall Rating Index .......................................... 64 8.3.3 Observations from the Rollover Crashworthiness Overall Rating Index ............ 64 8.4 Final ATVAP Rollover Stability, Dynamic Handling and Crashworthiness Star Ratings for the 16 Production Tested Quad bikes and SSVs .............................. 67 9. CONCLUSIONS ..................................................................................................................... 70 10. RECOMMENDATIONS .......................................................................................................... 86 11. REFERENCES ........................................................................................................................ 91 12. APPENDIX A: Project Reference Group and Quad Bike Performance Research Team .................................................................................................................... 95
3
Final Project Summary Report: Quad Bike Performance Project Test Results, Conclusions and Recommendations
Acknowledgements: This major Quad Bike Performance Project (QBPP) would not have happened had it not been for the substantial efforts and contributions from NSW WorkCover Authority, the NSW State Government and the Heads of Workplace Safety Authorities (HWSA). The Authors are particularly grateful to Mr. Tony Williams and Ms. Diane Vaughan from the NSW WorkCover Authority and to the NSW State Government for initiating and funding this vitally important safety project. The contributions from Mr. Steve Hutchinson and Mr. Victor Turko from the Australian Competition & Consumer Commission (ACCC) are also gratefully acknowledged for the additional funding to include the three recreational Quad bikes into the test matrix. The contribution by HWSA is also gratefully acknowledged. The project team is also appreciative of the generous time, support, technical assistance and comments provided to the Project by the Federal Chamber of Automotive Industries (FCAI) and representatives, and in particular FCAI representatives Mr. Cameron Cuthill (ATV Manager, FCAI), Mr. James Hurnall (Technical Director, FCAI) and through FCAI Dr. John Zellner, Technical Director Dynamic Research Institute1, Inc (DRI, USA). Particular thanks also to FCAI, DRI and Mr. Paul Vitrano and the Specialty Vehicle Institute of America (SVIA) for their generous support in loaning and fully funding the high cost Motorcycle Anthropomorphic Test Device (MATD) test dummy for the crashworthiness testing, and Mr. Ken Wiley from DRI for his secondment from the USA to assist with initial crashworthiness tests using the MATD dummy at Crashlab. While differences in opinion with the testing, ratings and findings of this Report may still be held, the noted support provided by these representatives has been valuable to the project. The project Team would like to particularly thank the Roads and Maritime Services Crashlab test team led by Ross Dal Nevo (Crashlab Manager), Drew Sherry and other Crashlab staff, with assistance from David Hicks from the TARS team, for their inspiring dedication and outstanding work in test development, the over 1000 tests (way beyond original expectations) and providing the high-quality, detailed and voluminous results, photographs, videos and the Crashlab test reports, and all within the budget! The work of Dr. David Renfroe from EI Consultants, LLC (formerly known as The Engineering Institute, LLC) in assisting with the development and analysis on the dynamic handling test programme and provision of the prototype Quad bike, has been particularly helpful and greatly appreciated. Dr. David Renfroe from EI Consultants2 was hired as a consultant to the project. The Authors would also like to kindly thank Mr. David Hicks and Dr. Mario Mongiardini who provided valuable assistance by developing and calibrating the finite element model of the Honda TRX500 FM Quad bike and Quadbar. This allowed a number of simulations to be carried out for the Quad bike tilt table crashworthiness tests prior to actual crash testing.
1
http://www.dynres.com/
2
http://www.enginst.org/
4
Final Project Summary Report: Quad Bike Performance Project Test Results, Conclusions and Recommendations
The Authors would also like to gratefully thank the approximately forty members worldwide of the Project Reference Group (see Appendix A) and others, in particular the following people for their various valuable contributions and comments:
Mr. Colin Thomas from Thomas-Lee Motorcycle Pty Ltd, Moree, NSW and other Quad bike and SSV distributors;
Mr. Neil Storey and Ms. Liela Gato from Safe Work Australia;
Mr. Charlie Armstrong from the National Farmers’ Federation;
Dr. Yossi Berger from the Australian Workers’ Union;
A/Prof Tony Lower from the Australian Centre for Agricultural Health and Safety;
Professor Gordon Smith from Department of Epidemiology & Public Health, University of Maryland School of Medicine, USA;
Drs John Crozier and Danny Cass and the Australasian College of Surgeons' Trauma Committee;
Mr. Jim Armstrong, Branch President Warragul Branch, Victorian Farmers Federation;
Members of the Australian Defence Force, namely Lt Col Colin Blyth, Lt Col Damien McLachlan, Maj Bill Collins, and Lt Col Andrew Heron;
Commissioner Rob Adler, Mr. Jason Levine and Mr. Perry Sharpless from the Consumer Product Safety Commission (CPSC), Bethesda, USA for discussions focussed on the Australia testing of Quad bike and SSVs (ATVs and ROVs);
Mr. Jörgen Persson and Prof. Claes Tingvall from the Swedish National Road Authority, Trafikverket in Borlänge Sweden and Professor Tomas Nordfjell, Professor of Forest Technology at the Swedish University of Agricultural Sciences in Umeå, Sweden for scheduling a two day workshop and discussions focused on Quad bike and SSV (ATV) safety;
The Academy of Sciences, Transport Research Board’s (TRB), ANB 45 Occupant Protection Committee Co-Chairs Joann Wells and Dr. (Capt.) Ruth Shults and TRB’s Mr. Bernardo Kleiner for allowing the scheduling of ANB45(1) sub-committee meetings focused on Quad bike and SSV (ATV and ROV) rollover safety;
Mr. Stephen Oesch (consultant) from the USA for assistance with US Quad bike and SSV (ATV and ROV) data and discussions with US researchers.
Finally, the Authors would like to acknowledge the hard work and valuable contributions of the TARS Quad bike Project Team members not mentioned above: Dr. Rebecca Mitchell, Dr. Tim White, Dr. Declan Patton, and Dr. Jake Olivier, and particularly the administration team looking after the accounts and project administration, namely Ms. Sussan Su and Mr. Nick Pappas and the TARS Director Prof Ann Williamson for her encouragement and patience.
5
Final Project Summary Report: Quad Bike Performance Project Test Results, Conclusions and Recommendations
Disclaimer The analyses, conclusions and/or opinions presented in this report are those of the Authors and are based on information noted and made available to the Authors at the time of its writing. Further review and analyses may be required should additional information become available, which may affect the analyses, conclusions and/or opinions expressed in this report. While the project has been widely researched and developed, with much input from many sources worldwide, the research methods, ratings system, conclusions and recommendations are the responsibility of the Authors. Any views expressed are not necessarily those of the funding agencies, the Project Reference Group (Appendix A), FCAI or others who have assisted with this Project. This report, the associated reports and the results presented are made in good faith and are for information only. The conclusions and recommendations in this final report, if in conflict with any given in supporting reports, take precedence over all the other associated reports. It is the responsibility of the user to ensure the appropriate application of these results if any, for their own requirements. While the Authors have made every effort to ensure that the information in this report was correct at the time of publication, the Authors do not assume and hereby disclaim any liability to any party for any loss, damage, or disruption caused by errors or omissions, whether such errors or omissions result from accident, or any other cause.
Further Information Correspondence regarding the Project and Reports should, in the first instance, be by email to Professor Raphael Grzebieta, at
[email protected] or to the WorkCover Authority of NSW, attention Mr. Tony Williams, at
[email protected].
6
Final Project Summary Report: Quad Bike Performance Project Test Results, Conclusions and Recommendations
1. Executive Summary The Heads of Workplace Safety Authorities (HWSA) identified in 2011 Quad bike safety to be a major issue on farms in Australia and New Zealand. They stated that “In Australia, more than 64 per cent of quad bike deaths occur on farms and in the last 10 years there have been 130 quad bike fatalities across the country. In New Zealand, five people (on average) are killed on farms and over 845 injuries reported each year.” The Authors also note that Quad bikes and Side by Side Vehicles (SSVs) are classified as mobile plant in the Work Health and Safety legislation. The hierarchy of controls for managing risks within that legislation specifies that engineering controls which design out the hazard are considered more effective control measures than administrative controls such as training courses which seek to change human behaviour and personal protection measures (e.g. helmets). This report presents a range of recommendations covering vehicle design, a vehicle star rating, helmets, passengers and loads, child and ageing riders, the supply chain, and retrofitable safety devices and community awareness. The Star Rating System developed and presented in this report is capable of informing both consumers and workplace plant managers and controllers which Quad bikes and SSVs provide improved rollover resistance and rollover crashworthiness protection in the event of a rollover crash. The Quad Bike Performance Project (QBPP) is aimed at improving the safety of Quad bikes, in the workplace and farm environment by critically evaluating, conducting research, and carrying out testing, to identify the engineering and design features required for improved vehicle Static Stability, Dynamic Handling and Rollover Crashworthiness including operator protective devices and accessories. Improving the engineering and design features of Quad bikes is critical in reducing fatalities and injury rates. It is recommended that this is best done through the application of a Quad bike and Side by Side Vehicle Star Rating system (ATVAP: Australian Terrain Vehicle Assessment Program). Such a program would inform consumers purchasing vehicles or accessories for use in the workplace. The Star Rating system is intended to provide ‘a safety rating’ in that vehicles with higher star ratings will represent a lower risk of rollover and subsequent potential injury in the event of a rollover incident in the workplace environment based on the best currently available information. This report provides a summary overview of the whole project along with the conclusions, recommendations and rankings of the vehicles tested. There are four main reports, namely Part 1: Static Stability Test Results (Report 1); Part 2: Dynamic Handling Test Results (Report 2); Part 3: Rollover Crashworthiness Test Results (Report 3) and this Final Project Summary Report: Quad Bike Performance Project Test Results, Conclusions and Recommendations (Report 4). There is also a Supplemental Report that presents a summary of the ‘Examination and Analysis of Quad Bike and Side By Side Vehicle (SSV) Fatalities and Injuries’ carried out by McIntosh and Patton (2014a) and Mitchell (2014) and some further analysis by the Authors Grzebieta, Rechnitzer and Simmons.
7
Final Project Summary Report: Quad Bike Performance Project Test Results, Conclusions and Recommendations
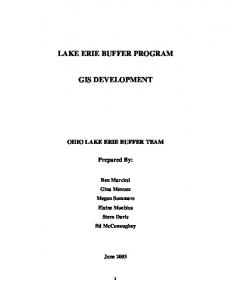
The reader is referred to Part 1: Static Stability Test Results report for the detailed introduction and background to the Quad Bike Performance Project (QBPP) and ATVAP (also see Rechnitzer et al., 2013), which is not repeated here. The (more than) 18 month project comprised a comprehensive research and physical test program involving over 1,000 tests carried out at the NSW Roads and Maritime Services, Crashlab facility at Huntingwood, NSW, Australia. The various tests (Parts 1 to 3) were carried out on 16 production vehicles and one prototype Quad bike. This extensive project also involved the examination and analysis of 109 selected Coronial case files collected from all Australian States and Territories for the period 2000 to 2012, and workplace injury and hospital admissions data from NSW and elsewhere (Supplemental Report). The focus of the test program on rollover prevention and injury mitigation were based on the findings from the fatality data which indicated that rollover was involved in over 71% of the fatalities (77 of 109). This is also consistent with McIntosh and Patton’s (2014b) analysis of the US CPSC’s All-Terrain Vehicle Deaths (ATVD) database (Supplemental Report), also identified around 72% of Quad bike (ATV) fatality cases involved a rollover, being consistent with Australian data. The 16 production vehicles, the prototype Quad bike and the Operator Protection Devices (OPDs) tested are shown in Figure 2 and Figure 3. Proposed ATVAP Star Rating of 16 Production Quad bikes and SSVs The final ATVAP Star Rating for the 16 tested vehicles is shown in Figure 1 below. The maximum rating score is out of 85 points, and from one to five Stars.
Figure 1: Final Points and Star Rating of the 16 production Quad bikes and SSVs tested. (see also Table 10 and Figure 19).
8
Final Project Summary Report: Quad Bike Performance Project Test Results, Conclusions and Recommendations
Four Star ratings were achieved by four of the five SSVS in the following order: by the Tomcar TM2 (max 65pts), the John Deere XUV825i (62pts); the Honda MUV700 Big Red (62pts) and the Kubota RTV500 (59pts). Three Star ratings were achieved by the Yamaha Rhino SSV (50pts), and two of the ‘Recreational’ Quad bikes: the Honda TRX700XX (38pts) and the Can-Am DS90X (37pts). Two Star Ratings were achieved by all the other Quad bikes (28pts to 32pts). It is recognised that in the time elapsed since testing these vehicles, new models may have been released which incorporate better engineering and design features that may deliver a higher star rating. CONCLUSIONS The following conclusions have been drawn from the QBPP’s review of Australian Quad bike and SSV fatality and injury data and the extensive test program (Parts 1 to 3) on Static Stability, Dynamic Handling and Rollover Crashworthiness. The main conclusions from the study are listed as follows: CONCLUSION 1: Quad bike Fatalities and Injuries in Australia for the period 2000-2012. Rollover and being pinned were the most frequent injury mechanisms for Quad bike related fatalities on farms. 1. 141 fatalities were identified from the Australian National Coronial Information System (NCIS) dataset. Approximately 10 to 15 fatalities per annum. 2. 109 fatal cases were relevant, the other 32 cases involved public road crashes or other vehicle types. 3. The 109 cases constituted 106 Quad bikes, and 2 SSVs and one six wheel bike. 4. 86% of deaths were male. 5. Approximately 50% of the 109 fatalities were related to workplace activity (n=54; 53 farms and 1 forestry) and 50% (n=55) to recreational activity. The majority of cases involved riders on their own and remote from immediate help. 6. Approximately 75% of the 109 fatalities occurred on Farms. 7. Rollover occurred in 71% of the 109 cases. Of the 109 cases 85% of the work related fatal cases involved a rollover compared to 56% of recreational cases. 8. Loss of control on a slope and/or driving over an object was a factor in 58% of the farm cases and 33% of recreational cases. 9. In work related fatal cases, a higher percentage of these were older riders, namely: 78% were 50 years or older; 50% were 60 years or older; 42% were 65 years or older; and 33% were 70 years or older. In comparison, for all fatal cases, 43% were 50 years or older, and only 9% of recreational riders killed were 50 years or older. 10. The main cause of death for farm workers was chest injury (59%) compared to head injury for recreational riders (49%). 11. Around 13% of farm workers died as a result of head injury. A helmet was found to be worn in 22% of the 109 cases.
9
Final Project Summary Report: Quad Bike Performance Project Test Results, Conclusions and Recommendations
12. The dominant injury mechanism for farm cases was rollover followed by being pinned by the vehicle resulting in crush injury and/or mechanical asphyxia. 70% were pinned under the Quad bike. Most of the pinned events were with the vehicle on its side not upside down, by a factor of approximately two to one (2:1). 13. Almost 50% of the farm work fatalities were caused by mechanical asphyxia, with approximately 77% of these estimated to have been survivable incidents if the rider did not remain pinned. 14. For recreational riders, a smaller number were pinned under the Quad bike, about 33% of cases. 15. Regarding Quad bike & SSV injuries, based on hospital and other injury databases, it is estimated that there are approximately 1,400 presentations per annum at hospitals in Australia, from minor to severe injuries. CONCLUSION 2: The performance tests and ATVAP Star Rating system developed in this project rated four of the five SSV vehicles significantly ahead of Quad bikes in terms of higher resistance to rollover, and likely3 reduced injury risk in a rollover. However, it also identified lower performance SSVs and Quad bikes. CONCLUSION 3: There is a clear need to distinguish and treat differently the safety requirements for Quad bikes used in the workplace/farms compared with those for recreational use due to different usage requirements. However, there is a common need for improved stability, dynamic handling and rollover crashworthiness safety for both workplace and recreational Quad bike usage. CONCLUSION 4: The findings support the view that multiple controls need to be applied, with a hierarchy based approach. Vehicles should first be selected on a ‘Fit For Purpose’ criterion, to ensure that the correct vehicle is chosen for the work task. CONCLUSION 5: Long term, effective improvement in Quad bike/ SSV safety requires a Vison Zero based ‘Safe System Approach’ (safer vehicles, safer environment, and safer people where deaths or serious injuries in the workplace that results in a permanent disability are not acceptable). That is – a multifaceted holistic approach to safety. CONCLUSION 6: The rollover resistance of Quad bikes is typically low, and provides low margins of safety against rollover, particularly when compared with SSVs. Similarly, the carrying of relatively small loads adversely affects the Quad bike’s stability more than that of the SSVs. CONCLUSION 7: Well-designed SSVs are likely to have higher rollover resistance, better handling and lower severe injury risk than Quad bikes when drivers and passengers wear (three point or harness) seat belts, helmets and use the other restraint systems (head and shoulder barriers) included on the vehicles. SSVs should also have a seat belt interlock
3
Refer for example US CPSC (2014) proposing a safety standard for SSVs regarding the Yamaha Rhino and reduced incidents due to a repair program initiated by the CPSC to improve the vehicle’s handling and stability for SSVs.
10
Final Project Summary Report: Quad Bike Performance Project Test Results, Conclusions and Recommendations
system, i.e. the vehicle should be disabled or only travel at 10 km/h or less if seat belts are not locked in.4 This would similarly apply to a Quad bike should a design with a ROPS and seat belt become available in the future. CONCLUSION 8: Dynamic Handling. The dynamic handling tests were innovative and showed that, contrary to industry opinion, Quad bikes could be subjected to scientifically reliable, repeatable, and meaningful dynamic handling tests. CONCLUSION 9: Dynamic Handling. In contrast to Quad bikes, SSVs generally had more forgiving handling and higher stability characteristics (i.e. higher resistance to rollover), and were less reliant on the operator’s vehicle handling skills. The performance of the prototype vehicle indicates Quad bikes can reach the same level of forgiving handling and higher stability characteristics as SSVs. CONCLUSION 10: Crashworthiness. Quad bikes without a Rollover Protection System (ROPS) have a limited ability to prevent severe injury risk in either low or high speed rollovers, although this also applies to poorly designed SSVs with substandard ROPS and inadequate seatbelts and interlocks, and poor containment to prevent partial ejection. CONCLUSION 11: Operator Protection Devices (OPDs)5. The static stability and dynamic handling tests identified that the Quadbar and Lifeguard (Figure 3) were not detrimental while a third (Quickfix) was found to be detrimental to the stability or handling of the Quad bikes. CONCLUSION 12: OPDs. In regard to injury prevention in rollovers for the workplace environment, two OPDs (Quadbar and Lifeguard) are likely to be beneficial in terms of severe injury and pinned prevention in some low speed rollovers typical of farm incidents. They do not reduce the incidents of rollover. In some specific cases injury risk could be increased although there is currently no real world recorded evidence of this. The findings support the view that multiple controls need to be applied. Of course there is scope for improvements to OPD designs in future. CONCLUSION 13: OPDs In the order of effectiveness, phasing out of Quad bikes and replacing with well-designed SSVs is likely to be superior to reliance on fitment of OPDs for risk mitigation. In the interim, for low speed workplace environments OPDs may be beneficial overall, but may also prove hazardous in some crash circumstances. However, any Australian real world case demonstrating an OPD has been causal to an injury has yet to be identified. Moreover, fitment of these devices needs careful monitoring and evaluation by regulators to ensure that any possible adverse outcomes of OPDs are promptly identified and publicised. This is not to suggest that significant improvements to the rollover crashworthiness effectiveness cannot be achieved for both Quad bikes with OPDs and SSVs in the future.
4
See US CPSC (2014) for examples of seat belt interlock systems offered by some SSV manufacturers.
5
Sometimes also less generically referred to as Crush Protection Devices (CPDs).
11
Final Project Summary Report: Quad Bike Performance Project Test Results, Conclusions and Recommendations
CONCLUSION 14: Quad bike designs can be improved for increased stability and dynamic handling. Quad bike track width can be increased and their driveline and suspension systems modified to significantly improve rollover resistance and handling. Such changes are realistic and practical, as demonstrated, for example, in the testing of the prototype Quad bike and by the US CPSC regarding the Yamaha Rhino repair program.3 CONCLUSION 15: Data collection and recording, and access to data of Quad bike and SSV vehicle incidents at all levels (including fatalities) in the agricultural sector and workplace generally is inadequate, and has been a key obstacle to date in advancing the safety of such vehicles in workplace and agricultural settings. CONCLUSION 16: The handling characteristics and operating environment of Quad bikes and SSVs are sufficiently different from other licensed motor vehicles such as motorbikes, cars or trucks, that vehicle specific basic training and instruction is required for these vehicle types by specialist accredited instructors. This type of training and instruction is equivalent to what is required when first beginning to operate any type of mobile plant. It is not to be confused with advanced driver training. Other specialist training already occurs in other aspects of farming, such as accreditation for chemical and pesticide use. CONCLUSION 17: The fatal incidents involving children operating adult Quad bikes and the inability of children to properly handle adult Quad bikes, identifies that children under 16 should not operate adult-sized Quad bikes. CONCLUSION 18: Incidents involving child fatalities and serious injuries indicate that Quad bikes are not an appropriate vehicle for the transportation of children on farms or recreationally. SSVs (with appropriate child restraints fitted) could be considered as an alternative vehicle. Guidelines for age appropriate standard-compliant child restraint or similar to be used in SSVs needs to be developed. CONCLUSION 19: Active Riding and rider separation are not considered reliable rollover risk reduction strategies for Quad bikes in the work/ farm setting.
RECOMMENDATIONS The Authors recommend that the following strategies should be considered, developed, and implemented as soon as practicable. The use of a Star Rating system to inform consumers has been widely used and accepted by the general public, stakeholders and much of Industry. Examples include star ratings for white goods product energy efficiency, water efficiency (dishwashers, washing machines, etc.), consumer financial products, and, for vehicles, the very successful Australasian New Car Assessment Program (ANCAP), e.g. stars on cars for vehicle safety. Indeed, ANCAP has been a catalyst for and helped promote large technological safety advances that have delivered major safety benefits in terms of reduced community trauma in the case of road vehicles.
12
Final Project Summary Report: Quad Bike Performance Project Test Results, Conclusions and Recommendations
13
It is hoped that ATVAP, if adopted, would provide similar benefits for consumers and workplace plant managers and plant controllers. The objective would be to introduce a robust, test based rating system, in order to provide workplace and consumer based incentives for informed, safer and appropriate vehicle purchase (highlighting ‘Fit For Purpose’ criteria), and at the same time generate corresponding incentives and competition amongst the Quad bike and SSV Industry for improved, safer designs and models. Ideally the ATVAP Rating system would sit within ANCAP to provide consumers with the maximum benefits when considering Quad bikes and SSVs for the workplace and elsewhere. Experience from NCAP has shown that it cannot not be taken as a given that farmers will recognise safety assessment and ratings for their equipment and even if they do will make an informed purchasing decision. Therefore there will be a strong requirement for an effective implementation strategy for ATVAP as well as learning from ANCAP of how this can be done successfully. The Authors recommend that the following strategies should be considered, developed, and implemented as soon as practicable:
Actioned by Recommendation:
Regulator Industry
Workplace
Research Groups
1. Require all Quad bike riders and SSV drivers in the workplace or otherwise to receive vehicle specific basic training and instruction by specialist accredited instructors.
2. Mandate wearing a suitable standard-compliant helmet, that is comfortable for workplace use, yet offers protection against head impact and thermal loading. Industry should encourage the increase of helmet use.
3. No child under the age of 16 should be allowed to operate an adult Quad-bike. A separate study should be undertaken in regards to safety performance and requirements of Quad bikes marketed for use by children under 16. Industry should provide this advice.
4. Where children are carried as passengers in SSVs, an age appropriate standard-compliant child restraint or similar to that used for passenger vehicles is likely to be required, for the same reasons that current adult three point restraints in road vehicles are not appropriate for children. This requirement needs to be investigated. Guidelines for age appropriate standard-compliant child restraint or similar to be used in SSVs needs to be developed.
Final Project Summary Report: Quad Bike Performance Project Test Results, Conclusions and Recommendations
Recommendation: 5. Farmers and the general community should be informed through media and education programs that carrying a pillion (including a child) and elevated loads (e.g. spray tanks) on single rider Quad bikes can be particularly hazardous in terms of considerably reducing the Quad bike’s rollover resistance to dangerously unstable levels as well as negatively impacting the rider's control of the vehicle. Similarly, farmers and the general community should be informed that carrying of relatively small loads adversely affects the Quad bikes stability more that of the SSVs. In addition, a targeted program through rural schools and preschools similar to pool safety and general road safety program could be adopted.
Regulator Industry
14 Workplace
Research Groups
6. Suppliers of aftermarket attachments for Quad bikes and SSVs should assess the effect of their products on the static stability, dynamic handling and crashworthiness of these vehicles and make this information available to prospective purchasers, possibly via a sticker attached to the product.
7. Industry recognise that the majority of farmers killed over the past decade are older riders who in all likelihood will not ride Quad bikes as an Active Rider as recommended by manufacturers and therefore the industry recommend alternate vehicles for older riders. However, it is noted that the Authors do not accept Active Riding as an effective and reliable risk control measure.
8. Recognise that the current configuration Quad bikes are promoted by Industry as Active Riding machines and that riders should not use them if they are not trained, or the task does not allow active riding, etc. The Authors therefore recommend a new safety warning label on Quad bikes with a continuous specific communication campaign to support this:
However, again it is noted that the Authors do not accept Active Riding as an effective and reliable risk control measure. 9. Considering that farmers often work alone in the field, development of a suitable Personal Locator Beacon (PLB), which ideally would activate automatically should a Quad bike roll over, should be developed or resourced from existing technology (e.g. from other industries such as mining) such that this would facilitate assistance as early as possible to a rider in distress.
Final Project Summary Report: Quad Bike Performance Project Test Results, Conclusions and Recommendations
Recommendation: 10. Promote, implement and support the ‘Australian Terrain Vehicle Assessment Program (ATVAP)’ as a consumer guide for Quad bike and SSV buyers, that provides independent information about these new vehicles on the Australian market concerning their rollover resistance and rollover crashworthiness. The Authors recommend that the ATVAP rating should be listed at point of sale, a rating sticker on the vehicle, and ratings presented online as with the ANCAP Ratings. All relevant rating tables and graphs for static stability, dynamic handling and rollover crashworthiness should be included in any ATVAP rating literature or presentation.
Regulator Industry
15 Workplace
11. Any SSV should not be sold in Australia unless it complies with the ANSI/ ROHVA 1-2011 Industry voluntary standard as a minimum, and upgraded as per the recommendations of this, the supporting Part 1 to Part 3 reports, and the US CPSC latest September 2014 recommendations for improved stability, handling and crashworthiness performance requirements.
12. Any Quad bike should not be sold in Australia unless it complies with the ANSI/SVIA 1-2010 Industry voluntary standard as a minimum, and upgraded as per the recommendations of this, and the supporting Part 1 and Part 2 reports for improved stability and handling performance requirements.
13. Evaluation. The Authors strongly recommend a thorough evaluation program be developed and implemented that examines and reviews the safety performance of Quads bikes which comply with ANSI/SVIA 1-2010 and the safety performance of SSVs which comply with the ANSI/ROHVA 1-2011 and ascertain what further safety improvements to these Industry voluntary standards are required, e.g. rollover crashworthiness. These results should be published.
14. Hold workshops in capital cities, major regional centres and agricultural shows to disseminate this project’s findings and safety improvement strategies.
Research Groups
15. Industry consider the standard against which occupant containment and protection are evaluated against, and upgrade the ANSI/ROHVA 1-2011 to include a dynamic rollover crashworthiness test for Side by Side Vehicles for occupant containment and protection.
16. A self-assessment be carried out by farms/workplaces with sloped and/or rugged terrain access roads on farms and terrain to aid in the selection of a vehicle best suited to the task and workplace. Access roads on farms and terrain over which Quad bikes travel should be speed limited taking into consideration the vehicle’s TTR and dynamic handling characteristics. Vehicle distributors should consider this information in making recommendations to prospective purchasers. A template should be developed that assists farmers with such assessments.
Final Project Summary Report: Quad Bike Performance Project Test Results, Conclusions and Recommendations
Recommendation:
Regulator Industry
17. Identify, mark out and sign post using reliable low cost methods, workplace areas inappropriate or hazardous for Quad bikes to travel over. All users should be informed of no-go areas. A template should be developed that assists farmers with such assessments.
16 Workplace
Research Groups
18. A co-ordinated Australia wide comprehensive data collection and reporting, of mobile farm equipment injury and fatal incidents, including explicit details of make, model, year (MMY) to enable on-going evaluation of safety performance be established.
19. Carry out Australia wide exposure surveys to better identify exposure variables for Quad bikes and SSVs to enable risk and Star safety ratings to be further developed for these vehicle types. Such exposure surveys would include MMY data, hours and time of use, kilometres travelled, terrain type, loads carried and attachment types, etc.
20. Engage with insurers, industry, suppliers, government and the community regarding economic factors that currently encourage or discourage (e.g. price) the purchase and operation of vehicles ‘Fit For Purpose’, and identify mechanisms to facilitate safer vehicle selection.
21. OPDs. A minimum of 4 stars rated vehicles should be considered in the first instance when purchasing new vehicles for the workplace. In the circumstances where Quad bikes have been assessed as acceptable in the workplace, new Quad bike purchases should be fitted with OPDs prior to sale, noting they are likely to offer a net safety benefit in slow speed crashes typical of most farm use.
22. OPDs. Wherever possible and practical, the replacement of existing Quad bikes with four star rated vehicles should be considered. Where it has been assessed that existing Quad bikes are still acceptable or cannot be replaced, then OPDs be retrofitted to existing on-farm Quad bikes noting they are likely to offer a net safety benefit in slow speed crashes typical of most farm use.
23. OPDs. In order to provide the ongoing monitoring of the effectiveness and safety of OPDs in a workplace application, a field based monitoring program should be established. Also there is a need to develop a more effective rollover crashworthiness test protocol for evaluation of OPD’s for Quad bikes.
24. Quad bikes. Retrofit programs be considered that improve Quad bike stability and dynamic handling characteristics to achieve at least a three star rating.
Final Project Summary Report: Quad Bike Performance Project Test Results, Conclusions and Recommendations
2. THE QUAD BIKE PERFORMANCE PROJECT 2.1 Background This Project arose from the Heads of Workplace Safety Authorities (HWSA) identifying Quad bike fatalities as being a major workplace health and safety issue. They state that “In Australia, more than 64 per cent of quad bike deaths occur on farms and in the last 10 years there have been 130 quad bike fatalities across the country. In New Zealand, five people (on average) are killed on farms and over 845 injuries reported each year.” The Authors also note that Quad bikes and SSVs are classified as mobile plant in the Work Health and Safety legislation. The hierarchy of controls for managing risks within that legislation specifies that engineering controls which design out the hazard are considered more effective control measures than administrative controls such as training courses which seek to change human behaviour and personal protection measures (e.g. helmets). The Star Rating System developed and presented in this report is capable of informing both consumers and workplace plant managers and controllers which Quad bikes and SSVs provide improved rollover resistance and rollover crashworthiness protection in the event of a rollover crash. The Quad Bike Performance Project (QBPP) is aimed at improving the safety of Quad bikes in the workplace and farm environment by critically evaluating, conducting research, and carrying out testing, to identify the engineering and design features required for improved vehicle Static Stability, Dynamic Handling and Rollover Crashworthiness including operator protective devices and accessories. It is recommended that this best be done through the application of a Quad bike and Side by Side Vehicle Star Rating system (ATVAP: Australian Terrain Vehicle Assessment Program). It is also recommended that ATVAP be located within ANCAP. Such a program would inform consumers purchasing vehicles or accessories for use in the workplace. The Star Rating system is intended to provide ‘a safety rating’ in that Quad bike and SSVs with higher star ratings will represent a lower risk of rollover and subsequent potential injury in the event of a rollover incident, in the workplace environment, based on the best currently available information. HWSA and the Quad bike Industry supported Working Group developed a strategy aimed at reducing fatalities and injuries from Quad bike use on farms in a work setting. Part 7 of that Strategy document was ‘Design’. This related to the aim to ‘critically consider engineering and design features’ for improved vehicle static stability, and improved crashworthiness including rollover protective devices (including retrofit of safety accessories). The work of this Project is intended to address that strategy. In Australia, it is estimated (Mitchell, 2014) that there were approximately 270,000 Quad bikes and SSVs in use in 2010 (Australian ATV Distributors, 2010). This compares to an estimated 80,000 Quad bikes and SSVs in use in New Zealand agriculture in 2010 (Carman et al., 2010) and an estimated 10 million Quad bikes and SSVs in use by 16 million individuals in 2008 in the United States (US) (Helmkamp et al., 2011).
17
Final Project Summary Report: Quad Bike Performance Project Test Results, Conclusions and Recommendations
This Project’s focus on Quad bike rollover and the need for improving vehicle stability and rollover crashworthiness was firstly based on data presented by Lower et al. (2012) which identified the high incidence of rollovers. Of the 127 Quad bike deaths in Australia between 2001 and 2010, they identified that “65% of fatalities occurred on-farm, with 45% of incidents being work-related and 46% involving rollovers of the quad bike.” They further found: “Analysis of the nature of the crash event highlights the leading mechanisms of injury as: collision with stationary object (34), rollover with no load or attachments (33), collision with other vehicle (10) and rollover with spray tank (9). Rollover of the quad bike [was] attributed to 46% of all deaths where the mechanism of injury was known. Additionally, where the work status and mechanism were known, rollovers accounted for 58% of deaths.” The findings of this Project support and extend the analysis by Lower et al. (2012). Detailed analysis of the coronial case files from 2000 to 2012, identified that of the 109 included fatal cases studied in detail: approximately 75% occurred on farms; a rollover occurred in 71% of all cases and of these 85% of the work related fatal cases involved a rollover compared to 56% of recreational cases; 28% involved mechanical asphyxia; 50% were ‘pinned’ by the Quad bike and for the 53 farm cases 68% were ‘pinned’. Regarding Quad bike & SSV injuries, based on hospital and other injury databases, it is estimated that there are approximately 1,400 presentations per annum at hospitals in Australia, from minor to severe injuries. In response to the incidence of fatal and serious injury rollovers involving Quad bikes, and the Quad bike Industry response that provision of rollover protection systems on these vehicles is hazardous6, it has been proposed by some authorities and other safety stakeholders that, as a minimum, OPDs such as the devices shown in Figure 3, be installed on all workplace Quad bikes. That proposal is based mainly on the observation that a two post Rollover Protection System (ROPS) fitted to old and new tractors has resulted in a marked reduction of tractor fatalities (Day & Rechnitzer, 1999; Scott et al, 2002; Franklin et al, 2005) and hence, by analogy, might be effective in reducing Quad bike rollover harm. While in principle it appears that such systems may have a protective benefit in some rollovers, it is also clear that fitment of OPDs will not prevent rollovers from occurring in the first instance and OPDs may not be effective in all rollover situations (Grzebieta and Achilles, 2007), as active separation or ejection still occurs and impact or crush by stiff areas on the Quad bike or the OPD itself may result. Other than the reports by the Authors, Australian research on the effectiveness of OPDs based on fatality and hospital data has yet to be done. Some USA research has been done and published based predominantly on computer simulations and some limited field rollover tests on full ROPS designs (Van Auken and Zellner, 1997 & 1998; Grzebieta et al, 2005; Zellner et al., 2004, 2006, & 2013; Van Ee et al., 2012), but similarly no US cohort studies have been carried out to assess the effectiveness of OPDs in the field or laboratory tests of Quad bikes fitted with an OPD.
6
http://safetyatworkblog.com/2011/05/19/quad-bike-manufacturers-walk-out-of-safety-working-group/
18
Final Project Summary Report: Quad Bike Performance Project Test Results, Conclusions and Recommendations
Thus, there has been little agreement on the way forward in improving Quad bike safety in regard to rollover7. The Industry position for Quad bikes is that while some design and safety performance measures have been standardised and introduced (mandatory under US law), Industry remains focused on rider training, administrative controls and personal protection equipment (PPE) such as helmets. The Authors of this report support administrative controls8, as one of the components of a larger holistic Safe System Approach (Grzebieta et al., 2013) based on the Swedish ‘Vision Zero’ criteria (i.e., deaths or serious injuries in the workplace injury that results in a permanent disability are not acceptable). Any control should include increasing rollover resistance and enhancing rollover crashworthiness design, while still maintaining the operational capabilities of the vehicles. Hence, increasing rollover resistance and enhancing rollover crashworthiness design, should be one of the first components in the hierarchy of controls for managing risks within such a Safe System Approach in the workplace. For this reason, users of Quad bikes, farm Industry groups, safety regulators, farm safety stakeholders and safety researchers, see from the history of safety advances in road vehicle transport that design countermeasures are possible, and that fitment of OPDs to Quad bikes is seen as a means of harm minimisation. In contrast, the Quad bike Industry continues to negate promotion of or indeed adequately research any design solutions concerning fitment of OPDs. The Quad bike Industry’s resistance to fitment of OPDs (in their view) is that there is no scientifically valid research indicating that fitment of OPDs would be effective, not harmful and not compromising the capabilities of the vehicle. Hence, there exists a decades-long impasse on advancing Quad bike rollover crashworthiness safety and the need for a new approach, as a way ahead to reduce Quad bike trauma (Rechnitzer et al., 2013). Whilst the Authors agree with the Quad bike Industry that further in-depth injury data relating the characteristics of Quad bike and SSV rollover crashes to vehicle stability, handling and crashworthiness design would be of benefit, the Authors disagree that vehicle
7
FCAI, (2012). ATV Industry opposes rollover devices on safety grounds. http://www.fcai.com.au/news/news/all/all/311/atv-industry-opposes-rollover-devices-on-safety-grounds.
8
Administrative controls are generally accepted as the lesser effective form of control in a Vision Zero Safe System Approach (death or serious injury that results in a permanent disability in the workplace are not acceptable), in the hierarchy of safety controls. Nevertheless, the FCAI have advised the Authors that: “In the USA, where since 1991 the only increases in control have been in administrative controls (i.e., increasing passage of state laws regarding Quad bike usage, increasing to 47 out of 50 states as of 2013), during 1999 – 2006 Quad bike fatality rates (per 10,000 vehicles in use) decreased by 29%, and during 20012010, Quad bike emergency department rates (per 10,000 vehicles in use) decreased by 56% (Garland (2011, Tables 4 and 7), demonstrating the effectiveness of administrative controls.” However, the Authors note that in the hierarchy of control measures for managing risks, engineering controls which design out the hazard are considered more effective control measures than training courses which seek to change human behaviour. The Authors note from regulations covering mobile plant and structures, that persons with management or control of plant at a workplace are required to prevent mobile plant from overturning or the operator from being ejected from the plant. This person must ensure, so far as is reasonably practicable, that a suitable combination of operator protective devices (OPD) for the plant is provided, maintained and used.
19
Final Project Summary Report: Quad Bike Performance Project Test Results, Conclusions and Recommendations
design safety advances cannot proceed until such data is fully obtained and analysed. This argument should not be used to hinder safety design advancement for Quad bikes and SSVs. The Authors consider that until such data can be obtained, the principles established over the past 50 years in mobility safety for all vehicle types can be usefully and appropriately applied to Quad bike and SSV safety design.9 What is clear is that rollover is a major contributor to fatal and serious injury outcomes involving Quad bikes, and therefore measures aimed at reducing both the incidence and severity of rollover are obvious injury prevention countermeasures that should be strongly advanced. The Authors do not agree that Quad bikes and SSVs are exempt from such fundamental safety principles which apply to all mobile vehicles that transport people (e.g., cars, trucks, trains, trams, buses, etc.). A pro-active approach should be taken rather than waiting another decade until such data may become available, with many additional casualties occurring as a consequence of such delays. We are reminded here of the wise aphorism “Do not let the best be the enemy of the good”, with regard to progressing Quad bike and SSV safety. On this basis, this Project is aimed at addressing Part 7 of the HWSA and Quad Bike Industry Working Group's Strategy (Design) to assist consumers and workplace plant managers and to address the current technical challenges in improving vehicle-centred safety of Quad bikes and SSVs, in the farm environment. This will be done through the development of a Quad bike and SSV Star Rating System - Australian Terrain Vehicle Assessment Program – ATVAP. While clearly we make no claim that the ‘newly-born’ ATVAP can draw on a long and well validated history, as can the NCAP (worldwide New Car Assessment Programs), with its now 36 years history of development, innovation and robust validation (NCAP, started in the USA in 1978), it is apparent that such a testing based star rating system for consumer information has been a major catalyst for and helped promote large technological safety advances in automobile safety, with ‘star ratings’ used in many other arenas.
9
The Industry perspective advice to the Authors regarding Quad bike Safety is that: “The principles established over the past 50 years in ‘rider active’ mobility safety (e.g., for motorcycles) can be usefully and appropriately applied to Quad bike safety design. Principally this is the research of Dr. Peter Bothwell (1973) in a series of studies for the US NHTSA, who found and recommended that motorcycle safety design could be improved by incorporating ‘smooth outer contours’, removing ‘sharp lacerating protrusions”, and “clearing the separation path” of the rider from the motorcycle during accidents.” However the Authors, while acknowledging that some of the principles for motorcycles may also apply to Quad bikes, note in particular that what is not apparently being acknowledged by the Industry are the significant differences in vehicle characteristics, injury mechanisms and operational environment. One of the obvious differences are that Quad bikes are four wheeled vehicles (not two), typically much higher weight (about 250kg to 400kg), with rollover being the most frequent fatal crash mechanism. In particular, as noted from the Coronial data, rollover, being pinned and asphyxia are major fatal injury mechanisms for Quad bikes – however, these are not typical injury mechanisms associated with motorcycles. Thus the necessary safety countermeasures are quite different for motorcycles and Quad bikes. These major differences in the safety paradigm for motorcycles and Quad bikes needs to be recognised by Industry and to date has not been, in the Author’s opinion.
20
Final Project Summary Report: Quad Bike Performance Project Test Results, Conclusions and Recommendations
The project objective is to introduce a robust, test based rating system, in order to provide workplace and consumer based incentives for informed, safer and appropriate vehicle purchase (highlighting ‘Fit For Purpose’ criteria), and at the same time generate corresponding incentives and competition amongst the Quad bike Industry for improved designs and models for the workplace environment. The premise is that Quad bikes and SSVs with a higher resistance to rollover and improved rollover crashworthiness will result in reduced rollover related fatalities and serious injuries. This opinion takes its basis from the Coronial data, which indicates overwhelmingly that rollover, pinned entrapment and asphyxiation are the major casual factors involved in farm place deaths related to Quad bikes. The star rating system can be evaluated progressively over the years based on real world field injury and fatality data. It is hoped that ATVAP will be implemented in Australia (and internationally), and also provide safety gains for Quad bikes, SSVs and similar type vehicles for farm, workplace and indeed eventually in recreation use, over the years as it matures and accumulates further real world data to provide appropriate development, validation and refinement. This report further sets out a series of recommendations for improving farm workplace use of Quad bikes and SSVs, through appropriate vehicle selection based on ‘fitness for purpose’ criteria10, improved vehicle design for rollover resistance, dynamic handling and crashworthiness, fitment of OPDs, driver training and use of personal protective equipment (PPE).
2.2 Project Structure and Methods The project commenced in September 2012, with completion in August/September 2014. The project consisted of six research and testing Tasks of which three essential testing related Parts have been reported on, namely: Part 1 Static Stability Tests, Part 2 Dynamic Handling Tests; and Part 3 Rollover Crashworthiness Tests. Two supplementary Tasks, namely: Collection of Coroner fatality data from all States and Territories and a detailed analysis of the cases and NSW workcover and hospitalisation injury data; and development of a Finite Element Computer model of a Honda 500cc Quad bike and rollover crash simulations (Mongiardini et al., 2014). The sixth and last task is the Final Project Summary Report (this report), namely, Quad Bike Performance Project Test Results, Conclusions and Recommendations. Each of the tasks are detailed as follows in the order they were presented to NSW Workcover: Task 1: Part 1 - Static Stability Tests. This task was comprised of 318 tilt table tests for rollover resistance in lateral roll, forward and rearward pitch. The tests used a 95th percentile Hybrid III Anthropomorphic Crash Test Dummy (ATD) as a surrogate rider with
10
‘Fitness for Purpose’ vehicle selection. This involves matching the vehicle’s stability and crashworthiness requirements to a risk assessment which assesses the workplace operating environment, task environment, and user’s capability. From such an assessment the selection of the most suitable vehicle type can be made and one which would provide a lower risk of a rollover incident occurring and a lower risk of injury.
21
Final Project Summary Report: Quad Bike Performance Project Test Results, Conclusions and Recommendations
a test mass of 103kg. The test matrix included the vehicle on its own with a rider; and with combinations of maximum cargo loads on the front and rear. The effects of a selected sample of operator protection type devices (OPDs) on static stability were also tested to assess their effect on stability. Task 2: Part 2 - Dynamic Handling Tests. This task was comprised of 680 dynamic handling tests which included the ISO 4138: 2012 Passenger Cars - Steady State Circular Driving test method and the ISO 7401: 2011 Road Vehicles - Lateral Transient Response – open loop test method. Both these test methods were modified for a Quad bike and a SSV. An obstacle perturbation test (simulating riding one side over a rock like object) was also included. Components of these tests complemented the static stability evaluation. Task 3: In Depth Case Study of Fatal Australian Quad Bike and SSV Incidents and Retrospective Review of NSW Workcover and Hospitalisation Injury Data. This was presented as a supplementary report detailing and summarising two sub tasks and was completed prior to establishing the rollover crashworthiness assessment method. The intention was to have this task completed prior to the completion of Task 1 (Static Stability Tests). All Coroners in five States (Victoria, NSW, Queensland, Tasmania, South Australia) and the ACT were extremely helpful and provided full access to all the data, including witness statements and photographs. However, there were major delays in accessing data in Western Australia and the Northern Territory, which had carry over effects to the whole Project. A Supplemental Report was submitted to NSW Workcover summarising outcomes from the fatality data collected and analysed by Dr. McIntosh and Dr. Patton (2014a) and the NSW injury data collected and analysed by Dr. Rebecca Mitchell (2014). Task 4: Part 3 - Rollover Crashworthiness Tests. This task was comprised of over 65 tests that focussed on SSVs rollover crashworthiness. Quad bikes were assessed for lateral rollover and front and rear pitch rollover, with and without OPDs, to determine serious injury risk. The tests considered the outcomes from the injury analysis of National Coroners Information System (NCIS) and CPSC data carried out by McIntosh and Patton (2014a), the NSW injury data carried out by Mitchell (2014), and additional analysis of the Coroner case files by the Authors identifying the rollover related injury mechanisms that were causal to the 53 farm workplace fatalities; Task 5: Finite Element Computer Modelling and Simulation. The objective of this research was to develop a Finite Element (FE) model of a typical ATV (the 2012 Honda TRX500FM) used in a farming environment. The FE model has allowed the Authors to simulate the vehicle kinematics that leads to a rollover as well as the interaction between a surrogate Hybrid III ATD rider and the vehicle in typical tilt table rollover crash tests. The developed model, which reproduced in detail the geometry and inertial properties of a real ATV, was validated through comparison with tilt table tests and bump test (Mongiardini et al., 2014). While computer modelling and simulation have been developed and used in this project to assist in refining some of the crashworthiness test protocols, the project is not based
22
Final Project Summary Report: Quad Bike Performance Project Test Results, Conclusions and Recommendations
on virtual modelling, but rather based on the comprehensive physical test program at Crashlab, involving over 1,000 physical tests. Nevertheless, the model proved to be a powerful tool for investigating the risk level of potentially hazardous scenarios ranging from simple turns occurring on level terrain to more complex situations involving holes or obstacles, on level terrain or slopes. A copy of the Journal paper detailing how the model was developed can be provided on request. Task 6. Final Report - Star Rating. This report (current report) details the development of the ATVAP Star Rating system that combines the assessments of all three tests series, namely Part 1 (Rollover Static Stability), Part 2 (Dynamic Handling) and Part 3 (Rollover Crashworthiness), into a 5 Star Rating System. The Star Rating System is intended to provide ‘a safety rating’ in that vehicles with higher star ratings will represent a lower risk of rollover and subsequent potential injury, in the workplace environment, based on the best currently available information.
2.3 The Project Reports This Final Project Summary Report is supported by a series of detailed reports, as set out in Table 1. The Crashlab reports provide details of the test methods and results. The report for the prototype Quad bike was provided to the Authors as a separate report and is not included in any of the report Attachments in order to conceal the identity of the manufacturer. The main reason for this is that the prototype Quad bike is not a production vehicle. Final versions of the TARS Report (this report) and all Supporting Reports have now been finalised. First Draft dates of the reports that were supplied to the NSW Workcover Authority and Industry for review and comment are provided in Table 1. Publications The following papers have been published to date: 1.
McIntosh A.S, Patton D.A, Rechnitzer G. and Grzebieta R.H., (2015). An in-depth case series analysis of Australian quad bike and side-by-side vehicle fatalities, (Submitted to Injury journal for Peer-Review).
2.
Mitchell R.J., Grzebieta R. and Rechnitzer G., (2015). Capture and surveillance of quad bike (ATV)-related injuries in administrative data collections, International Journal of Injury Control and Safety Promotion, Published on-line 7th Jan 2015, http://dx.doi.org/10.1080/17457300.2014.992353.
3.
Grzebieta R.H., Rechnitzer G.R., McIntosh A.S., Mitchell R. and Patton D., (2014). Road Related Quad Bike and Side by Side Vehicle Casualties, Proceedings of the 2014 Australasian Road Safety Research, Policing & Education Conference 12-14 November.
4.
Mongiardini M., Hicks D.C.E., Grzebieta R.H., Rechnitzer G.R., (2014). Modelling a Quad Bike for Simulating Rollover Events, Transportation Research Record (TRR), Journal of the Transportation Research Board (TRB), Vol. No. 2425, Transportation Research Board of the National Academies, Washington, D.C., 2014, pp. 50–60, DOI: 10.3141/2425-07 (also presented at TRB Annual Meeting 2014 Paper No. 14-3603).
23
Final Project Summary Report: Quad Bike Performance Project Test Results, Conclusions and Recommendations
5.
Renfroe, D., Roberts, A., Grzebieta, R., Rechnitzer, G. and Simmons J.K., Reconciliation of ATV/UTV Handling Characteristics and the Operator, SAE Technical Paper 2014-010095, 2014, doi:10.4271/2014-01-0095.
6.
Rechnitzer G., Grzebieta R.H., McIntosh A.S., Simons K., (2013). Reducing All -Terrain Vehicles (ATVs) Injuries and Deaths - A Way Ahead, Proc. 23rd Int. Technical Conference on the Enhanced Safety of Vehicles, Seoul, Korea, Pap. Num. 13-0213-W, May, 2013.
Following WorkCover’s official release of the Project reports, the authors intend to present further papers for publication and presentations at national and international forums.
24
Final Project Summary Report: Quad Bike Performance Project Test Results, Conclusions and Recommendations
25
Table 1: Details of the Final Report’s supporting documentation. TARS Report QBPP: Report 4
TARS Supporting Reports QBPP: Report 1
Other Supporting Reports CrashLab Special Report SR2013/003
Final Project Summary Report: Quad Bike Performance Test Results, Conclusions and Recommendations
Part 1: Static Stability Test Results
Quad Bike Performance Project Quasi-Static Tilt Testing, including Appendix A to F (Test specification, Test matrix, Instrument response data, Test specimen details, Test photographs, Instrument details)
QBPP: Report 2
CrashLab Special Report SR2013/004
Part 2: Dynamic Handling Test Results
Quad Bike Performance Project Dynamic Vehicle Performance Testing Appendix A to G (Test specification, Test matrix, Result summary data, Instrument response data, Test specimen details, Test photographs, Instrument details)
QBPP: Report 3
CrashLab Special Report SR2014/003
Part 3: Rollover Crashworthiness Tests Results
Quad Bike Performance Project Crashworthiness Testing
QBPP Report Supplemental Report
Supplemental Report: Attachment 1 Quad Bike Fatalities In Australia: Examination Of NCIS Case Data - Crash Circumstances And Injury Patterns.
Examination and Analysis of Quad Bike and Side By Side (SSV) Fatalities and Injuries.
Appendix A to E (Test matrix, Instrument response data, Test specimen details, Test photographs, Instrument details)
Supplemental Report: Attachment 3 Report On United States Consumer Product Safety Commission (CPSC) Fatal ATV (Quad bike) Crashes: Circumstances And Injury Patterns. Supplemental Report: Attachment 4 Quad Bike Injuries And Fatalities: A Literature Review. Supplemental Report: Attachment 5 Quad Bike And SSV Crashworthiness Test Protocol. AUTHORS: Attachments 1 and 3 to 5: Dr. Andrew McIntosh and Declan Patton. Supplemental Report: Attachment 2 Quad Bike-Related Fatal And Non-Fatal Injuries: Examination Of Injury Patterns And Crash Circumstances. AUTHOR: Dr. Rebecca Mitchell.
Final Project Summary Report: Quad Bike Performance Project Test Results, Conclusions and Recommendations
3. FATALITY AND INJURY DATA The following section summarises the findings from the examination and analysis of Australian and US fatality and serious injury data relating to Quad bikes and SSVs. These data were used to inform the static stability, dynamic handling and crashworthiness test methods. The findings identified that rollover was the main associated mechanism in fatalities investigated.
3.1 Fatality Data In regards to Australian fatal crashes, 141 fatalities were identified from the NCIS dataset of fatalities that occurred over a period of thirteen years (2000 to 2012). The vehicles involved were almost all Quad bikes. Only five cases involving some form of SSV were found in the data. Full documentation of the closed cases was retrieved from State Coroners around Australia, investigated and key information noted and analysed. It is unclear whether the dominance of the Quad bikes in the data is because of exposure (higher number of Quad bikes and their usage) or other factors. The rate of fatalities per 10,000 vehicles for both Quad bikes and SSVs needs to be established and monitored. Presently, the fatality rate for Quad bikes appears to be around 0.6 per 10,000 vehicles, higher than for road vehicles which is presently around 0.47 per 10,000 vehicles. It is not possible to establish the rate of fatalities per 10,000 vehicles for SSVs. This is because data on the number of SSVs in Australia has not been available from the Federal Chamber of Automotive Industries (FCAI) or elsewhere. Of the 141 cases identified and detailed case files obtained, 32 cases were excluded in this analysis as they involved public road crashes and other vehicle types such as sand dune ‘buggies’. There were 106 Quad bikes, two SSVs and one six wheel straddle type vehicle in the remaining sample of 109 cases Key findings from the NCIS data analysis were that rollover (70.6%) and being pinned (50.5%) by the Quad bike were key factors in these 109 fatal cases; Almost half the farm work fatalities (n=26) were caused by asphyxia or a related condition: Farms were the location for approximately three quarters (82) of all the 109 incidents. Approximately half (n =54: 53 farm and 1 forestry) of the 109 fatalities were related to farming activity and half (55) to ‘recreational’ (non-work) activity. 86% of deaths were male. In work related fatal cases, a higher percentage of these were older riders, namely: 78% were 50 or older; 50% were 60 years or older; 42% were 65 years or older; and 33% were 70 or older. In comparison, for all fatal cases, 43% were 50 years or older, and only 9% of recreational riders killed were 50 years or older. Rollover was the predominant crash type. The vehicle rolled in 77 of the 109 cases (70.6%). Forty six (46) of the 54 (85.2%) work related crashes involved a rollover compared to 31 of the 55 (56.4%) recreational crashes.
26
Final Project Summary Report: Quad Bike Performance Project Test Results, Conclusions and Recommendations
Where the roll direction was noted, there were 11 (10.1%) forward rolls, 32 (29.4%) lateral rolls, 5 (4.6%) rearward rolls (remainder unknown). In 29 (26.6%) cases rollover was noted but the roll direction was unknown. Where the initiator of the crash was known, 31 (57.4%) farm vehicles and 18 (32.7%) recreational vehicles lost control on a slope and/or driving over an object. It was identified from the 37 pinned fatality cases analysed (out of 54 workplace fatalities - 53 farm place and 1 forestry) that riders were predominantly pinned on the left (13) or right (7) side, i.e. a total of 20 cases or around 37% (≈1/3). Ten (10) were pinned with the vehicle upside down and 2 with the vehicle upright. The main cause of death for farm workers was chest injury (59%) compared to head injury for recreational riders (49%). Only 13% of farm workers died as a result of head injury. A helmet was found to be worn in 24 of the 109 cases. Of these, head injury was the cause of death and in nine cases multi-body injury was the cause of death. Rollover accompanied by crush and asphyxiation was identified by McIntosh and Patton (2014a) as one of the major injury causal mechanisms occurring in farming related crashes. Around 62% of farm workers had crush injuries under the vehicle without extensive impact related injuries, e.g. received a flail chest. Moreover, fifty-five (50.5%) of the 109 deceased riders were pinned by the Quad bike, i.e. the person was restrained under the vehicle until they were found. A higher proportion of farm workers (n=37, 69.8%) were pinned under the Quad bike than recreational riders (n=18, 32.7%). This was the dominant injury mechanism for farm workers. From the available information, albeit limited, the Authors estimate that the majority of pinned cases occurred at low speeds, likely approximately 20km/h or less. Almost half the farm work fatalities (n=26) were caused by asphyxia or a related condition. In these cases the worker was pinned under the Quad bike and typically suffered no injury to a body region other than the thorax and injuries to the thorax were not otherwise fatal. The data suggest strongly that approximately twenty (20) of the farm workers who died of asphyxia would have survived the crash if the vehicle did not pin them with a force sufficient in terms of magnitude and duration to cause asphyxia. In most cases the vehicles in this situation were on their side and lesser number were upside down (ratio of approximately 2 to 1). In addition to other approaches described in detail in this report, considering that farmers often work alone in the field, development of a suitable Personal Locator Beacon (PLB), which ideally would activate automatically should a Quad bike roll over and would facilitate assistance as early as possible to a rider in distress.
3.2 Injury Data In regards to injury data, information on the injury patterns and causal circumstances of fatal and non-fatal Quad bike related injuries was obtained from the following data collections: Safe Work Australia’s National Dataset for Compensation-based Statistics (NDS),
27
Final Project Summary Report: Quad Bike Performance Project Test Results, Conclusions and Recommendations
WorkCover NSW’s workers’ compensation scheme claims, WorkCover NSW’s incident reports, Transport for NSW’s Road Crash Analysis System (RCAS), the NSW Admitted Patient Data Collection (APDC), and the NSW Public Health Real-time Emergency Department Surveillance System (PHREDSS). The data collections examined (Table 2 below) have different inclusion criteria and were examined across different time periods. The NDS (excluding NSW and Tasmania) contained 208 claims related to Quad bike incidents during 1 July 2006 to 30 June 2011. WorkCover NSW’s workers’ compensation scheme contained 232 claims during 1 September 2003 to 1 July 2011 and WorkCover NSW’s incident reports contained 80 incidents during 1 September 2003 to 3 November 2012 for Quad bike incidents. The RCAS identified 12 Quad-related fatalities during 1 January 2006 to 16 October 2012. There were 1,515 ‘special all terrain-related vehicles’ identified in the NSW APDC during 1 July 2000 to 30 June 2011 and there were 3,300 Quad bikes, 40 electric Quad bikes, and 11 SSVs identified in the PHREDSS during 1 January 2006 to 31 December 2012. The results from the analysis of the different databases are summarised in Table 2 below. For those databases where the characteristics of the quad-bike incident were known, the table shows that rollover is a major casual factor in incidents and that the thorax is one of the most common body areas injured. While information was readily available to describe the demographic characteristics of the injured individual, the information contained within the data collections was not ideal to describe the model of Quad bike (or SSV) and any attachments, the purpose for which the Quad/ SSV was being used and the circumstances of the crash, including the geographic typology. Details of the mechanisms of how riders/ drivers/ passengers are injured and vehicle make/ model/ year (MMY) are sketchy at best albeit rollover is the major mechanism. This fundamental deficiency with data collection for Quad bikes (and SSVs) is still an impediment to advancing Quad bike safety and needs to be corrected in terms of hospital admissions and work related investigations. Finally, it should be noted that the data indicate that over a seven year period there were around 3,307 records of Quad/SSV related Emergency Department Presentations (EDP) for NSW (around 472 per year). NSW has a population of around 7.3 million and is around 32% of Australia’s total population. Extrapolating the injury count for Quad bikes/SSVs one could expect a total of around 1400 EDP for Australia each year currently.
28
Final Project Summary Report: Quad Bike Performance Project Test Results, Conclusions and Recommendations
Table 2: Summary of Quad bike/SSV vehicle-related incidents for the six data collections examined.
29
Final Project Summary Report: Quad Bike Performance Project Test Results, Conclusions and Recommendations
4. THE TEST QUAD BIKES AND SIDE BY SIDE VEHICLES 4.1 The Test Vehicles A total of seventeen vehicles were included in the test and rating program. These comprised the 16 production vehicles and a prototype Quad bike set out in Figure 2. Details of the test vehicle specification are provided in ‘Part 1: Static Stability Test Results’ report and Attachment 2 in that report, i.e. the Crashlab QBPP Quasi-Static Tilt Testing report, Appendix D. The prototype Quad bike was provided by Dr. David Renfroe11 from EI Consultants, LLC (formerly known as The Engineering Institute, LLC) for testing, late in the program. The prototype was modified in accord with specialist consultancy provided by Dr. David Renfroe to the manufacturer regarding improving Quad bike stability and handling. This vehicle incorporated increased track width (around 150mm either side compared to the Honda TRX700XX, for example), an open and lockable rear differential, and modified suspension design (independent suspension and tuned shock absorber for spring and damping) aimed at significantly improving stability and dynamic handling. Because the vehicle was a prototype the manufacturer’s identity is not revealed in this report. However, the intention of testing this vehicle was to demonstrate that the rollover resistance and dynamic handling of Quad bikes can be significantly improved for the work environment. The results for the prototype Quad bike are compared to the other vehicles but were not included into the final Star Rating table presented later in this report. Only production vehicles are listed in the Star Rating table. Regarding Quad bike and SSV selection, the intent was to obtain examples of new Quad bikes and SSVs typically sold in Australia in late 2012 (i.e. purchased) and in use, subject to the limitations of the project budget. The selection criteria for the Quad bikes included: highest sales by manufacturer and common or popular models for these manufactures; sales data and models as suggested by major Quad bike distributors in NSW and Victoria; representation by imported higher sales of Taiwanese and Chinese models; Australian Quad bike fatality data from the Coronial case files by Quad bike manufacturer examined by the Authors; and Quad bike engine size by fatality (350cc and 500cc identified; although data is very limited). For the three sports/ recreational models, these were selected by the Australian Consumer and Competition Commission (ACCC) in consultation with Quad bike distributors. One of the models included a youth model.
11
Dr. David Renfore is on the Project Reference Group and is also an advisor to the Project Team and Crashlab on this project particularly in regards to the Dynamic Handling Tests.
30
Final Project Summary Report: Quad Bike Performance Project Test Results, Conclusions and Recommendations
No.
1
Model Honda TRX250; Quad bike ($6k)*
2
Honda TRX500FM; Quad bike ($12k)
3
Yamaha YFM450FAP Grizzly Quad bike ($12k)
4
Polaris Sportsman 450HO; Quad bike ($8k)
5
Suzuki Kingquad 400ASI; Quad bike ($9k)
6
Kawasaki KVF300; Quad bike ($6k)
7
Kymco MXU300; Quad bike ($6k)
8
CF Moto; CF500 Quad bike ($6.5k)
No.
Model
9
Can-am DS90X; Sports/ Rec Quad bike (youth) ($5k)
10
Yamaha YFM250R Raptor; Sports/ Rec Quad bike ($8k)
11
Honda TRX700XX; Sports Rec Quad bike ($13k)
12
Yamaha YXR Rhino; SSV ($17k)
13
Kubota RTV500; SSV ($14k)
14
John Deere XUV825i; SSV ($18k)
15
Honda MUV700 Big Red; SSV ($18k)
16
17
Tomcar TM2; SSV ($25k)
Prototype wide track Quad bike
*Approximate bulk purchase cost for the project in Australian dollars, 1k=$1,000 (purchased November 2012 including 10% GST). Note: prices will vary depending on where the vehicle is purchased and under what terms
Figure 2: The 17 test vehicles.
31
Final Project Summary Report: Quad Bike Performance Project Test Results, Conclusions and Recommendations
In regard to the SSV selection, the criteria were based on obtaining vehicles from a retail price ranging from lower cost to higher cost (e.g. Kubota to Honda MUV700), and different model designs which are in more common use (Yamaha Rhino, John Deere; Honda and Kubota). The fifth SSV selected was the Tomcar made by an Australian manufacturer in that the model was just coming onto the market in Australia for farm use, but had a pedigree of being a high mobility vehicle based on an Israeli army ‘all-terrain’ model. It was included in the test series as providing a potential benchmark for good stability, handling and crashworthiness. It should be noted that the vehicles tested in the study were purchased in 2012. Clearly later models would require testing to be able to rate them. The 17 vehicles selected and tested represent the beginning of such evaluations, and as with other rating programs, hopefully, more vehicles will be tested in the coming years. Why Were SSVs Included for Testing and Rating and Not Just Quad bikes? In the original Project plan, the vehicles to be tested were to be restricted to Quad bikes only (12 vehicles). However it became apparent early in the project that this would have been far too limiting in scope, and that Side by Side vehicles (SSVs) should also be included as they were increasingly being used on farms and as possible alternatives to Quad bikes. This was a fundamental (yet still controversial to some) decision made early in the Project to expand the mix of ‘workplace’ and ‘recreational’ Quad bikes and SSVs. This was also the first time that such a comparison of vehicle stability, handling and crashworthiness has been made across such a diverse range of terrain vehicle types. This decision has proven to be valid and invaluable. It has enabled the focus of the study to broaden from being constrained to consider OPDs as being the ‘panacea’ or not and what improvements to Quad bikes could be made. The study now includes a much more fundamental approach to risk reduction/management options involving, in principle, appropriate vehicle selection and ‘fitness for purpose’ criteria, and provision of previously unavailable comparison of Star Rating information for Quad bikes and SSVs for consumers.
4.2 Operator Protection Devices (OPDs) To measure the effects on Quad bike static stability, handling and crashworthiness when OPDs are attached, three different model OPDs (see Figure 3) were fitted to three workplace Quad bikes chosen as representative of good, average and poor performance, in terms of static stability. The OPDs were not able to be fitted to the Sports/ Rec Quad bikes, as none of these units had any suitable mounting points nor was there any practical location for mounting the OPD units. As an integral part of the vehicle’s design the SSVs are already fitted with ROPS and restraints at the point of manufacture.
32
Final Project Summary Report: Quad Bike Performance Project Test Results, Conclusions and Recommendations
Quadbar QB Industries 8.5kg
Lifeguard Ag TECH industries 14.8kg
Quick-fix OPD Quick-fix 30.0kg
Figure 3: The three OPD units used in the static stability tilt-table tests with the workplace Quad bikes. Only the Quadbar and Lifeguard were included in the dynamic handling and crashworthiness test as the Quick-fix was found to be unsuitable from static stability tests.
33
Final Project Summary Report: Quad Bike Performance Project Test Results, Conclusions and Recommendations
5. STATIC STABILITY TESTS AND RESULTS 5.1 Background and Method The Static Stability test program provides the first arm of the assessment and rating of the Quad bikes and SSVs for rollover propensity. Over 340 tilt table tests were carried out at Crashlab to measure the rollover resistance of the 17 vehicles in lateral roll, forward and rearward pitch, with various combinations of rider, loads and OPD devices fitted (Figure 4). Tilt Table Ratio (TTR) The rollover resistance was measured in terms of the fundamental physical stability characteristic for four-wheel vehicles: the point at which “static stability” is lost and at which overturn commences. This can be measured in terms of the parameter Tilt-Table Ratio (TTR) on a tilt table from the measured tilt-table angle (𝛼) at which ‘2-wheel lift’ occurs. 𝑇𝑇𝑅 = 𝑇𝑎𝑛 𝛼 The TTR is the tangent of the angle at tilt, and is very closely related to a vehicle’s Static Stability Factor, which is defined as the ratio of the track width (T) to the centre of gravity height (H): 𝑇
𝑆𝑆𝐹 = 2𝐻 and for small suspension movement with stiff tyres TTR =SSF: 𝑇
𝑇𝑇𝑅 = 𝑇𝑎𝑛 𝛼 = 2𝐻 = SSF While the TTR is a so called ‘static stability’ parameter it is a fundamental determinant of a vehicle’s resistance to rollover whether it is travelling on a slope, or changing direction in a steering manoeuvre, traveling around a curve, braking or accelerating or travelling over rough uneven terrain. The lower the TTR number the lower the vehicle’s resistance to rollover in the test direction (lateral roll, rear or forward pitch). Although other variables such as Active Riding for Quad bikes, suspension design, and handling12 can affect a vehicle’s rollover resistance (i.e. increase or decrease the lateral acceleration at 2-wheel lift), the principal stability characteristics for a vehicle are limited13 by the vehicle’s fundamental geometric properties of Centre of Gravity (CoG) height (and how this varies with any load), wheel base and track width. Note that the testing was conducted with a 95th percentile adult male14. The larger mass ATD was thus used as a
12
The Dynamic Handling tests for this Project are analysed in Part 2.
13
It is noted that with modern vehicles electronic Stability Control Systems (ESC) have been installed to prevent loss of control leading to rollover crashes. Such ESC systems may possibly become relevant for Quad bikes and SSVs to help reduce the incidence of rollover.
14
Workplace risk assessments for plant safety typically require catering for not just a 50 % adult male person th but also for the majority of the working population which includes the higher mass 95 % adult male.
th
34
Final Project Summary Report: Quad Bike Performance Project Test Results, Conclusions and Recommendations
surrogate rider for the Quad bikes, and driver for SSVs. The suspension was ‘unlocked’ in the TTR tests, with suspension and tyre movement allowed. Active Riding – not included in these tests ‘Active Riding’ is promoted as a key part of Quad bike dynamics, training and risk mitigation for rollover and handling by the Quad bike Industry. It involves the rider actively moving and shifting his body position on the Quad bike to increase stability and rollover resistance as well as mobility visibility and other performance attributes. While Active Riding is promoted as playing a part in all Quad bike riding, the limited and significant variability of its effectiveness depending on rider age, weight, physical capabilities, training, experience, and work tasks while riding, means that it is not a reliable risk mitigation strategy in the workplace, and therefore has not been included in the Static Stability test program per se, but is examined in part in the Dynamic Handling tests.15
Figure 4: Photographs from the tilt table tests, showing Quad bike with ATD and OPD for a lateral roll tests, and the John Deere SSV for lateral roll, rear and forward pitch tests.
15
Active riding may increase the performance envelope of a vehicle in many circumstances. The proposed rating system is a relative rating system between vehicles and not a measure of ultimate performance. Each vehicle has been advantaged / disadvantaged equally and hence the comparative rankings would be the same even if active riding were applied.
35
Final Project Summary Report: Quad Bike Performance Project Test Results, Conclusions and Recommendations
36
5.2 TTR Results for the Static Stability Tests Table 3 summarises the TTR results for lateral roll and rearward and forward pitch, including maximum load combinations and OPDs. Figure 5 shows in bar chart form the TTR results. The SSVs generally have a notably higher TTR in all directions than the workplace Quad bikes. For lateral roll the TTR is up to 50% higher with an operator (e.g. TTR = 0.96 vs 0.60). For all of the vehicles forward pitch stability (TTR) is significantly higher than lateral TTR, particularly for the SSVs. This is largely a function of vehicle wheel base and CoG position. The SSVs’ wheelbase range from 1.8m to 2.05m, compared with the much shorter wheelbase for the workplace Quad bikes of 1.13m to 1.28m (see Part 1: Static Stability Test Results). For forward pitch (with an operator) the TTR for SSVs is up to 75% higher than for Quad bikes (e.g. 1.08 vs 1.88). Similarly, for all of the vehicles, rear pitch static stability is higher than lateral static stability when unloaded, particularly for the SSVs. Furthermore, rear pitch static stability is lower than forward pitch static stability, particularly when fully loaded. This is largely a function of the rear loading. With full rear load, as would be expected, rear stability reduces significantly by up to 40%. For the SSVs the rear pitch TTR values compared to forward pitch stability, vary significantly between various SSV models, and are much lower, by almost half from 1.81-1.95 down to 0.77-1.01, when fully loaded. As the SSVs only carry rear load, and have a relatively high rated loaded capacity (181kg to 454kg; see Part 1: Static Stability Test Results, Attachment 2 Crashlab Report, Appendix D), rear pitch static stability is significantly reduced by up to 39% from baseline, down to the range 0.77 to 1.01. TTR and Load Condition Operator Operator Operator only plus rear plus front load load
Vehicle type
Test
Baseline
Work Quad
Lateral roll Rear Pitch F’ward Pitch Lateral roll Rear Pitch F’ward Pitch
0.72 to 0.82 1.13 to 1.31 1.12 to 1.34 0.85 to 1.01 1.08 to 1.66 1.89 to 2.18
0.46 to 0.60 0.78 to 0.95 0.94 to 1.08 0.65 to 0.96 1.04 to 1.49 1.70 to 1.88
0.44 to 0.56 0.62 to 0.79 0.97 to 1.10 0.64 to 0.83 0.77 to 1.01 1.81 to 1.95
Lateral roll
0.99
0.81
Rear Pitch F’ward Pitch
1.19 1.18
Lateral roll
SSV
Prototype Quad bike
Sports/ Rec Quad bike
Operator & front & rear load
TTR Max. Reduction from base line %
0.43 to 0.57 0.81 to 1.01 0.82 to 0.94 na na na
0.41 to 0.55 0.68 to 0.82 0.89 to 1.02 na na na
43% 40% 30% 25% 39% 14%
0.76
0.79
0.75
24%
0.94 1.01
0.85 1.06
0.97 0.94
0.85 0.96
28% 11%
0.93 to 1.10
0.56 to 0.78
na
na
na
40%
Rear Pitch
1.17 to 1.32
0.73 to 0.90
na
na
na
37%
F’ward Pitch
1.31 to 1.39
0.97 to 1.10
na
na
na
26%
Table 3: Tilt Table TTR Summary of Results. Comparison by vehicle type category and change in TTR with maximum loading. 95th % adult male ATD used except for Can-am DS90X youth model where 5th % adult female ATD used.
Final Project Summary Report: Quad Bike Performance Project Test Results, Conclusions and Recommendations
LATERAL ROLL SSVs Quads
REAR PITCH SSVs Quads
FORWARD PITCH SSVs Quads
Figure 5: TTR results for Lateral Roll, Rearward Pitch and Forward Pitch. All 16 vehicles, all tests including OPDs. 95th % adult male ATD used except for Can-am DS90X youth model where 5th % adult female ATD used. Prototype Quad bike not shown.
37
Final Project Summary Report: Quad Bike Performance Project Test Results, Conclusions and Recommendations
38
The relatively low TTRs for Quad bikes highlight the effect of the weight of the rider and full load on reducing Quad bike rollover resistance, and highlight the low stability margins these vehicles may have on steeper slopes and hilly or uneven terrain, which leads to an increased risk of rollover. In regard to discrimination in TTR values between Quad bikes, this is much less marked than the difference between the Quad bikes and SSVs, with SSVs being substantially higher. For the production vehicles, the Quad bike with the highest TTR was less that the SSV with the lowest TTR in almost all situations. It should also be recognised that the rear load capacities (as tested), are much higher for the SSVs than the Quad bikes. The effect of OPDs was varied. Both the lightweight Quadbar (about 8.5kg) and heavier Lifeguard (about 14.8kg) have a small and not significant effect on the stability of the Quad bikes, of less than 4%. However the Quickfix (full 4 post canopy, 30kg) reduced the SSF by about 13% with a rider, and about 8% fully loaded together with a large rider. All of this mass is applied well above the CoG of the Quad bike, and is considered by the Authors as too top heavy. Moreover, the Quickfix canopy restricts riders from correctly riding actively on the machines. For these reasons the Quickfix OPD was not used in any further testing (Dynamic Handling and Rollover Crashworthiness) and is not recommended for use with Quad bikes. In general, the sports/ recreational Quad bikes have higher TTRs than the workplace Quad bikes with a large rider, as a result of a combination of their having a lower CoG height and/or wider track width.
5.3 Performance of the prototype Quad bike The wider track prototype Quad bike has much higher lateral TTR (on average 50% higher) than all the Quad bikes and comparable with some of the SSVs, as shown in Table 4 compared with extracted values from Table 3. For example with an operator, the prototype Quad bike’s TTR was 0.81, compared with a TTR of 0.46 to 0.6 for the other Quad bikes, and 0.65 to 0.96 for the SSVs. As mentioned earlier, the prototype has a widened track width to make the vehicle considerably more stable, an open (lockable) rear differential to allow more responsive and simpler steering on firm terrain, and an understeer characteristic to allow a more intuitive rider response to steering demand in most circumstances.
Vehicle type
Work Quad bike SSV Prototype Quad bike
Test
Baseline
Lateral roll 0.72 to 0.82 Lateral roll 0.85 to 1.01 0.99 Lateral roll
TTR and Load Condition Operator Operator Operator Operator TTR Max only plus rear plus front plus front Reduction from load load and rear load base line % 0.46 to 0.60 0.65 to 0.96 0.81
0.44 to 0.56 0.64 to 0.83 0.76
0.43 to 0.57 na 0.79
0.41 to 0.55 na 0.75
43% 25% 24%
Table 4: Comparison of the Tilt Table TTR results for the prototype Quad bike and the other Quad bikes for Lateral Roll. 95th % adult male ATD used.
Final Project Summary Report: Quad Bike Performance Project Test Results, Conclusions and Recommendations
6. DYNAMIC HANDLING TESTS AND RESULTS 6.1 Background and Method The Dynamic Handling test program provides the second arm of the assessment and rating of the Quad bikes and SSVs for rollover propensity (Figure 7, Figure 8 and Figure 9). Improvements in Quad bike and SSV handling has been highlighted by authors such as Roberts (2009) and others as being a practical means to reduce crash and rollover risk. However, the Industry (through FCAI) claim that there is currently no incident statistical data available or collected to enable determining the correlation (if any) between a vehicle’s handling characteristics and collision and injury risk. The Authors strongly disagree with this proposition. For example, the United States of America (USA) Consumer Product Safety Commission (CPSC) most recent September 2014 report (CPSC, 2014) proposing a Safety Standard for Recreational Off-Highway Vehicles (ROVs), Notice of Proposed Rulemaking, 16 CFR Part 1422 states that: “the Commission believes that improving lateral stability (by increasing rollover resistance) and improving vehicle handling (by correcting oversteer to understeer) are the most effective approaches to reducing the occurrence of ROV rollover incidents”. The CPSC also highlighted in that report the Yamaha Rhino repair program as evidence that improvements to lateral stability and dynamic handling will reduce incidents. Moreover, correlations have been established for Static Stability Factor and risk of a rollover for a diverse range of other vehicle types such passenger cars, SUVs, pickups, four wheel drives and heavy trucks, e.g. Mengert (1989) and New Zealand government (DIER, 2006). This is discussed in more detail in Section 3.3.2 in the Part 1: Static Stability Test Results report. It is obvious from the graphs presented in the Part 1: Static Stability Test Results report (Figures 2 and 3) that the higher the vehicle’s lateral stability is, the less likely the vehicle will roll over because more lateral force is necessary to cause rollover than a vehicle with lower lateral stability, i.e. it has a higher resistance to rollover. In order to show a perspective regarding the stability of Quad bikes and SSVs, Figure 6 provides a comparison of the Author’s postulated crash rate versus Static Stability Factor (SSF) for Quad Bikes and SSVs compared to NHTSA’s Mengert (1989) crash rates for cars and SUVs, and New Zealand’s (DIER, 2006) crash rates for trucks. Figure 6 is essentially a composite (see Figures 2 and 3 in Part 1 report) with the addition of the Author’s postulated curve16, showing the relationship between the TTRs measured for Quad bikes and SSVs versus relative rollover crash rate. Furthermore, Figure 6 shows that the stability of Quad bike’s TTR (SSF) is in the lower range and not dissimilar to trucks; whereas the TTR (SSF) for higher stability SSVs overlaps with a four wheel drive/ Sports Utility Vehicles (SUVs). The Authors postulate that the likely rollover risk for lower stability Quad bikes could be as much as four times (or higher) as the highest stability SSVs.
16
This curve is postulated as the actual real world rollover crash rate versus static stability factor data required has not been collected to date. The data required is the make, model and year (MMY) of the Quad bike or SSV and the actual incidence of rollover (and not just rollover injury events) and exposure data.
39
Final Project Summary Report: Quad Bike Performance Project Test Results, Conclusions and Recommendations
Relative rollover crash rate = 4
Relative rollover crash rate = 1
Postulated rollover crash rate for Quad bikes and SSVs (data still to be determined)
Figure 6: Postulated crash rate versus Static Stability Factor for Quad Bikes/ SSVs with rider/ driver (with 95th % ATD) compared to NHTSA’s Mengert for cars, SUVs & trucks.
40
Final Project Summary Report: Quad Bike Performance Project Test Results, Conclusions and Recommendations
Hence, we the Authors are strongly of the opinion that history has clearly demonstrated that advances in safety for all types of land mobile vehicles are correlated with improvements in stability, handling and crashworthiness. There is no reason why Quad bikes and SSVs should be any different and not obey the same laws of physics and vehicle dynamics.17 The dynamic test program consisted of 546 tests, in three different dynamic tests series all relating to vehicle control and handling characteristics which improve a driver/ rider’s vehicle path control and resistance to rollover. These dynamic tests were also innovative in that they showed that Quad bikes could be subject to scientifically reliable, reproducible, and meaningful Dynamic Handling testing. The tests were also innovative in terms of introducing a bump test to ascertain possible loss of control mechanism leading to rollover. This finding was contrary to claims by some in Industry that such testing was not feasible or meaningful. The overall conclusion from these dynamic tests, was that in contrast to the Quad bikes, SSVs had more forgiving handling and higher stability characteristics (i.e. higher resistance to rollover), and are less reliant on operator vehicle handling skills. The following tests were carried out: 1. Steady-state circular driving behaviour dynamic tests to determine each vehicle’s limit of lateral acceleration and the understeer/ oversteer characteristics. The steadystate circular driving behaviour test consisted of slowly accelerating each vehicle from rest whilst tracking around a circle of 7.6m radius. The vehicle was accelerated until it either lifted (Figure 7) the two inside tyres off the ground and tipped up, drove out of the circle, spun into the circle, or could not travel any faster. 2. Lateral transient response dynamic tests to determine each vehicle’s time taken to respond to steering manoeuvres. The test consisted of driving the vehicle in a straight line at a velocity of 20km/h and then rapidly inputting a steering response to generate a lateral acceleration of 0.4g. The steering response time was recorded. 3. Bump obstacle perturbation tests to determine each vehicle’s ability to ride over bumps with minimal change in steering direction or displacement of the rider/ driver. The test consisted of towing the vehicle in a straight line towards a 150mm high semicircular ‘bump’ object lined up with either the right or left vehicle track. Each vehicle ‘free-wheeled’ over the obstacle without being under the effect of the tow system. A 95th % adult male ATD was positioned on the vehicle with the resultant lateral and vertical pelvis acceleration recorded. The steady-state circular driving behaviour and lateral transient response tests were conducted at Sydney Dragway, Eastern Creek, NSW, Australia. The bump obstacle perturbation tests were conducted at Crashlab, Huntingwood, NSW, Australia.
17
This has been discussed in more detail in the Part 1 and Part2 reports and the US CPSC (2014) report.
41
Final Project Summary Report: Quad Bike Performance Project Test Results, Conclusions and Recommendations
Figure 7: Typical quad circular driving behaviour test (G130449) – both wheels lifted.
Figure 8: Typical Side by Side Vehicle setup – no load case.
Figure 9: Quad bike vehicle setup – with OPDs (Quadbar and Lifeguard). 4. Asphalt surface. While most testing was conducted on an asphalt surface (for reproducibly of tests results), to identify the effects of different surfaces on handling, some testing was conducted on dry grass as well. 5. Repeatability. Each test configuration was tested three times to establish result repeatability. Full results tables are contained in ‘Part 2: Dynamic Handling Test Results’ Attachment 1, Crashlab Report (Section 3 and Appendix C). These results show good repeatability and confirm that Quad bikes can be reliably tested and rated for dynamic handling characteristics, and thus also improvements in dynamic handling can be demonstrated.
42
Final Project Summary Report: Quad Bike Performance Project Test Results, Conclusions and Recommendations
6.2 Test Results - Steady-State Circular Driving Behaviour: Limit of Lateral Acceleration: The dynamic test results are summarised in Figure 10. They show for each vehicle the limit of lateral acceleration (in ‘g’) for when two wheel lift occurs (i.e. tip up) or when the vehicle slides out or broke traction (no tip up). Also shown as a comparison is the measured ‘static’ lateral stability in terms of the Tilt Table Ratio (TTR), from the Static Stability Test Results Report. The observations from these test results are: 1. For the production Quad bikes the measured minimum limit of lateral acceleration at tip up was in the range of 0.55g to 0.36g, and for each Quad bike was less than the TTR. The circle tests validated that the tilt-table static stability TTR value provide valid measures of the lateral stability (i.e. level of rollover resistance) of Quad bikes. 2. For the production Quad bikes the limit of lateral acceleration occurs by tipping up onto two wheels, which unless able to be counteracted by the rider, is a precursor to rollover or loss of control – that is, a loss of stability. 3. For the SSVs, those that had an open differential did not tip but either simply broke traction on the rear inside wheel and reduced speed or slid out. The Yamaha Rhino had a locked differential and reached its limit of lateral acceleration by tipping up. These results are consistent with the static stability tilt-table tests, which showed higher stability metrics for the SSVs. Effect of Different surfaces 4. The three Quad bikes that were tested on asphalt and grass displayed very similar handling characteristics and tipped up at similar lateral acceleration values on both surfaces. Testing of Quad bikes on an asphalt surface did provide relevant, performance characteristics. 5. The Honda TRX250 Quad bike18 was used as a representative Quad bike for comparing the effects of surface type, load combinations and Active Riding on lateral stability. With Active Riding (asphalt), the dynamic stability values increased by approximately 13%, from 0.46g up to 0.52g. These values were very similar to the tilt table TTRs (without Active Riding) of 0.51. Effect of the Quadbar and Lifeguard 6. The example Quad bike (Honda TRX250) when tested with the Quadbar and Lifeguard OPDs, showed only a minor change in limit of lateral acceleration (0.46g down to 0.45g).
18
A ‘representative’ Quad bike was selected for these comparison tests. It was beyond the scope and budget of this dynamic test program to be able to test all of the 16 vehicles in all load and surface combinations. As noted well in excess of 546 tests were conducted in this dynamic test program alone.
43
Final Project Summary Report: Quad Bike Performance Project Test Results, Conclusions and Recommendations
Figure 10: Steady State circular driving test - Average (minimum) limit of lateral acceleration vs TTR (g). The category ‘Yes’ is for two wheel lift occurring (i.e. tip up), and ‘No’ is for no tip up. Asphalt surface, rider/driver only. Hashed columns are for SSVs.
6.3 Test Results - Steady-State Circular Driving Behaviour: Understeer/ Oversteer Characteristics In order to handle well (consistently and safely) and reduce the risk of a loss of control crash occurring, a Quad bike or Side by Side, like any other self-propelled vehicle, should have a slight understeer characteristic when excited between 0.1 and 0.5 g lateral acceleration. 1. The results overall obtained show that most Quad bikes tested had an oversteer characteristic, which is not a favourable characteristics for most workplace riding situations.19 Notably, the Honda TRX700 recreational Quad bike, showed a light understeer characteristic of around 2 degrees per g through to above 0.5 g. This is considered by the Authors to be a very good steering characteristic and demonstrates that it is quite possible to design the steering system of a Quad bike to produce the recommended handling results for a work place environment. 2. Most Quad bikes had a fixed rear differential, which meant that the rear wheels rotated in unison, even when on a curve. Most SSVs that had an open differential (or the option to switch from an open to fixed differential and vice versa), all exhibited light understeer handling characteristics. When the rear differential was locked, the vehicle demonstrated oversteer characteristics.
19
As set out in Part 2: Dynamic Handling Test Results
44
Final Project Summary Report: Quad Bike Performance Project Test Results, Conclusions and Recommendations
45
6.4 Test Results - Lateral Transient Response Time All vehicles tested unloaded on asphalt had steering response times of less than 0.3 seconds, with a significant number of the vehicles displaying steering response times of less than 0.2 seconds (see Figure 11), which is generally considered to be satisfactory. Lateral transient response tests - Average Lateral transient response time (s) 0.35
Lateral transient response time (s)
0.30
0.25
0.20
0.15
0.10
0.05
X7 00 XX
Ra pt or
TR
2
S9 0X
25 0R
YF M
D
TM
V7 00 M U
V8 25 i
re d
XU
at or G
Left
Bi g
TV 50 0 R
70 0 R
hi no
F5 00 C
X5 00 FM 45 0F AP Sp G riz or zly ts m an 45 Ki 0H ng O qu ad 40 0A SI KV F3 00 M XU 30 0 YF M
TR
TR
X2 50
0.00
Right
Figure 11: Average steering response time - unladen vehicles on asphalt.
6.5 Test Results - Bump Obstacle Test Twelve Quad bikes were subjected to the bump obstacle test (Figure 12) using the 95th % adult male Hybrid III ATD as well as subjective comparison tests with riders. The vehicles exhibited ATD pelvis lateral/vertical resultant acceleration values of between 1.47g and 3.66g. Quad bikes that exhibited lower resultant ATD pelvis acceleration typically showed little ATD movement relative to the seat of the Quad bike. Quad bikes that exhibited higher resultant ATD pelvis acceleration typically showed significant ATD movement relative to the seat of the Quad bike. The ‘bump tests’ identified, possibly for the first time, a significant mechanism in which Quad bike riders could potentially lose control in what appear to be low risk scenarios, going over moderate bumps (such as logs, small mounds, ruts, etc.) at the relatively low speed of 25 km/h. Where the rider who is not Actively Riding and remains sitting on the seat, and the Quad bike is displaced excessively laterally whilst traversing a ‘bump’, the rider could pull on the handle bar (to keep themselves on the quad bike) further exacerbating the turn of the Quad bike leading to rollover. All of the SSVs traversed the bump satisfactorily, with a low level of rider or vehicle perturbation.
Final Project Summary Report: Quad Bike Performance Project Test Results, Conclusions and Recommendations
Left side perturbation
1
4
2
5
3
6 Right side perturbation
Figure 12: Bump obstacle test, showing the lateral displacement of the Quad bike and rider/ ATD. Note in top frame rear left wheel is airborne as the Quad bike is turning left and if not arrested by the bungee cord, the Quad bike would have rolled over in the test.
46
Final Project Summary Report: Quad Bike Performance Project Test Results, Conclusions and Recommendations
7. CRASHWORTHINESS TESTS AND RESULTS 7.1 Background and Method The Part 3 Rollover Crashworthiness test program provides the third arm of the assessment and rating of these Quad bikes and SSVs for rollover stability, handling and crashworthiness. It complements the Static Stability tests and the Dynamic Handling tests for the 17 vehicles. The findings from Section 3 is that rollover, and subsequently being pinned and asphyxiated, often without injury, are the predominant injury mechanisms for Quad bike related fatalities on farms. These findings determined that the crashworthiness test program needed to be focussed on rollover of the Quad bikes and SSVs, with testing and ratings developed as presented below. The Rollover Crashworthiness test program consisted of 65 tests and SSV inspections focussing in three different areas, all relating to vehicle crashworthiness characteristics. A selection of the different tests carried out is shown in Figure 13. Crashworthiness is the ability of a vehicle to provide injury protection to its occupant(s) in a collision or rollover event. Details of the tests are provided in Part 3: Rollover Crashworthiness Test Results. Four different test series were carried out, namely: 1. Measurements of ground contact force for the Honda TRX500 with and without an OPD on its left and right side and when inverted The mass difference between different Quad bike models tested was considered by the Authors to be not sufficient to provide significant discrimination in terms of asphyxia potential; 2. Inspection and measurements of SSV occupant retention in accordance with the US National Standard for Recreational Off-Highway Vehicles ANSI/ROHVA 1-2011 with additional requirements applied; 3. Vehicle and rider/driver rollover tests consisting of positioning a Motorcycle Anthropomorphic Test Device (MATD) crash test dummy in the operator’s position of a Quad bike (Honda TRX500) or SSV (Tomcar and Yamaha Rhino), tilting the vehicle to an angle at which rollover would occur and releasing the vehicle to rollover to observe survival space and functionality of the OPD and in the case of the two SSVs the ROPS and restraints. 4. Side by Side Vehicle ROPS structure load tests consisting of applying a lateral load followed by a vertical load then a longitudinal load to the vehicle ROPS whilst recording the deflection and noting the structural integrity, in accordance with the United States (US) National Standard for Recreational Off-Highway Vehicles ANSI/ROHVA 1-2011 requirements for the ISO option. The characteristics determined from these tests, namely occupant survival space, contact loads, occupant containment, ROPS and seatbelts, can potentially reduce a driver’s/ rider’s
47
Final Project Summary Report: Quad Bike Performance Project Test Results, Conclusions and Recommendations
risk of harm in a rollover crash within the workplace environment for the higher rated vehicles. The crashworthiness ratings were then used together with the ratings detailed in reports ‘Part 1: Static Stability Test Results’ and ‘Part 2: Dynamic Handling Test Results’ to provide an overall Star Rating of the 16 production vehicles.
7.2 Rollover Crashworthiness of Quad Bikes 1. At the start of this project, the project team considered that it would be possible though challenging - to conduct testing which would distinguish between the rollover crashworthiness of different Quad bike models and SSVs. Through the exploratory rollover crashworthiness tests using the MATD as a surrogate vehicle operator, it became apparent (based on assumed test variability and the similarity of most Quad bikes) that it was currently unrealistic to discriminate the rollover crashworthiness between different Quad bike models, based on such rollover testing – however discrimination between these vehicle types (Quad bikes and SSVs) was realistic. In considering this, it was also recognised that there was little that differentiated the Quad bike models in terms of ground plane clearance in a rollover, and vehicle mass might be the only substantial difference among Quad bikes. The exploratory tests did highlight the potential hazards that an operator would be exposed to when a Quad bike rolled, which were consistent with the review of fatal cases. 2. Further, it was also evident from such rollover testing that for a rider of Quad bikes, due to the stochastic (‘hit and miss’) nature of severe injury risk and the large range of possible rollover permutations, it was unrealistic to continue with such tests for each Quad bike model for rating purposes. 3. Indeed, it was concluded by the Authors that the term “Crashworthy Quad bike” was essentially a contradiction in terms. For this reason the Quad bike types were all rated equally for rollover crashworthiness, and all were assigned the 5 point baseline rating when assessing Rollover Crashworthiness protection. There are numerous instances where a rider has survived a rollover crash without any serious injury as illustrated by Van Ee et al. (2012). Fundamentally, Quad bikes where the rider straddles the vehicle and steers in the same way as a motorcycle via handle bars, do not and cannot satisfy the well-known principles of occupant protection in rollover - good containment, restraint of the occupant, impact management and crush prevention. The manufacturers’ and industries’ safety paradigm for Quad bikes is ‘separation’ and Personal Protection Equipment (PPE), as with motorcycles. This strategy appears to work in a large number of instances albeit not in all the circumstances as evidence from the Coronial fatalities and hospitalisations data clearly demonstrate. 8 Industries’ ‘separation’ safety paradigm for Quad bikes is not capable of meeting the ‘Vision Zero’ criteria required/ legislated in the workplace, i.e. death or serious injury that results in a permanent disability in the workplace are not acceptable. Note however that death or
48
Final Project Summary Report: Quad Bike Performance Project Test Results, Conclusions and Recommendations
serious injury that results in a permanent disability currently continues to occur with virtually all vehicles used in the workplace (i.e., trucks, tractors, machinery, passenger cars, motorcycles, etc.). However, as has been well established that the rate of fatalities for these other vehicle types (including tractors) has decreased greatly due to advances in vehicle design, crash avoidance technology and crashworthiness amongst other factors. 4. Nor was it possible to discriminate Quad bike crashworthiness performance based on current real world crash information (in contrast to passenger vehicles, for example). This is due to the absence of make/model/year (MMY) crash involvement injury data and exposure data for Quad bikes and SSVs. This fundamental deficiency with data collection for Quad bikes (and SSVs) is still an impediment to advancing Quad bike safety. For Quad bikes, this leaves rollover crash prevention as the primary control mechanism to prevent injury in rollover, with the fitment of OPDs seen by safety stakeholders as a secondary measure that could reduce injury risk in the workplace. As with motorcycles, the safety crashworthiness basis for Quad bikes promoted by Industry is separation. It needs to be recognised that Quad bike riders are in this same category of ‘unprotected vulnerable road users’ where the risk of injury is substantially higher than when contained in a vehicle with appropriate rollover and restraint protection. Similarly if increased crash protection is a key performance requirement then, as with motorcycles, different vehicle types which offer such protection as part of their design need to be considered and substituted instead (e.g. SSVs).
7.3 Rollover Crashworthiness of SSVs 1. In contrast to Quad bikes, the SSVs do adhere in general to rollover crashworthiness principles, in that they are fitted with ROPS, seatbelts and various degrees of containment measures. As the effectiveness of such designs in terms of severe injury prevention can vary widely, it is possible to discriminate and rate SSVs, as a first step. 2. The SSVS were rated for rollover crashworthiness against the containment, occupant retention and ROPS requirements of the ANSI/ROHVA 1-2011 Industry voluntary standard for SSVS (which becomes relevant in the USA for 2014 models). 3. SSVs with a well-designed rollover protection system provide greater potential rollover crashworthiness in comparison to Quad bikes even when the Quad bikes are fitted with an OPD. This is on the condition that SSV drivers and passengers are restrained with an appropriate seat belt, namely a 3 point lap sash belt or a 4 or 5 point harness, and wear an approved helmet. 4. The SSV ROPS for three vehicles met the US ANSI/ROHVA 1-2011 Industry voluntary standard. The Honda Big Red, while not meeting all the ROPS load requirements of the standard, did meet the lateral load requirement and 88% of the vertical load before the ROPS could no longer sustain any increase in load. It was subsequently discovered that
49
Final Project Summary Report: Quad Bike Performance Project Test Results, Conclusions and Recommendations
the Honda Big Red met the US OSHA standard (Code of Federal Regulations) which requires a ROPS Strength to Weight Ratio (SWR) of only 1.5, which has been found by the Authors and others to be totally inadequate for occupant protection in rollover in regards to passenger vehicles (Young and Grzebieta, 2010; Brumbelow et al, 2009; Brumbelow and Teoh, 2009). 5. All five SSVs had seat belts fitted. The Tomcar offered 4 point harness seat belts whereas the Kubota only offered 2 point seat belts. The John Deere offered a seat belt warning light which extinguished when the seat belt was engaged, but only on the driver side. The Yamaha Rhino also offered a seat belt warning light but did not switch off when the seat belt was engaged. None of the SSVs offered an audible seat belt warning system or a seat belt interlock system.
7.4 Effectiveness of Operator Protective Devices (OPDs) 1. Retrofitting an OPD has been encouraged by a number of Quad bike safety stakeholders and is currently being considered by regulators. The rollover crash tests with the Honda TRX500 indicate that such devices do increase survivability and ‘crawl out’ space (clearance) and change crush loads applied to the operator under certain rollover circumstances. The baseline rollover crash tests demonstrated how the full weight of the Quad bike without an OPD could rest on top of the rider in lateral, rearward and forward pitch rolls, whereas when the vehicle was fitted with an OPD the vehicle’s full weight did not load or rest on the rider. The OPD may offer the conscious operator or rescuer an opportunity to self-extract (crawl out) or extract the pinned operator by increasing survival space when the vehicle is in an inverted position. 2. The performance of the Quadbar in terms of rollover crash harm minimisation appeared better in some aspects to the Lifeguard in a low velocity, low height, rearward pitch roll. When the Quad bike was pitched rearward from a higher height of 1,500 mm (measured from the lower edge of the tilt table) the Quadbar deformed such that it reduced the CoG rising and thus to some extent alleviated the situation presented by Van Ee et al. (2012) (see Figure 6 in ‘Part 3: Rollover Crashworthiness Test Results’), while at the same time providing survival/ crawl out space and maintaining the rear of the vehicle above the rider. 3. In the Quad bike tests, the rider was at risk of neck and head injuries in the lateral and forward pitch direction rollover tests. The Coronial data has revealed that seven farm workers received cervical spine fractures or dislocations and three farmers had cervical spinal cord injury. There were two thoraco-lumbar vertebral fractures. There were no lumbar or thoracic spinal cord injuries. 4. There is a concern that the Quadbar may impart a load to the head, neck, or back similar to the scenario hypothesised by Van Ee et al. (2012) and depicted in Figure 4 ‘Part 3: Rollover Crashworthiness Test Results’. Figure 14 top right frame shows the Quad bar was close to the ATD’s head and neck in its final rest position. There was also
50
Final Project Summary Report: Quad Bike Performance Project Test Results, Conclusions and Recommendations
a concern with the Lifeguard OPD in a rearward pitch roll, where it was identified that the rider’s posterior could move backwards into the hollow part of the OPD entrapping them during the pitch over. This is demonstrated in Figure 11 a) in the ‘Part 3: Rollover Crashworthiness Test Results’ report. 5. For the Quad bikes, the contact ground load tests for the Quad bike on its side or upside-down, showed that point loads on a person under the Quad bike, would exceed the mechanical asphyxia load criterion of 50kg (McIntosh and Patton, 2014c), with and without OPDs. However, OPDs would likely reduce the risk due to increasing survival space underneath the Quad bike for the inverted position, but not for a Quad bike on its side. 6. Overall, the Authors consider that the addition of an OPD will likely result in a net benefit in terms of reducing harm to workplace Quad bike riders involved in a rollover crash. This is based on the assumptions that (i) Quad bike overturns in the workplace environment typically occur at low speeds; (ii) based on the limited testing presented in the Part 3 report, and (iii) the Authors are currently unaware of any injuries from OPDs that have occurred in the field. The important qualifiers here are: a.
A ‘fitness for purpose assessment’ be carried out first and the opportunity to substitute a well-designed SSV, for example, for a Quad bike should be considered. If an SSV is not ‘Fit For Purpose’, then an OPD is an engineering control that may improve Quad bike safety in the workplace.
b. In some crash events such OPDs could result in injury – rather than prevent it; c.
It is essential that close monitoring and ongoing evaluation of the field performance of OPDs is required.
d. Improved, more in-depth and uniform Quad bike and SSV accident data collection forms and procedures be put in place at state and federal levels, to enable monitoring of the relevant details of Quad bike and SSV incidents, including OPD and ROPS/ seat belt effects (both positive and negative).
7.5 The Rollover Crashworthiness Ratings These provide a points rating out of a maximum of 25 points, of the Author’s assessment of the rollover crashworthiness of the tested vehicles for the workplace environment, based on the rollover tests, evaluation against the ANSI/ROHVA standard and fundamental crashworthiness principles of rider/occupant protection in rollovers. 1. The SSVs all have notably higher overall rating (see Table 9 and Figure 18) with points from 15 to 21, with the Tomcar and John Deere receiving the highest rating, compared with 5 points for both the ‘workplace’ Quad bikes and ‘recreational’ Quad bikes.
51
Final Project Summary Report: Quad Bike Performance Project Test Results, Conclusions and Recommendations
2. In regards to the Quad bikes, the maximum rating these vehicles can potentially receive is an index of 5 if the straddle position is maintained in regards to the design of the vehicle and no rider protection is fitted to the vehicles, i.e. a ROPS. The work Quad bikes were all indexed at 5 points. 3. In contrast to the Quad bikes, well designed SSVs offer superior rollover crash protection in a typical farming environment, i.e. they are fitted with ROPS, seatbelts and various degrees of containment measures which combine to keep the occupants within a protected space. This is provided that three point (or harness) seatbelts and helmets are worn and other occupant lateral restraints are fitted and are in place. 4. The results from the rollover crashworthiness tests provide sufficient discrimination in the range of vehicles tested (Quad bikes and SSVs) to use as a basis for the rollover safety rating system. 5. The real-world validation and ongoing improvement and refinement of such ratings and Quad bike and SSV safety design, will further depend on the ongoing, proper, systematic collection of real world crash data involving Quad bikes and SSVs, including MMY and exposure data.
Figure 13: Examples of: 1. (top left) Quad bike contact force tests using load scales; 2. (top right) Side-by-Side Vehicle occupant retention; 3. (bottom left) SSV Roll-Over Protective Structure (ROPS) lateral pull test; and 4. (bottom right) Rollover test with occupant and Lifeguard OPD.
52
Final Project Summary Report: Quad Bike Performance Project Test Results, Conclusions and Recommendations
Quadbar
Forward pitch with Quadbar
Lateral roll without OPD
Quadbar
Lifeguard
Lateralroll rollwith without (top) and Lateral Lifeguard OPD with Lifeguard (bottom)
Lateral roll with Quadbar
Forward pitch roll - No OPD Figure 14: Examples of Quad bike lateral rollover and forward pitch tests with and without OPDs. For more details see ‘Part 3: Rollover Crashworthiness Test Results’ report.
53
Final Project Summary Report: Quad Bike Performance Project Test Results, Conclusions and Recommendations
8. ATVAP: THE AUSTRALIAN TERRAIN PROGRAM AND STAR RATINGS
VEHICLE
ASSESSMENT
The following sections summarise the rating method and rating points for each of the three test categories, followed by the final Australian Terrain Vehicle Assessment Program (ATVAP) Star Rating for the 16 production test vehicles. The Star Rating is the sum of the points for the three tests, with 25 points each, and maximum of 75 points, plus up to 10 bonus points, giving a total of 85 points, as follows: Static Stability Dynamic Handling Crashworthiness Total Points
= 25 points = 25 points = 25 points = 75 Points
Plus Bonus Points:
(improved dynamic handling for Quad bikes and SSVs, and restraint assurance for SSVs)
Open differential (OD): Open differential (OD) on Start up: Seat belt interlock (SBI):
3pts. 5pts 5pts.
The Star Rating is based on five equal divisions of the 85 points: One STAR Two STARS Three STARS Four STARS Five STARS
= ≤ 17pts; = 18 to 34pts = 35 to 51pts; = 52 to 68 pts = 60 to 85pts
8.1 Static Stability Overall Rating Index for the 17 Test Vehicles 8.1.1 Basis of the Static Stability Overall Rating Index It is important to highlight that the Static Stability Overall Rating Index is a relative index which compares one vehicle with another. As such no one vehicle is being disadvantaged against another as the same criteria and weighting is applied to all vehicles. Preliminary parametric analyses of the effect of any weighting variations indicate that the relative Static Stability Overall Rating Index (of one vehicle compared with another) is relatively insensitive to such variations. The stability indices are firstly based on the TTR values for each of three tilt test directions, by summing and then averaging the TTR values for each loading combination within those test directions: 1. Lateral Roll 2. Forward Pitch 3. Rear Pitch
54
Final Project Summary Report: Quad Bike Performance Project Test Results, Conclusions and Recommendations
The final Static Stability Overall Rating Index for each vehicle is then derived from weighted average TTR values for each of the three test directions, as will be described subsequently. Two different final Static Stability Overall Rating Index systems are considered. i.
Static Stability Overall Rating Index - System 1: For vehicles carrying loads as well as the operator(s).20 This Index enables the 14 vehicles that can carry loads: the 8 workplace Quad bikes, 1 prototype Quad bike and 5 SSVs, to be compared. It uses the baseline TTR (i.e. unloaded and no rider) plus the TTR with the large rider or driver, plus the TTRs for all maximum load combinations.
ii.
Static Stability Overall Rating Index - System 2: For vehicles with rider/ driver only, no other loads being carried. This Index enables Static Stability Ratings to be compared for all the 17 vehicles if they are just being used to travel between locations (and not for load carrying). It uses the baseline TTR (i.e. unloaded and no rider) plus the TTR with the large rider or driver
8.1.1.1 Assumed risk exposure It is important to note that the baseline TTR is also used in the Static Stability Overall Rating Index as its inclusion reflects for the Quad bikes, that the TTR with a rider will range somewhere between the baseline alone and baseline plus larger rider condition. This is because the tests were conducted for the heavier 95th % adult male rider weight, and with lighter riders the TTR will be higher in most cases. It also reflects some effect of Active Riding on Quad bikes in some situations, which through body weight shift in position, could move the TTR to some degree towards the higher baseline value. Furthermore, by also using all of the TTR maximum load combinations, with the base line TTR and the baseline plus operator TTR, this reflects a measure of exposure for the vehicle usage. That is, implicit in this method of analysis, i.e. the exposure for each vehicle type is assumed to be approximately: Assumed Risk Exposure time for Static Stability Overall Rating Index - System 1: Assumed risk exposure time for Work Quad bikes: o o o o o
20% with lighter rider or some form of Active Riding; 20% with heavy rider; 20% with heavy rider plus full front load; 20% with heavy rider plus full rear load; 20% with heavy rider plus full front and rear load;
Risk exposure time for SSVs o 33% of with lighter driver; o 33% of with heavy driver; o 33% of with heavy driver plus full rear load; 20
All loads are maximum loads to the manufacturer’s specification. For ATD the 95th PAM ATD was used for all vehicles except for the Can-am DS90X youth model where 5th PAF ATD used.
55
Final Project Summary Report: Quad Bike Performance Project Test Results, Conclusions and Recommendations
56
Assumed Risk Exposure time for Static Stability Overall Rating Index - System 2: Assumed exposure time for Work Quad bikes and Sports/ Recreational Quad bikes: o 50% with lighter rider or some form of Active Riding; o 50% with heavy rider; Risk exposure time for SSVs o 50% of with lighter driver; o 50% of with heavy driver; Due to the very limited exposure data on Quad bikes and SSV usage in Australia, the Authors consider that the above usage distribution of weightings represents a reasonable allocation until such time that Australian exposure data becomes available. Moreover, variations of these weightings appear to not affect the relative rating of the Static Stability Overall Index. 8.1.1.2 Standardising the TTR values for the three test directions To provide similar relative magnitudes for the indices for each of the three test directions, each TTR value was normalised against a relatively high TTR value as follows: o Lateral Roll: Maximum Index for o Forward Pitch: Maximum Index for o Rearward Pitch: Maximum Index for
TTR =1.0. TTR =2.0. TTR =1.75.
Tan(45°) Tan (63.4°) Tan (60.2°)
= 1.0 = 2.0 = 1.75
Thus each TTR index value is adjusted by dividing by the relevant factor of 1.0, 2.0 and 1.75, respectively. These values are proposed by the Authors as benchmark reference values for lateral roll, forward pitch and rearward pitch respectively. These benchmark values were achieved (or nearly achieved) by those vehicles displaying the highest TTR stability measures, in some loading conditions. While these benchmark values could be argued as to basis, the Authors consider, based on all available information as discussed in this report and subject to further research and field evaluation, that they provide a reasonable starting point for desired stability value benchmarks. 8.1.1.3 Weighting of the Static Stability Overall Rating Index for roll direction incidence frequency To take into account the different relative incidence of lateral roll, forward pitch and rear pitch rollovers, a relative weighting of 2:1:1 was assigned. As there is very limited data to date from the Quad bike rollover incident databases on rollover direction, this was considered by the Authors as to be not sufficiently reliable to base the weighting factors on so simple exposure based weightings were used. The final Static Stability Overall Rating Index is determined by summing the normalised points for the three tilt-table test directions, but weighted in the ratio of 50% lateral roll, 25% forward pitch and 25% rear pitch. The Weighted Index has a maximum value21 of 20.
21
It is noted that where a test vehicle exceeds the normalising value of 1.0, 2.0 and 1.75 respectively, a slightly higher score than 20.0 can be achieved theoretically.
Final Project Summary Report: Quad Bike Performance Project Test Results, Conclusions and Recommendations
The weighting factors used at the most basic level are based on the geometric characteristics of the vehicles and reflect that lateral roll can occur in two directions (left and right) compared with one each for forward and rearward pitch. Hence, the relevant ratio of 2:1:1. Thus the Weighted Total Index points are calculated as follows: Weighted Total Index =
5 x (2 x Roll Index Normalised + Rear Pitch Index Normalised + Forward Pitch Index Normalised)
e.g. from Table 5, for the Honda MUV700 Big Red: Weighted Total Index =
5 x (2 x 0.84 + 0.76 + 0.98) = 17.1
8.1.2 The Static Stability Overall Rating Index for each vehicle The Static Stability Overall Rating Index - System 1 with loads, for the 8 workplace production Quad bikes and 5 SSVs is set out in Table 5 and Figure 15. The Sports/ Rec Quad bikes do not carry load and are included in System 2 (no loads). The Static Stability Overall Rating Index - System 2 no loads, for the 8 workplace production Quad bikes, 3 Sports/ Rec Quad bikes and the 5 SSVs is set out in Table 6 and Figure 16. Note that for the Final ATVAP Star Rating (Section 8.4), the respective Index values in Table 5 and Table 6 used are multiplied by 1.25 to result in a maximum value of 25 points. 8.1.3 Observations from the two Static Stability Overall Rating Index systems From these index results the following observations are made: 1. The Static Stability Overall Rating Index - System 1 (with loads) This Static Stability Overall Index is intended for vehicle stability comparison in the work environment or other uses where the vehicles carry loads as part of their usage. The SSVs all have notably higher Indices than the workplace Quad bikes, with Indices ranging from 15.3 to 17.1, compared with 9.7 to 11.3 for the workplace Quad bikes. 2. The Static Stability Overall Rating Index - System 2 (with rider but no loads) This Static Stability Overall Rating Index is intended for vehicle stability comparison in environments or other uses where the vehicles do not carry loads, but are used for travel or mobility work tasks only, e.g. herding cattle or sheep or accessing farm areas. The vehicle’s Indices are higher than those determined for Static Stability Overall Rating Index - System 1, as without loads stability is increased. The SSVs all have higher Indices than the workplace Quad bikes, with points ranging from 15.9 to 18.6, compared with 11.3 to 12.7 for the workplace Quad bikes. The prototype Quad bike would have received 14.8 points with operator only and 14.1 with load. This would have placed this vehicle just below the lowest SSV. This demonstrates that it is possible to increase the rollover resistance of the Quad bikes.
57
Final Project Summary Report: Quad Bike Performance Project Test Results, Conclusions and Recommendations Static Stability Overall Index- System 1 all loads
Type SSV SSV SSV SSV SSV Quad Quad Quad Quad Quad Quad Quad Quad
Roll
Rear Pitch
58
Forward Pitch
Index Index Index Normalised Normalised Normalised Make Model Honda MUV700 big red 0.84 0.76 0.98 Tomcar TM2 0.93 0.55 0.94 John Deere XUV825i 0.80 0.77 0.93 Kubota RTV500 0.76 0.64 0.97 Yamaha Rhino 0.71 0.72 0.91 CF Moto CF500 0.61 0.54 0.51 Polaris Sportsman 450HO 0.60 0.47 0.54 Suzuki Kingquad 400ASI 0.59 0.52 0.52 Honda TRX500FM 0.60 0.51 0.51 Honda TRX250 0.56 0.48 0.53 Yamaha YFM450FAP Grizzly 0.53 0.54 0.49 Kawasaki KVF300 0.56 0.49 0.49 Kymco MXU300 0.49 0.48 0.48
Total Index 2.57 2.42 2.50 2.36 2.35 1.65 1.62 1.63 1.62 1.58 1.57 1.53 1.45
Weighted Total Index 17.1 16.8 16.5 15.6 15.3 11.3 11.1 11.1 11.1 10.7 10.5 10.5 9.7 Max 20
Weighted Total Index = 5 x (2 x Roll + Rear Pitch + Forward Pitch)
Table 5: Static Stability Overall Rating Index, System 1- with maximum loads, for the 8 production work Quad bikes and 5 SSVs.
Figure 15: Bar chart showing the Static Stability Overall Rating Index, System 1- with maximum loads, for the 8 production work Quad bikes and 5 SSVs.
Final Project Summary Report: Quad Bike Performance Project Test Results, Conclusions and Recommendations Static Stability Overall Index System 2-no loads
Type SSV SSV SSV SSV SSV Quad Quad Quad Quad Quad Quad Quad Quad Quad Quad Quad
Make Honda John Deere Tomcar Kubota Yamaha Can-am Honda Yamaha Polaris Suzuki Honda Honda CF Moto Yamaha Kawasaki Kymco
Model MUV700 big red XUV825i TM2 RTV500 Rhino DS90X TRX700XX YFM250R Raptor Sportsman 450HO Kingquad 400ASI TRX250 TRX500FM CF500 YFM450FAP Grizzly KVF300 MXU300
Roll
Rear Pitch
59
Forward Pitch
Index Index Index Normalised Normalised Normalised 0.92 0.90 1.00 0.88 0.88 0.91 0.98 0.60 0.96 0.80 0.71 1.00 0.75 0.80 0.90 0.94 0.63 0.58 0.79 0.56 0.62 0.75 0.59 0.57 0.69 0.56 0.59 0.67 0.61 0.56 0.67 0.58 0.59 0.67 0.61 0.54 0.67 0.61 0.53 0.63 0.65 0.53 0.66 0.58 0.52 0.59 0.56 0.53
Total Index 2.81 2.68 2.55 2.51 2.44 2.16 1.98 1.91 1.84 1.85 1.84 1.83 1.81 1.81 1.76 1.68
Weighted Total Index 18.6 17.8 17.7 16.6 15.9 15.5 13.9 13.3 12.7 12.6 12.5 12.5 12.4 12.2 12.1 11.3 Max 20
Weighted Total Index = 5 x (2 x Roll + Rear Pitch + Forward Pitch)
Table 6: Static Stability Overall Rating Index, System 2- no loads, for 16 production vehicles.
Figure 16: Bar chart - Static Stability Overall Rating Index, System 2- no loads, for the 16 production vehicles.
Final Project Summary Report: Quad Bike Performance Project Test Results, Conclusions and Recommendations
60
8.2 Dynamic Handling Overall Rating Index for the 17 Test Vehicles The Dynamic Handling Overall Rating Index is the second of the three major test components of the ATVAP Star Rating system which takes into account the Static Stability Tests, Dynamic Handling Tests and Rollover Crashworthiness Tests. The proposed Dynamic Handling Overall Rating Index is based on the summation of the Index values from the following four dynamic test results with rider/ driver for each vehicle. 8.2.1 Points Ratings Each test was rated out of 5 points, with a total of 25 points, as set out in Table 7. 1. Steady-state circular driving behaviour dynamic tests - the limit of lateral acceleration, Ay (g) 2. Steady-state circular driving behaviour dynamic tests - scores either the understeer or oversteer characteristic.22 3. Lateral transient response dynamic tests - the steering response time. 4. Bump obstacle perturbation tests - the measured acceleration of the ATD pelvis. The total points for the Dynamic Handling Overall Rating Index (25) are the same to those calculated from the Static Stability Overall Rating Index (25). Criteria 1. Lateral Stability Ay (g) at tip up (no tip up = 3 pts) 2. Steady State turning -Transition to oversteer (g) 3. Steady State turning -Understeer Gradient (degree/g) 4. Steady State turning - Oversteer Gradient (degree/g) 5. Steering response time (s) 6. Bump Obstacle Response - Pelvis acceleration (g)
Points rating 3 4 0.6 to 0.79 0.8 to 0.99
1 1.0
0.1
0.2
0.3
0.4
0.5
≥8.0
8.0 to 6.0
5.9 to 4.0
3.9 to 3.0
0.49 to 3.0
≥ -8.0 Oversteer >0.5 >3.0
-7.9 to -4.0 Oversteer 0.4 to 0.5 2.0 to 3.0
-3.8 to -1.0 Oversteer 0.3 to 0.4 1.5 to 2.0
-0.99 to 0.5 Neutral 0.2 to 0.3 1.0 to 1.5
0.49 to 3.0 Understeer