Both centers used the Siemens. ACUSON S2000 ABVS (Erlangen, Germany). .... localization (paired t-test, p = 0.02). 4. CONCLUSION AND DISCUSSION.
Finding Lesion Correspondences in Different Views of Automated 3D Breast Ultrasound Tao Tana , Bram Platelb , Michael Hicksa , Ritse M. Manna , and Nico Karssemeijera a Radboud
University Nijmegen Medical Centre, Department of Radiology. b Fraunhofer MEVIS, Bremen. ABSTRACT
Screening with automated 3D breast ultrasound (ABUS) is gaining popularity. However, the acquisition of multiple views required to cover an entire breast makes radiologic reading time-consuming. Linking lesions across views can facilitate the reading process. In this paper, we propose a method to automatically predict the position of a lesion in the target ABUS views, given the location of the lesion in a source ABUS view. We combine features describing the lesion location with respect to the nipple, the transducer and the chestwall, with features describing lesion properties such as intensity, spiculation, blobness, contrast and lesion likelihood. By using a grid search strategy, the location of the lesion was predicted in the target view. Our method achieved an error of 15.64 mm±16.13 mm. The error is small enough to help locate the lesion with minor additional interaction. Keywords: automated 3D breast ultrasound, breast cancer, CAD, automated linkage
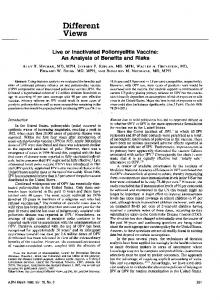
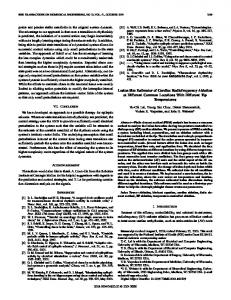
1. INTRODUCTION It is well known that the sensitivity of mammography is low in dense breasts. In mammograms of these women, small masses can be obscured by the dense fibroglandular tissue (Fig. 1).1 Schaefer et al.2 showed that by using handheld ultrasound together with mammography, 15.9 % extra cancers were found for the dense breasts and 12.8 % extra cancers were found for all breasts. Berg et al.3 showed that using ultrasound and mammography could reveal additional 1.1-7.2 cancers per 1000 high-risk women , with an increase of false positives. Automated 3D breast ultrasound (ABUS) is rapidly gaining popularity as a low cost adjunct screening modality for women who have dense breast tissue. Wenkel et al.4 show that using ABUS allows to achieve a high reliability of detection of solid and cystic lesions. Giuliano and Giuliano5 found that using automated 3D breast ultrasound (ABUS) together with mammography improved breast cancer detection rate, resulting 12.3 per 1000, compared to 4.6 per 1000 by mammography alone. In a reader study6 by Chang et al., using ABUS led to a significantly higher sensitivity for malignant lesions than for benign lesions. In 2012, the U.S. food and drug administration (FDA) approved the use of an ABUS system developed by U-systems (Sunnyvale, CA, USA) for breast cancer screening.
(a)
(b)
Figure 1. (a) ABUS image containing shows a small cancer with a diameter < 6 mm indicated by the cursor (coronal). (b) The corresponding mammogram in CC view in which the lesion is obscured by dense tissue.
Medical Imaging 2013: Computer-Aided Diagnosis, edited by Carol L. Novak, Stephen Aylward, Proc. of SPIE Vol. 8670, 86701N · © 2013 SPIE · CCC code: 1605-7422/13/$18 · doi: 10.1117/12.2007475
Proc. of SPIE Vol. 8670 86701N-1 Downloaded From: http://proceedings.spiedigitallibrary.org/ on 05/08/2013 Terms of Use: http://spiedl.org/terms
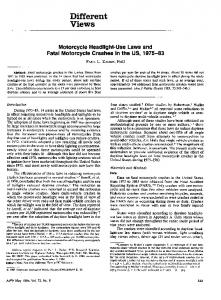
Depending on the breast size, usually up to as many as five 3D ABUS acquisitions (called views, Fig. 2) are taken per-breast, in order to image the entire volume. Radiological reading of such a large amount of image data is time consuming. Existing computer-aided detection (CAD) methods for ABUS7 can detect potential cancer regions and their suspiciousness levels to facilitate the reading process. These algorithms, however, do not link the detected regions across the different views of the same breast. To improve localization and detection performance of readers, and to facilitate the further use of the CAD, we propose a method that allows radiologists to locate potential abnormalities in other views (target images) when a lesion has already been pointed out by reader or CAD in the current view (source image). This method can also be used to provide the linkage of CAD regions in different views to improve overall CAD performance.
(a)
(b)
(c)
(d)
Figure 2. Coronal slices of the four most common views in ABUS: (a) anterior-posterior view, (b) medial view, (c) lateral view, and (d) superior view.
2. MATERIALS AND METHODS 2.1 Dataset The breast ultrasound images used in this study were obtained from the Radboud University Nijmegen Medical Centre (Nijmegen, The Netherlands) and the Jules Bordet Institute (Brussels, Belgium). Both centers used the Siemens ACUSON S2000 ABVS (Erlangen, Germany). Imaging involved a frontal compression by a dedicated membrane and a transducer (5.0 to 14.0 MHz) with a width of 15.4 cm. Each 3D volumetric view was generated with a minimal voxel size of 0.21 mm (along the transducer) by 0.07 mm (in depth direction) by 0.52 mm (along the sweeping direction). For processing, images were resampled to obtain 0.6 mm cubic voxels. For this study, we used a dataset containing ABUS images of 44 patients in which a lesion is visible in at least two views of the same breast. Corresponding lesions were annotated and manually linked as reference standard. Given the annotation of a lesion in one view, the task is to predict the position of the same lesion in the other view(s). We selected only the views in which lesions are visible. In total, this yielded 120 directional linkages between the lesions.
2.2 Methods A general approach to obtain correspondences between two images of the same object is by image registration. However, for this particular task, direct image registration is challenging. First, different ABUS views of the same breasts cover different parts of the breast and the small overlap and different coverages of different views would make registration less reliable. Secondly, due to large compressions in different directions during imaging, there is a large deformation between different views of the breast. In this paper, we do not intend to find all voxel correspondences between different views. We are only interested in finding lesion correspondences. Therefore, we do not use an image-registration approach. Instead, we try to find the point in the target image which is closest to the source point in a defined feature space.
Proc. of SPIE Vol. 8670 86701N-2 Downloaded From: http://proceedings.spiedigitallibrary.org/ on 05/08/2013 Terms of Use: http://spiedl.org/terms
1
(a)
(b)
(c)
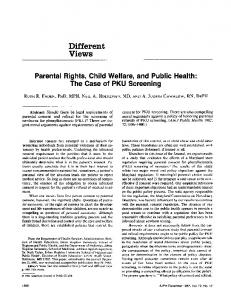
Figure 3. (a) a breast mask overlay in the coronal view, (b) nipple detection in the coronal view, (c) chestwall segmentation as overlay.
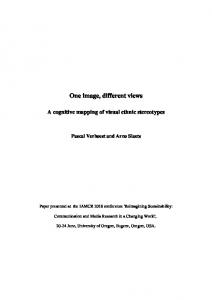
In order to restrict the predicted location to the breast tissue, segmentation of the breasts is necessary. A 3D breast mask was generated by performing Otsu’s thresholding followed by a morphological closing operation to fill holes inside the mask.8 When radiologists look for corresponding lesions in different views of the ABUS or between images from different modalities, they relate the position of the lesion to visible anatomical structures such as the skin of the breast, the nipple and the chestwall. To extract this information, the location of the nipple is automatically detected by using the Hough Circle Transform. This works well as the nipple in ABUS is visible as a dark circle in slices close to the transducer. The nipple location is used to compute contextual features for our algorithm. Furthermore, the chestwall is segmented using a cylinder model.9 Fig. 3 shows an example of the breast mask segmentation, nipple detection and chestwall segmentation. For each voxel within the breast mask, we compute position features using these landmarks and a set of local features to characterize lesions to find the corresponding lesions in two views. 2.2.1 Position Features Given the location of the nipple in the 2D coronal plane and the chestwall segmentation, for each voxel we can compute its coordinate x, y relative to the nipple position (x is in the direction parallel to the transducer and y is in the direction of the transducer motion), the distance to the nipple dn, and signed distance to the chestwall dc. We also incorporated depth (distance from the membrane, dp) as a position feature. 2.2.2 Local Features Each view is obtained by compression of the breast towards the chest under different orientations. Therefore, there is a large deformation between different views. Due to this deformation, the predictions would be inaccurate if linkage would be based solely on the nipple and chestwall locations. This is why besides using the location information obtained from the segmentation step, for each voxel we extracted intensity I, two spiculation features (sp1, sp2), two blobness features (b1, b2), two contrast features (c1,c2), and the likelihood of a voxel being part of a lesion (l) (Fig. 4) resulting from a CAD system.7 2.2.3 Location Prediction The prediction of the lesion location is based on similarities of computed features between voxels of the lesion in the source image and voxels in the target image. All features are normalized such that for the view at hand the distribution of each feature has a zero mean and unit standard deviation using all voxels in the source view within the breast mask. We used the center of the annotation and its 6 neighbors from the source image as source points. In the target image, we use a grid search that compares the Euclidean distance of each voxel to the source point in the feature space. The
Proc. of SPIE Vol. 8670 86701N-3 Downloaded From: http://proceedings.spiedigitallibrary.org/ on 05/08/2013 Terms of Use: http://spiedl.org/terms
(a)
C] (b)
Figure 4. Coronal sections of a right breast with a lesion (red contour) and lesion likelihood overlay in (a) anterior-posterior view and (b) medial view, where green represents areas of high likelihood.
(a)
(b)
Figure 5. (a) a lesion (red contour) in a source image. (b) the predicted position (orange circle) in a target image of the same breast.
matching voxel in the target image is the voxel with the smallest Euclidean distance to the source point. This results in 7 matching locations in the target image. The final location of the corresponding lesion is determined by the median location of these 7 points.
3. RESULTS We used the spatial distance in mm’s of the predicted location to the center of the annotated location of the target lesion as our performance measure. We analyzed this measure for all linked lesions in our dataset bidirectionally. Fig. 5 shows an example of such a prediction. We perform our method with and without local features. Fig. 6 shows the box plots of errors obtained by the two experiments. With only position features, our method obtained a mean error of 20.28 mm and a standard deviation of 13.42 mm. With all features included, our method obtained a mean error of 15.64 mm and a standard deviation of 16.13 mm. Fig. 7 also shows the cumulative histogram of the errors obtained by the two experiments. Using all features, it can be seen that about 73% of the predicted locations are less than 20 mm away from the actual lesion center. Adding local features to the position features significantly improved the localization (paired t-test, p = 0.02).
4. CONCLUSION AND DISCUSSION In this paper, we have presented a method to predict the position of a breast lesion in target ABUS views given the location of the lesion in a source ABUS view. We combined features describing the lesion location with respect to
Proc. of SPIE Vol. 8670 86701N-4 Downloaded From: http://proceedings.spiedigitallibrary.org/ on 05/08/2013 Terms of Use: http://spiedl.org/terms
(a)
(b)
Figure 6. (a) boxplot of errors using only position feature vector. (b) boxplot of errors using all features.
(a)
(b)
Figure 7. (a) cumulative histogram of errors using only postion feature vector. (b) cumulative histogram of errors using all features.
landmarks such as the nipple, the transducer and the chestwall, with features describing lesion properties such as intensity, spiculation, blobness, contrast, and likelihood of being a lesion. By using a grid search strategy, the location of the lesion was predicted in the target view. Our method achieved an error of 15.64 mm±16.13 mm. Considering that the average breast lesion radius is 9 mm,10 the error is likely small enough to help locate the lesion with minor additional interaction. The preliminary results are promising. The accuracy of the proposed method mainly depends on the accuracy of the nipple detection. Using other features characterizing lesions significantly improved the accuracy. In the future, we will improve the method by incorporating features extracted at the region level, i.e. the size of the region, acoustic posterior behavior, etc. With those region features, a further improvement is expected, and by using more advanced prediction methods using supervised learning we could weight the influence of the different features on the result. Moreover, using a biomechanical model11 of a breast to simulate the compressions of different views might also be helpful for the task.
Proc. of SPIE Vol. 8670 86701N-5 Downloaded From: http://proceedings.spiedigitallibrary.org/ on 05/08/2013 Terms of Use: http://spiedl.org/terms
REFERENCES 1. Marla R Lander and L´aszl´o Tab´ar. Automated 3-d breast ultrasound as a promising adjunctive screening tool for examining dense breast tissue. Semin Roentgenol, 46:302–308, 2011. 2. Fritz K W. Schaefer, A. Waldmann, A. Katalinic, C. Wefelnberg, M. Heller, W. Jonat, and I. Schreer. Influence of additional breast ultrasound on cancer detection in a cohort study for quality assurance in breast diagnosis– analysis of 102,577 diagnostic procedures. Eur J Radiol, 20:1085–1092, 2010. 3. W.A. Berg, J.D. Blume, J.B. Cormack, E.B. Mendelson, D. Lehrer, M. B¨ohm-V´elez, E.D. Pisano, R.A. Jong, W.P. Evans, M.J. Morton, M.C. Mahoney, L.H. Larsen, R.G. Barr, D.M. Farria, H.S. Marques, K. Boparai, and ACRIN 6666 Investigators . Combined screening with ultrasound and mammography vs mammography alone in women at elevated risk of breast cancer. JAMA, 299:2151–2163, 2008. 4. E. Wenkel, M. Heckmann, M. Heinrich, S. A. Schwab, M. Uder, R. Schulz-Wendtland, W. A. Bautz, and R. Janka. Automated breast ultrasound: lesion detection and bi-rads classification–a pilot study. Fortschr R¨ontgenstr, 180:804–808, 2008. 5. Vincenzo Giuliano and Concetta Giuliano. Improved breast cancer detection in asymptomatic women using 3d-automated breast ultrasound in mammographically dense breasts. Clin Imaging, 2012. 6. Jung Min Chang, Woo Kyung Moon, Nariya Cho, Jeong Seon Park, and Seung Ja Kim. Radiologists’ performance in the detection of benign and malignant masses with 3d automated breast ultrasound (abus). Eur J Radiol, 78:99–103, 2011. 7. Tao Tan, Bram Platel, Roel Mus, and Nico Karssemeijer. Detection of breast cancer in automated 3D breast ultrasound. In Medical Imaging, volume 8315 of Proceedings of the SPIE, pages 831505–1–831505–8, 2012. 8. T. Tan, B. Platel, H. Huisman, C. I. S´anchez, R. Mus, and N. Karssemeijer. Computer aided lesion diagnosis in automated 3D breast ultrasound using coronal spiculation. IEEE Trans Med Imaging, 31:1034–1042, 2012. 9. T. Tan, B. Platel, R. M. Mann, H. Huisman, and N. Karssemeijer. Chest wall segmentation in automated 3D breast ultrasound scans. Med Image Anal, 2013. 10. S. Timp, N. Karssemeijer, and J. Hendriks. Analysis of changes in masses using contrast and size measures. In IWDM ’02: Proceedings of the 6th international workshop on Digital Mammography, pages 240–242. SpringerVerlag, 2002. 11. Thomy Mertzanidou, John Hipwell, M Jorge Cardoso, Xiying Zhang, Christine Tanner, Sebastien Ourselin, Ulrich Bick, Henkjan Huisman, Nico Karssemeijer, and David Hawkes. MRI to x-ray mammography registration using a volume-preserving affine transformation. Med Image Anal, 16:966–975, 2012.
Proc. of SPIE Vol. 8670 86701N-6 Downloaded From: http://proceedings.spiedigitallibrary.org/ on 05/08/2013 Terms of Use: http://spiedl.org/terms