WWWatch: Watching the World in Different Views with Semantic Web Ekgarach Sumsiripong, Krissada Maleewong, Rachanee Ungrangsi, and Chutiporn Anutariya School of Technology, Shinawatra University 99 Moo 10 Bangtoey, Samkok, Pathum Thani, 12160 Thailand
[email protected], {krissada, rachanee, chutiporn}@shinawatra.ac.th
Abstract. This paper develops a Semantic Web application, namely WorldWideWatch or WWWatch, in short. By employment of Semantic Web technologies, WWWatch analyses and visualizes social networks between countries in the world from information extracted from online news archives. Such information is described using RDF/OWL ontology and stored in Sesame server. The social networks in this application are colored and shaded in order to represent relation polarities (i.e. positive, neutral and negative) and the confident levels of relationships among countries. Users can query social relationships of certain countries as well as related events occurred in the specified time period and display the results in different forms such as graphs and timeline diagrams. The polarities of relations are taken into account in the analysis of social networks. In addition, the proposed system can display the location of some world phenomena such as natural disasters and manifestations of global warming on a map with respect to user-specified time periods, regions and phenomenon.
1
Introduction
Existing social network applications [4, 6] mainly focus on structural information (e.g. centrality, closeness, betweenness, etc.) of unsigned binary graphs or valued graphs. This implies that the analysis only considers whether there exist any relations among subjects. However, in the real world, social relationships among subjects (such as people, animals, organizations, parties, countries etc.) can be more expressive. A relation between two subjects is positive when it is pleasant to both of them whereas a neutral relation implies that the subjects do not show what they are thinking about relationship. Alternatively, the neutral relation can mean no relationship. On the other hand, whenever subjects feel upset about each other, their relation will become negative. These introduce an attribute for social relationships, called Relation Polarity, which in nature changes over time. Another interesting attribute is Relation Confident Level. Since social relationships are implicit knowledge extracted from explicit documents. It is important to quantify how much a piece of information contributes to the relationship between a pair of subjects. Furthermore, it also depends on how many documents exist in the specified period of time.
To demonstrate the importance of these two attributes in social network analysis, WWWatch, a Semantic Web application, is developed in this work and the online prototype system can be found at: http://ict.shinawatra.ac.th:8080/wwwatch. WWWatch enables users to visualize social networks of countries in the world based on information extracted from various online news archives. Colors and shades are employed to illustrate the relation polarity and the relation confident level, respectively. The relation polarity is determined based on reference emotion dictionaries. Users are able to query by countries and time period. They can view resultant social networks as either graph or timeline diagram along with the analysis. It is important to emphasize that the social networks shown in the application are for demonstration purposes only. To reflect actual relations, significant amount of reliable documents and more comprehensive emotion-extraction techniques are required. In addition, the proposed application can display the location of world phenomena such as disasters and manifestations of global warming on a map with respect to user-specified time periods, regions and phenomenon. The information about the occurrences of phenomenon is also gathered from the online news archives. This demonstration aims to warn people about the climate changes and motivate a movement to treat the world better by means of Semantic Web technologies. The paper is organized as follows: Section 2 introduces WWWatch System via a running example. Section 3 describes the proposed system architecture, details its components and discusses implementation issues. Finally, the conclusions and direction for future research are presented.
2
WWWatch: A Running Example
This section demonstrates WWWatch by means of an example. Suppose that a user wants to retrieve social relationships between Thailand and Singapore of the year 1997 and those of the year 2006. Furthermore, he/she is interested to see the changes in the world’s climates in the same period. WWWatch allows users to visualize knowledge in three domain areas including (i) country social network, (ii) timeline of the relationship, and (iii) world phenomena geographic. 2.1
Country Social Network
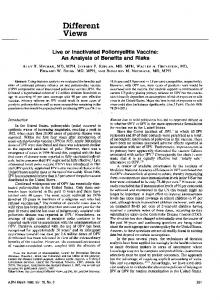
Figure 1 shows example of country social network of Thailand in year 2006. After the user has submitted a search by specifying a country name with a particular period, the system returns a summary page of the selected country to demonstrate a network model as a graph, including social network information. The graph consists of vertices and edges. Vertices represent entities that are country, and edges connected to vertices represent relationships among the entities that the vertices represent. The system allows users to explore the network in three different views including a signed graph, the graph with only positive edges, as well as the graph with only negative edges.
Colors are used to represent relation polarity, i.e., edges in green means a positive sign, while those in red implies a negative one. Moreover, the system can show the relation confident level using color shading. The darker the edge color, the stronger the relationships; on the other hand, the lighter the color, the weaker the relationships. A user can additionally view labels of edge weights for more precise information. Such exploration and visualization can be part of a sociological study. Note that section 3 discusses more details of the edge analysis.
Fig. 1. WWWatch’s Country Social Network of Thailand in year 2006 2.2
Timeline of the Relationship
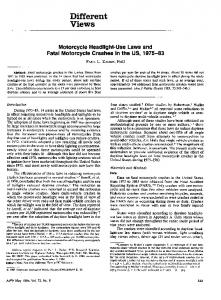
Fig. 2. WWWatch’s Timeline Diagram Showing Status of Relationships and related Events Between Thailand and Singapore
The timeline diagram aims to reflect the relationships of two specified countries over the past ten years (1997-2006) along with the related news articles. Figure 2 illustrates the results from querying the relationship between Thailand and Singapore. By referring to the available emotional dictionaries, if a news article implies positive (resp. negative) relationship, its bullet becomes green (resp. red). However, if it is
neutral, it will be represented by a yellow bullet. Furthermore, the user can view news description by clicking on the bullet and the hyperlink to the news source is also available for exploring further details. The background color represents the overall relationship between the two countries based on those news items. If the background color is closer to green, it indicates that a stronger positive relationship between those two countries. On the other hand, if the background color is closer to red, it implies the stronger negative relationship. The result also shows that the status of relationships between Thailand and Singapore are varied over time. The methodology of news and relationship analysis is explained in Section 3.
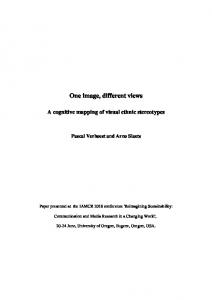
Fig. 3. World Phenomena Geographic and Examples of Map Area Projections
2.3
World Phenomena Geographic
Figure 3 illustrates the interface of map applet, comprising seven components as follows: (1) Menu, (2) Mouse Mode Panel, (3) Control Panel, (4) Map Area, (5) Position, (6) InfoText, and (7) Map Layer. The first three components allow users to set mouse mode, set map background color, navigate map area, project the map area, and display map layers. Some examples of map projections available in this applet are also shown in Fig.3. The fifth component of the applet shows the position of the selected location on the map in latitude/longitude and x-y coordinates whereas the InfoText displays the related information of the selected graphic components on the map. Finally, the Map Layer displays current enabled layers on the map. In WWWatch, after the user submits a selected type of phenomena and year and enable disaster layer, the icons indicating the number of occurrences for the specified phenomenon at each country are shown. By clicking the icon, the InfoText will display when such phenomenon happened at the pointing location.
3
WWWatch: System Architecture
Figure 4 illustrates WWWatch’s system architecture which comprises three layers (from bottom to top): i) data acquisition layer, ii) metadata refinement layer, and iii) visualization layer. The following subsections will explain these layers in order.
Fig. 4. WWWatch System Architecture
3.1
Data Acquisition Layer
In general, any online Web documents with URIs can be used as knowledge resources for the proposed application. In this prototype, two different types of resources are used: HTML pages from Google News Archive [10] and RSS pages from Yahoo! News and Google News [10, 15]. For Google News Archive, a few of Web mining techniques are employed whereas SAX Parser is used for parsing RSS files. Extracted information is described in RDF/OWL ontology and stored in SESAME [3, 13] database. The RDF database comprises news items which are related to the following 10 countries: Afghanistan, Australia, China, France, Japan, Iran, Thailand, Singapore, South Korea, and the United States. For each pair of these countries, top 100 news results that both countries co-occurred in each year between 1997 and 2007 are collected. Another dataset is created by collecting top 100 news results that a natural phenomenon and the specified country name co-occurred. In this application, nine types of natural phenomena are selected, such as, earth quake, tsunami, wildfire, heat wave, hurricane, drought, flood, disease spreading, and high-temperature weather.
3.2
Metadata Refinement Layer
This layer concerns geographic lookup, temporal lookup, and relationship reasoning and social network clustering. This section mainly focuses analyzing collected data to determine relation polarity and relation confident level between countries. Relation polarity aims to measure an emotional valence hidden in the existing relationship whereas relation confident level indicates how much a user can be confident about the discovered relationship. Both attributes can be measured by Relation Confident Level with Polarity (RCLP) which will be explained in this section. In this work, emotional valence of a word is simply categorized into 3 types: positive (+), negative (-) and neutral (0). In order to classify emotional valence of a news article, emotional dictionaries are a mandatory component. A few research works in emotional text analysis have been proposed [1, 5, 7, and 8] and they built their own emotional dictionaries. However, none of them provides a publicaccessible emotional dictionary. Therefore, in this work, an emotional literacy database has been created by extracting information from the following sources: ! Emotional Literacy and Dictionary (as retrieved on June 10, 2007): [http://encyclopediaoftheself.com/emotional-literacy-dictionaryvocabulary.shtml] ! The Compass DeRose Guide to Emotion Words (as retrieved on June 10, 2007): [http://www.derose.net/steve/resources/emotionwords/ewords.html] Based on the emotional dictionaries, if a word implies negative meaning, its emotionalValenceScore will be set to -1, whereas one with positive meaning results in the score of +1. To analyze the emotional valence score of a news article, partial keyword matching algorithm is employed to match emotional words in the dictionary with the news title and description. By default, the article is assumed to be neutral (0). If it contains positive words more than negative words, its cumulative emotionalValenceScore will be greater than zero which implies that this news sounds positive (+1). On the other hand, if it has more negative words, its cumulative emotionalValenceScore will be less than zero and its polarity is -1. In addition, if the numbers of positive words and negative words are tie or none of these words appears in the news article, the news polarity remains zero. Since the relationship is computed from any Web resources, the quality of information becomes crucial to indicate the reliability of such relationship. Hence, in this application, the number of related news articles to the focused news article is used as the key quality measure. Thus, the relation confident level with polarity can be computed as follow: Let NDB(p,q) = {n1,n2,…,nm} be the news collection comprising m news articles that contain both countries p and q and R(ni) be the number of related news articles of a news article ni. The relation confident level with polarity between the countries p and q with respect to an emotional dictionary EDB is: m
RCLP ( p, q, EDB ) #
$ emotionalValenceScore(n , EDB) * R(n ) i
i #1
m
$ R(n ) i #1
i
i
, where ni " NDB ( p, q )
The confident level of a relation is always |RCPL|. However, if RCLP > 0, it indicates that the relation between p and q is positive whereas if RCPL < 0, it implies negative relation. In addition, RCPL = 0 means neutral relationship or no tie between these two countries. 3.3
Visualization Layer
With an emphasis on ease of use and installation, WWWatch system is designed to be implemented as a Java Web application based on the client-server model. The clientside employs Java Applets to create the interaction part embedded in HTML pages for users browsing. On the server-side, a Java Server Page (JSP) and servlets are used to create the system applications that hide the complexity of services. Furthermore, the application exploits a variety of Semantic Web technologies to provide various graphical models as follow: ! Country Social Network: In order to represent a country network model as a graph, the system employs the service of JUNG (JAVA Universal Network/Graph) [9] programming toolkit, a JAVA based software library developed for data manipulation, analysis, and visualization. Relation Confident Level with Polarity (RCLP) is used to calculate weights for edges in the graph and their color shades as shown earlier in Fig. 1. Users are allowed to query data by country and year. ! Timeline of Relationship: Simile’s Timeline [14] is selected as a tool to visualize news articles related to two specified countries over the past ten years. It is a powerful DHTML-based AJAX widget for creating dynamic explorable timeline. To illustrate emotional valence of news and relationships, background color of the timeline and colored bullets are used. In this interface, users have to provide two country names and year. Since only the news headlines are shown, to see more description, users may click on its bullet. Due to large number of news items, viewing timeline of relationship on the Web can be significantly slow. ! World Phenomena Geographic: An open source JavaBeans toolkit, namely BBN’s OpenMap [12], is employed in this visualization. Several useful features of such toolkit enable users to add, remove and change the positioning of different components and layers and to freely navigate over the map. However, it consumes a significant number of resources and may take several minutes to display over the Internet.
4
Conclusions and Future Work
WWWatch is a Semantic Web application designed for visualizing social networks of countries in the world from information extracted from online news archives. To illustrate the polarity and confident level of relations among countries, colors and shades are used and users are able to search and display results in various formats such as graphs and timeline diagrams. In addition, the proposed system can display the locations of natural phenomena on a map based on user-specified periods and disaster types. WWWatch development is in progress with continuing enhancement.
Currently the prototype system’s database comprises data of only 10 selected countries; collection of more countries in the world is under way. More features will be added to the system in order to improve the quality of results and facilitate user search activities such as adding more criteria for user to query relationships and phenomena, optimizing the applet to speed up downloading time, improving emotional dictionaries and news mining techniques to increase precision and providing more results from social network analysis.
References 1. 2. 3. 4. 5. 6. 7. 8. 9. 10. 11. 12. 13. 14. 15.
A. C. Boucouvalas, Z. Xu and D. John, Expressive Image Generator for an Emotion Extraction Engine, in Proc. of 17th HCI 2003, University of Bath, UK, 8-12 September 2003, Session 4, Track 2 Emotions and Computers, pp. 367-381. D. Brickley, R.V. Guha, (2000). Resource Description Framework (RDF) Schema Specification 1.0. Candidate recommendation, World Wide Web Consortium, from World Wide Web Consortium.Web site: http://www.w3.org/TR/2000/CR-rdf-schema-20000327 J. Broekstra, A. Kampman, and F. Harmelen (2002). Sesame: A Generic Architecture for Storing and Querying RDF and RDF Schema. The 1st International Workshop on Practical and Scalable Semantic Systems, pp 54-56. P. Mika, “Flink: Semantic Web Technology for the Extraction and Analysis of Social Networks,” J. Web Semantics, vol. 3, no. 2, 2005, pp. 211–223. A. Osherenko, Affect Sensing using Lexical Means: Comparison of a Corpus with Movie Reviews and a Corpus with Natural Language Dialogues, in Proc. of the Workshop on Emotional Corpora (LREC 2006), May 2006. N. Shadbolt et al., "CS AKTive Space: Representing Computer Science in the Semantic Web," submitted to Proc. 2004 World Wide Web Conf., ACM Press, 2004. F.Sugimoto and M. Yoneyama, A Method for Classifying Emtion of Text based on Emotional Dictionaries for Emotional Reading, in Proc. of the IASTED Int’l Conf. on Artificial Intelligence and Applications, Austria, 2006. Z. Xu, D. John and A. C. Boucouvalas, Emotion Extraction Engine: Expressive Image Generator, In Proc. of EUROMEDIA 2003: 14-16 April 2003, Plymouth Univ. UK, pp. 23-28. JUNG. Retrieved June 10, 2007, from SourceForce.Net. Web site: http://jung.sourceforge.net/ Google News, Retrieved June 10, 2007,: http://news.google.com/?output=rss Google News Achieve, Retrieved June 10, 2007,: http://news.google.com/archivesearch OpenMap, Retrieved June 1, 2007: http://openmap.bbn.com/ Sesame, Retrieved June 1, 2007: http://www.openrdf.org/ Simile Timeline, Retrieved June 1, 2007: http://simile.mit.edu/timeline/ Yahoo News Achieve, Retrieved June 1, 2007: http://news.search.yahoo.com/news/rss