Finding Rough Set Reducts with Ant Colony Optimization. Richard Jensen and Qiang Shen. Center for Intelligent Systems and their Applications. School of ...
Finding Rough Set Reducts with Ant Colony Optimization Richard Jensen and Qiang Shen Center for Intelligent Systems and their Applications School of Informatics The University of Edinburgh {richjens,qiangs}@dai.ed.ac.uk
Abstract Feature selection refers to the problem of selecting those input features that are most predictive of a given outcome; a problem encountered in many areas such as machine learning, pattern recognition and signal processing. In particular, this has found successful application in tasks that involve datasets containing huge numbers of features (in the order of tens of thousands), which would be impossible to process further. Recent examples include text processing and web content classification. Rough set theory has been used as such a dataset preprocessor with much success, but current methods are inadequate at finding minimal reductions. This paper proposes a new feature selection mechanism based on Ant Colony Optimization to combat this difficulty. It also presents a new entropybased modification of the original rough set-based approach. These are applied to the problem of finding minimal rough set reducts, and evaluated experimentally.
1
Introduction
The main aim of feature selection (FS) is to determine a minimal feature subset from a problem domain while retaining a suitably high accuracy in representing the original features. In real world problems FS is a must due to the abundance of noisy, irrelevant or misleading features. For instance, by removing these factors, learning from data techniques can benefit greatly. Given a feature set size n, the task of FS can be seen as a search for an “optimal” feature subset through the competing 2n candidate subsets. The definition of what an optimal subset is may vary depending on the problem to be solved. Although an exhaustive method may be used for this purpose, this is quite impractical for most datasets.
Usually FS algorithms involve heuristic or random search strategies in an attempt to avoid this prohibitive complexity. However, the degree of optimality of the final feature subset is often reduced. Swarm Intelligence (SI) is the property of a system whereby the collective behaviours of simple agents interacting locally with their environment cause coherent functional global patterns to emerge [3]. SI provides a basis with which it is possible to explore collective (or distributed) problem solving without centralized control or the provision of a global model. For example, ants are capable of finding the shortest route between a food source and their nest without the use of visual information and hence possess no global world model, adapting to changes in the environment. Those SI techniques based on the behaviour of real ant colonies used to solve discrete optimization problems are classed as Ant Colony Optimization (ACO) techniques. These have been successfully applied to a large number of difficult combinatorial problems like the quadratic assignment [8] and the traveling salesman [5] problems, to routing in telecommunications networks, scheduling, and other problems. This method is particularly attractive for feature selection as there seems to be no heuristic that can guide search to the optimal minimal subset every time. Additionally, it should be the case that ants will discover best feature combinations as they traverse the graph. Rough set theory [9] has been used successfully as a selection tool to discover data dependencies and reduce the number of attributes contained in a dataset by purely structural methods [4, 6]. Given a dataset with discretized attribute values, it is possible to find a subset (termed a reduct) of the original attributes using rough sets that are the most informative; all other attributes can be removed from the dataset with minimal information loss. Previous methods employed an incremental hill-climbing algorithm to discover such reducts. However, this often led
to feature subsets of a non-minimal size. This paper investigates how ant colony optimization may be applied to this problem of finding minimal rough set reducts. The rest of this paper is structured as follows. Section 2 discusses the fundamentals of rough set theory, in particular focusing on dimensionality reduction, using an example to illustrate the process. The third section describes the new entropy-based feature selection method and applies this to the example dataset. Section 4 introduces the main concepts of ACO and how this framework can be used for feature selection in general as well as for rough set feature selection in particular. Section five details the experimentation carried out and presents the discovered results. The paper concludes with a discussion of the observations and highlights future work in this area.
2
Rough Set Theory
Rough set theory [9] is an extension of conventional set theory that supports approximations in decision making. It possesses many features in common (to a certain extent) with the Dempster-Shafer theory of evidence [13] and fuzzy set theory [10]. The rough set itself is the approximation of a vague concept (set) by a pair of precise concepts, called lower and upper approximations, which are a classification of the domain of interest into disjoint categories. The lower approximation is a description of the domain objects which are known with certainty to belong to the subset of interest, whereas the upper approximation is a description of the objects which possibly belong to the subset. Rough Set Attribute Reduction (RSAR) [4] provides a filter-based tool by which knowledge may be extracted from a domain in a concise way; retaining the information content whilst reducing the amount of knowledge involved. The main advantage that rough set analysis has is that it requires no additional parameters to operate other than the supplied data. It works by making use of the granularity structure of the data only. This is a major difference when compared with Dempster-Shafer theory and fuzzy set theory which require probability assignments and membership values respectively. To illustrate the operation of RSAR, an example dataset (table 1) will be used. Here, the table consists of four conditional features (a, b, c, d), one decision feature (e) and eight objects. The task of feature selection here is to choose the smallest subset of these conditional
features so that the resulting reduced dataset remains consistent with respect to the decision feature. x∈U 0 1 2 3 4 5 6 7
a 1 0 2 1 1 2 2 0
b 0 1 0 1 0 2 1 1
c 2 1 0 0 2 0 1 1
d 2 1 1 2 0 1 1 0
⇒
e 0 2 1 2 1 1 2 1
Table 1: An example dataset
2.1
Theoretical Background
Central to RSAR is the concept of indiscernibility. Let I = (U, A) be an information system, where U is a non-empty set of finite objects (the universe) and A is a non-empty finite set of attributes such that a : U → Va for every a ∈ A. With any P ⊆ A there is an associated equivalence relation IN D(P ): IN D(P ) = {(x, y) ∈ U2 | ∀ a ∈ P a(x) = a(y)} (1) The partition of U, generated by IND(P) is denoted U/P and can be calculated as follows: U/P = ⊗{a ∈ P : U/IN D({a})},
(2)
where A ⊗ B = {X ∩ Y : ∀X ∈ A, ∀Y ∈ B, X ∩ Y 6= Ø} (3) If (x, y) ∈ IN D(P ), then x and y are indiscernible by attributes from P . The equivalence classes of the P -indiscernibility relation are denoted [x]P . For the illustrative example, if P = {b,c}, then objects 1, 6 and 7 are indiscernible; as are objects 0 and 4. IND(P) creates the following partition of U : U/P = U/IN D(b) ⊗ U/IN D(c) = {{0, 2, 4}, {1, 3, 6, 7}, {5}}⊗ {{2, 3, 5}, {1, 6, 7}, {0, 4}} = {{2}, {0, 4}, {3}, {1, 6, 7}, {5}} Let X ⊆ U, the P-lower approximation P X and upper approximation P X of set X can now be defined as: P X = {x | [x]P ⊆ X}
(4)
P X = {x | [x]P ∩ X 6= Ø}
(5)
Let P and Q be equivalence relations over U, then the positive, negative and boundary regions can be defined as: P OSP (Q) =
[
PX
(6)
X∈U/Q
N EGP (Q) = U −
[
PX
(7)
X∈U/Q
BN DP (Q) =
[
PX −
X∈U/Q
[
PX
(8)
X∈U/Q
2.2
Reduction Method
The reduction of attributes is achieved by comparing equivalence relations generated by sets of attributes. Attributes are removed so that the reduced set provides the same quality of classification as the original. A reduct is defined as a subset R of the conditional attribute set C such that γR (D) = γC (D). A given dataset may have many attribute reduct sets, so the set R of all reducts is defined as: R = {X : X ⊆ C, γX (D) = γC (D)}
(10)
The positive region contains all objects of U that can be classified to classes of U/Q using the knowledge in attributes P. For example, let P = {b,c} and Q = {e}, then S P OSP (Q) = {Ø, {2, 5}, {3}} = {2, 3, 5} N EG SP (Q) = U − {{0, 4}, {2, 0, 4, 1, 6, 7, 5}, {3, 1, 6, 7}} = Ø BN DP (Q) = U − {2, 3, 5} = {0, 1, 4, 6, 7}
The intersection of all the sets in R is called the core, the elements of which are those attributes that cannot be eliminated without introducing more contradictions to the dataset. In RSAR, a reduct with minimum cardinality is searched for; in other words an attempt is made to locate a single element of the minimal reduct set Rmin ⊆ R :
This means that objects 2, 3 and 5 can certainly be classified as belonging to a class in attribute e, when considering attributes b and c. The rest of the objects cannot be classified as the information that would make them discernible is absent. An important issue in data analysis is discovering dependencies between attributes. Intuitively, a set of attributes Q depends totally on a set of attributes P, denoted P ⇒ Q, if all attribute values from Q are uniquely determined by values of attributes from P. If there exists a functional dependency between values of Q and P, then Q depends totally on P. Dependency can be defined in the following way: For P,Q ⊂ A, it is said that Q depends on P in a degree k (0 ≤ k ≤ 1), denoted P ⇒k Q, if
Rmin = {X : X ∈ R, ∀Y ∈ R, |X| ≤ |Y |} (11)
k = γP (Q) =
|P OSP (Q)| |U|
(9)
If k = 1, Q depends totally on P, if 0 < k < 1 Q depends partially (in a degree k) on P, and if k = 0 then Q does not depend on P . In the example, the degree of dependency of attribute {e} from the attributes {b,c} is: γ{b,c} ({e}) = =
|P OS{b,c} ({e})| |U| 3 |{2, 3, 5}| = |{0, 1, 2, 3, 4, 5, 6, 7}| 8
The reduct and minimal reduct sets for the example are: R = {{a, b, d}, {a, c, d}, {b, c, d}, {b, d}, {c, d}} Rmin = {{b, d}, {c, d}} The problem of finding a minimal reduct of an information system has been the subject of much research [1]. The most basic solution to locating such a reduct is to simply generate all possible reducts and choose any with minimal cardinality. Obviously, this is an expensive solution to the problem and is only practical for very simple datasets. Most of the time only one minimal reduct is required, so all the calculations involved in discovering the rest are pointless. To improve the performance of the above method, an element of pruning can be introduced. By noting the cardinality of any prediscovered reducts, the current possible reduct can be ignored if it contains more elements. However, a better approach is needed - one that will avoid wasted computational effort. The QuickReduct algorithm given in figure 1, attempts to calculate a minimal reduct without exhaustively generating all possible subsets. It starts off with an empty set and adds in turn, one at a time, those attributes that result in the greatest increase in dependency, until this produces its maximum possible value for the dataset. Note that an intuitive understanding of
QuickReduct(C,D). C, the set of all conditional features; D, the set of decision features. (1) R ← {} (2) do (3) T ←R (4) ∀x ∈ (C − R) (5) if γR∪{x} (D) > γT (D) (6) T ← R ∪ {x} (7) R←T (8) until γR (D) == γC (D) (9) return R
tivation behind this approach is the observation that when the rough set dependency measure is maximized for a given subset, the entropy is minimized. For consistent datasets, the resulting entropy is 0 when the dependency degree is 1. EBR is concerned with examining a dataset and determining those attributes that provide the most gain in information. The entropy of attribute A (which can take values a1 ...am ) with respect to the conclusion C (of possible values c1 ...cn ) is defined as:
Figure 1: The QuickReduct Algorithm. E(A) = −
m X
p(aj )
j=1
QuickReduct implies that, for a dimensionality of n, (n2 +n)/2 evaluations of the dependency function may be performed for the worst-case dataset. According to the QuickReduct algorithm, the dependency of each attribute is calculated, and the best candidate chosen. The next best feature is added until the dependency of the reduct candidate equals the consistency of the dataset (1 if the dataset is consistent). In the example, attribute d is initially chosen as its corresponding degree of dependency is the highest (a value of 0.25). Next, the subsets {a, d}, {b, d} and {c, d} are evaluated. The subset {b, d} produces a dependency degree of 1 and the algorithm terminates as a reduct has been found. The generated reduct shows the way of reducing the dimensionality of the original dataset by eliminating those conditional attributes that do not appear in the set. This process, however, is not guaranteed to find a minimal reduct. Using the dependency function to discriminate between candidates may lead the search down a non-minimal path. It is impossible to predict which combinations of attributes will lead to an optimal reduct based on changes in dependency with the addition or deletion of single attributes. It does result in a close-to-minimal reduct, though, which is still useful in greatly reducing dataset dimensionality.
3
Entropy-Based Data Reduction
A further technique for discovering rough set reducts is entropy-based reduction (EBR), developed from work carried out in [6] and is based on the entropy heuristic employed by machine learning techniques such as C4.5 [11]. The mo-
n X
p(ci |aj ) log2 p(ci |aj )
i=1
(12) This can be extended to dealing with subsets of attributes instead of individual attributes only. Using this entropy measure, the algorithm used in RSAR can be modified to that shown in figure 2. Upon each iteration, the subset with the lowest resulting entropy is chosen. This algorithm requires no thresholds in order to function - the search for the best feature subset is stopped when the resulting subset entropy is equal to the entropy of the full set of conditional attributes. EBR(C). C, the set of all conditional features; (1) (2) (3) (4) (5) (6) (7) (8) (9)
R ← {} do T ←R ∀x ∈ (C − R) if E(R ∪ {x}) < E(T ) T ← R ∪ {x} R←T until E(R) == E(C) return R
Figure 2: The Entropy-based Algorithm. Returning to the example dataset, EBR first evaluates the entropy of each individual attribute: Subset {a} {b} {c} {d}
Entropy 1.1887219 0.75 0.9387219 0.75
The subset with the lowest entropy here is {b} or {d} so one of these is added to the
current feature subset. In this situation, the first encountered subset is chosen, namely {b}. The next step is to calculate the entropy of all subsets containing b and one other attribute: Subset {a, b} {b, c} {b, d}
Entropy 0.5 0.59436095 0
Here, the lowest entropy is achieved with the subset {b, d}. This is the lowest possible entropy for the dataset (it is consistent), resulting in the algorithm terminating. The dataset can now be reduced to these features only. As with QuickReduct, O((n2 + n)/2) entropy evaluations are performed in the worst case.
4
ACO for Feature Selection
The ability of real ants to find shortest routes is mainly due to their depositing of pheromone as they travel; each ant probabilistically prefers to follow a direction rich in this chemical. The pheromone decays over time, resulting in much less pheromone on less popular paths. Given that over time the shortest route will have the higher rate of ant traversal, this path will be reinforced and the others diminished until all ants follow the same, shortest path (the “system” has converged to a single solution). It is also possible that there are many equally short paths this situation can be handled by ACO as well. In this situation, the rates of ant traversal over the short paths will be roughly the same, resulting in these paths being maintained while others are ignored. Additionally, if a sudden change to the environment occurs (e.g. a large obstacle appears on the shortest path), the system responds to this and will eventually converge to a new solution. In general, an ACO algorithm can be applied to any combinatorial problem as far as it is possible to define: • Appropriate problem representation. The problem must be described as a graph with a set of nodes and edges between nodes. • Heuristic desirability (η) of edges. A suitable heuristic measure of the “goodness” of paths from one node to every other connected node in the graph. • Construction of feasible solutions. A mechanism must be in place whereby possible solutions are efficiently created.
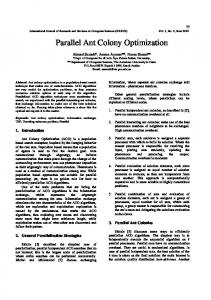
• Pheromone updating rule. A suitable method of updating the pheromone levels on edges is required with a corresponding evaporation rule. Typical methods involve selecting the n best ants and updating the paths they chose. • Probabilistic transition rule. The rule that determines the probability of an ant traversing from one node in the graph to the next. The feature selection task may be reformulated into an ACO-suitable problem. ACO requires a problem to be represented as a graph - here nodes represent features, with the edges between them denoting the choice of the next feature. The search for the optimal feature subset is then an ant traversal through the graph where a minimum number of nodes are visited that satisfies the traversal stopping criterion. Figure 3 illustrates this setup - the ant is currently at node a and has a choice of which feature to add next to its path (dotted lines). It chooses feature b next based on the transition rule, then c and then d. Upon arrival at d, the current subset {a, b, c, d} is determined to satisfy the traversal stopping criterion (e.g. a suitably high classification accuracy has been achieved with this subset). The ant terminates its traversal and outputs this feature subset as a candidate for data reduction. f
a
e b
d
c
{a,b,c,d}
Figure 3: ACO problem representation for FS A suitable heuristic desirability of traversing between features could be any subset evaluation function - for example, an entropy-based measure [11] or the rough set dependency measure [9]. The heuristic desirability of traversal and edge pheromone levels are combined to form the so-called probabilistic transition rule, denoting the probability of an ant at feature i choosing to travel to feature j at time t: pkij (t) = P
[τij (t)]α .[ηij ]β α β l∈J k [τil (t)] .[ηil ]
(13)
i
where k is the number of ants, Jik the set of ant k’s unvisited features, ηij is the heuristic desirability of choosing feature j when at feature i
and τij (t) is the amount of virtual pheromone on edge (i, j). The choice of α and β is determined experimentally. Depending on how optimality is defined for the particular application, the pheromone may be updated accordingly. For instance, subset minimality and “goodness” are two key factors so the pheromone update must be proportional to “goodness” and inversely proportional to size. There is also the possibility of allowing the removal of features here. If feature h has been selected already, an alternative transition rule may be applied to determine the probability of removing this attribute. However, this is an extension of the approach and is not necessary to perform feature selection. The overall process of ACO feature selection can be seen in figure 4. The process begins by generating a number of ants, k, which are then placed randomly on the graph (i.e. each ant starts with one random feature). Alternatively, the number of ants to place on the graph may be set equal to the number of features within the data; each ant starts path construction at a different feature. From these initial positions, they traverse edges probabilistically until a traversal stopping criterion is satisfied. The resulting subsets are gathered and then evaluated. If an optimal subset has been found or the algorithm has executed a certain number of times, then the process halts and outputs the best feature subset encountered. If neither condition holds, then the pheromone is updated, a new set of ants are created and the process iterates once more. To tailor this mechanism to find rough set reducts, it is necessary to use the dependency measure given in equation 9 as the stopping criterion. This means that an ant will stop building its feature subset when the dependency of the subset reaches the maximum for the dataset (the value 1 for consistent datasets). The dependency function may also be chosen as the heuristic desirability measure, but this is not necessary. In fact, it may be of more use to employ a non-rough set related heuristic for this purpose to avoid the pitfalls of a QuickReduct style search.
5
Results
In order to evaluate several of the approaches to rough set-based feature selection, an investigation into how these methods perform in terms of resulting subset optimality has been carried out. Several real and artificial datasets are used for this purpose. In particular, it is inter-
esting to compare those methods that employ an incremental-based search strategy with those that adopt a more complex stochastic mechanism. 5.1
Experimental Setup
Four techniques for finding crisp rough set reducts are tested here on 13 datasets. These techniques are: RSAR (using QuickReduct), an entropy based feature selector EBR (see section 3), GenRSAR (genetic algorithm-based), AntRSAR (ant-based). Before the experiments are described, a few points must be made about the final two approaches, GenRSAR and AntRSAR. GenRSAR employs a genetic search strategy in order to determine rough set reducts. The initial population consists of 100 randomly generated feature subsets, the probability of mutation and crossover set to 0.4 and 0.6 respectively, and the number of generations is set to 100. The fitness function considers both the size of subset and its evaluated suitability, and is defined as follows:
f itness(R) = γR (D) ∗
|C| − |R| |C|
(14)
AntRSAR follows the mechanism described in section 4. Here, the precomputed heuristic desirability of edge traversal is the entropy measure, with the subset evaluation performed using the rough set dependency heuristic (to guarentee that true rough set reducts are found). The number of ants used is set to the number of features, with each ant starting on a different feature. Ants construct possible solutions until they reach a rough set reduct. To avoid fruitless searches, the size of the current best reduct is used to reject those subsets whose cardinality exceed this value. Pheromone levels are set at 0.5 with a small random variation added. Levels are increased by only those ants who have found true reducts. The global search is terminated after 250 iterations, α is set to 1 and β is set to 0.1. The experiments were carried out on 3 datasets from [12], namely m-of-n, exactly and exactly2. The remaining datasets are from the machine learning repository [2]. Those datasets containing real-valued attributes have been discretized to allow all methods to be compared fairly.
(transition rule)
Ants Evaluate Position
continue
Choose Next Feature
stop
Begin Gather Subsets
Generate Ants
Update Pheromone
continue
Evaluate Position
stop
Return Best Subset
Figure 4: ACO-based feature selection overview 5.2
Experimental Results
Table 2 shows the results of the methods on the 13 datasets. It shows the size of reduct found for each method. RSAR and EBR produced the same reduct every time, unlike AntRSAR which often found different reducts and sometimes different reduct cardinalities. On the whole, it appears to be the case that AntRSAR outperforms the other three methods. This is at the expense of the time taken to discover these reducts; in all experiments the rough ordering of techniques with respect to time is: RSAR < EBR ≤ AntRSAR ≤ GenRSAR. The performance of the ant-based and GA-based methods may well be improved by fine-tuning the parameters to each individual dataset. From these results it can be seen that even for small and medium-sized datasets, incremental hill-climbing techniques often fail to find minimal reducts. For example, RSAR is misled early in the search for the LED dataset, resulting in it choosing 7 extraneous features. Although this fault is due to the non-optimality of the guiding heuristic, a perfect heuristic does not exist rendering these approaches unsuited to problems where a minimal subset is essential. However, for most real world applications, the extent of reduction achieved via such methods is acceptable. For systems where the minimal subset is required (perhaps due to the cost of feature
measurement), stochastic feature selection must be used.
6
Conclusion
This paper has highlighted the shortcomings of conventional hill-climbing approaches to feature selection. These techniques often fail to find minimal data reductions. Some guiding heuristics are better than others for this, but as no perfect heuristic exists there can be no guarantee of optimality. From the experimentation, it appears that the entropy-based measure is a more useful hill-climbing heuristic than the rough setbased one. However, the entropy measure is a more costly operation than that of dependency evaluation which may be an important factor when processing large datasets. Due to the failure of hill-climbing methods and the fact that complete searches are not feasible for even medium-sized datasets, stochastic approaches provide a promising feature selection mechanism. This paper proposed a new technique based on Ant Colony Optimization for this purpose. The initial results are promising, but more experimentation and further investigation into its associated parameters is required. Work is being carried out into the application of this to fuzzy-rough set-based feature selection [7], where the problem is further compounded by the non-monotonicity of the fuzzy-rough de-
Dataset M-of-N Exactly Exactly2 Heart Vote Credit Mushroom LED Letters Derm Derm2 WQ Lung
Features 13 13 13 13 16 20 22 24 25 34 34 38 56
RSAR 8 9 13 7 9 9 5 12 9 7 10 14 4
EBR 6 8 11 7 9 10 4 5 9 6 10 14 4
AntRSAR 6 6 10 6(18) 7(2) 8 8(12) 9(4) 10(4) 4 5(12) 6(4) 7(3) 8 6(17) 7(3) 8(3) 9(17) 12(2) 13(7) 14(11) 4
GenRSAR 6(6) 7(12) 6(10) 7(10) 10(9) 11(11) 6(18) 7(2) 8(2) 9(18) 10(6) 11(14) 5(1) 6(5) 7(14) 6(1) 7(3) 8(16) 8(8) 9(12) 10(6) 11(14) 10(4) 11(16) 16 6(8) 7(12)
Table 2: Reduct sizes found for four techniques pendency measure.
Acknowledgements This work is partly funded by the UK EPSRC grant 00317404. The authors are grateful to Dave Robertson and the rest of the Advanced Knowledge Technologies team at Edinburgh for their support.
References [1] J.J. Alpigini, J.F. Peters, J. Skowronek, N. Zhong (Eds.): Rough Sets and Current Trends in Computing, Third International Conference, RSCTC 2002, Malvern, PA, USA, October 14-16, 2002, Proceedings. Lecture Notes in Computer Science 2475 Springer 2002, ISBN 3-540-44274-X. [2] C.L. Blake and C.J. Merz. UCI Repository of machine learning databases. Irvine, University of California, 1998. http://www.ics.uci.edu/~mlearn/. [3] E. Bonabeau, M. Dorigo, and G. Theraulez. Swarm Intelligence: From Natural to Artificial Systems. Oxford University Press Inc., New York, NY, USA. 1999. [4] A. Chouchoulas and Q. Shen. Rough set-aided keyword reduction for text categorisation. Applied Artificial Intelligence, 15(9):843-873, 2001. [5] M. Dorigo, V. Maniezzo and A. Colorni. The Ant System: Optimization by a Colony of Cooperating Agents. IEEE Transactions on Systems, Man, and Cybernetics-Part B, 26(1):2941. 1996
[6] R. Jensen and Q. Shen. A Rough Set-Aided System for Sorting WWW Bookmarks. In N. Zhong et al. (Eds.), Web Intelligence: Research and Development. pp. 95-105, 2001. [7] R. Jensen and Q. Shen. Fuzzy-Rough Sets for Descriptive Dimensionality Reduction. Proceedings of the 11th International Conference on Fuzzy Systems, pp. 29-34, 2002. [8] V. Maniezzo and A. Colorni. The Ant System Applied to the Quadratic Assignment Problem. Knowledge and Data Engineering, 11(5): pp 769-778. 1999. [9] Z. Pawlak. Rough Sets: Theoretical Aspects of Reasoning About Data. Kluwer Academic Publishing, Dordrecht, 1991. [10] Z. Pawlak, A. Skowron. Rough membership functions. In R. Yager, M. Fedrizzi, J. Kacprzyk (eds.), Advances in the DempsterShafer Theory of Evidence, Wiley, New York, pp 251-271. 1994. [11] J.R. Quinlan. C4.5: Programs for Machine Learning. The Morgan Kaufmann Series in Machine Learning. Morgan Kaufmann Publishers, San Mateo, CA. 1993. [12] B. Raman and T.R. Ioerger. Instance-based filter for feature selection. Journal of Machine Learning Research 1. pp 1-23. 2002. [13] A. Skowron, J.W. Grzymala-Busse. From rough set theory to evidence theory, Advances in the Dempster-Shafer Theory of Evidence, ed. by R. Yager, M. Fedrizzi, and J. Kasprzyk, John Wiley & Sons, Inc. 1994.